Evaluation of Baltimore City Health Department Flu Vaccination in Senior Housing Buildings - Lessons Learned for COVID-19 Vaccination
←
→
Page content transcription
If your browser does not render page correctly, please read the page content below
Evaluation of Baltimore
                City Health Department
                Flu Vaccination in Senior
                Housing Buildings
                Lessons Learned for COVID-19
                Vaccination
February 2021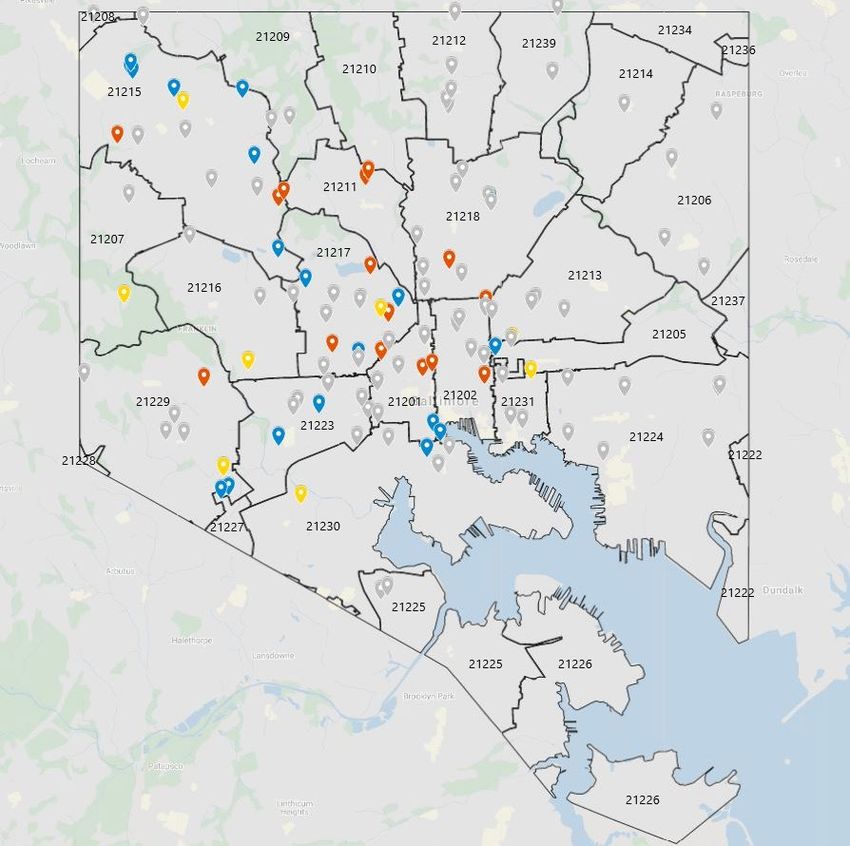
Acknowledgements:
Funding for this evaluation was provided by the Baltimore City Health
Department and Johns Hopkins Bloomberg School of Public Health.

The evaluation was jointly conducted by the International Vaccine Access
Center at the Johns Hopkins Bloomberg School of Public Health and Morgan
State University.

The report was written by Christine Prosperi, MS, Cristina Garcia, PhD, Melissa
Higdon, MPH, Katelyn Dinkel, Naor Bar-Zeev, PhD, Maria Knoll, PhD, Yvonne
Bronner, ScD, and Lois Privor-Dumm, IMBA.

IVAC and Morgan State University would like to thank the survey participants
for their generous time in responding to surveys and interviews; the Morgan
State University survey team including Gloria Ngeno, Abiola O. Awofeso,
Simone Champagnie, Kayla Hall, Ijeoma Uzomo, Christina Abisuga, Kareena
Collins. Jada Ledbetter, Mary Lewis, Zedra Taylor, Toni-Ann Lee, Adewumi
Oladele; data entry team including Lori Niehaus, Jenna Sinkevitch, and Jingyi
Wu; and Reverend Terris King for his advice.

We are grateful for the collaboration of the Baltimore City Health Department,
particularly Rebecca Dineen (Assistant Commissioner of Maternal and Child
Health), Heang Tan (Deputy Commissioner of Aging and Care Services), and
Dr. Letitia Dzirasa (Commissioner of Health). Other Baltimore City Health
Department collaborators included Adam Abadir, Ebony Alderman-McCauley,
Yolanda Johnson, Erika McClammy, Nolan O’Dowd, Amanda Smith, Amber
Summers, Marissa Tan, and many others who provided information and
supported this effort.

Suggested Citation:
International Vaccine Access Center and Morgan State University (2021).
Evaluation of Baltimore City Flu Vaccination Initiative, 2020. Baltimore, MD: IVAC

For inquiries about the content or use of the report, please contact Lois Privor-Dumm,
(Project Lead, IVAC) lprivorl@jhu.edu

Cover page photo credit: Lois Privor-Dumm
BCHD Flu Evaluation Report
February 19, 2021

Table of Contents

EXECUTIVE SUMMARY ........................................................................................................... 5
INTRODUCTION ..................................................................................................................... 7
PROJECT AIMS ....................................................................................................................... 7
OVERVIEW OF RESEARCH PLAN AND APPROACH ................................................................... 8
   Evaluation Timeline ........................................................................................................................................... 9

   Ethical Approvals ............................................................................................................................................. 10

PAPER SURVEY: ESTIMATING COVERAGE (AIMS 1 &2) ......................................................... 10
   Vaccination Coverage Data ............................................................................................................................. 10

   Methods .......................................................................................................................................................... 10
    Target Sample Size ..............................................................................................................................................11

   Paper Survey Results ....................................................................................................................................... 11
     Response Rates ...................................................................................................................................................11
     Flu Vaccination Coverage Among Respondents ..................................................................................................13

   Adjusted Flu Vaccination Coverage Estimates ................................................................................................. 14
     Location of Flu Vaccination Receipt ....................................................................................................................15
     Flu Vaccine Receipt This year vs. Last Year .........................................................................................................15

   Limitations....................................................................................................................................................... 15

PHONE SURVEY: KNOWLEDGE, ATTITUDES AND PERCEPTONS (AIM 3) ................................ 16
   Phone Survey Methods .................................................................................................................................... 16

   Characteristics of Survey Process ..................................................................................................................... 17

   Factors Influencing Flu Vaccine Decision .......................................................................................................... 19

   Knowledge and Perceptions of the Flu and Flu Vaccine ................................................................................... 20

   Attitudes and Perceptions About Flu Vaccine................................................................................................... 21

   Willingness to Receive a COVID Vaccine .......................................................................................................... 22

   Factors Influencing COVID Vaccine Decision .................................................................................................... 24

   Trusted Sources of Information........................................................................................................................ 25

   Non-Trusted Sources of Information ................................................................................................................ 26

   Limitations of the Data .................................................................................................................................... 26

   Future Directions ............................................................................................................................................. 27

KEY INFORMANT INTERVIEWS: EVALUATING FEASIBILITY & SUSTAINABILITY (AIMS 4-6) ..... 27

                                                                                                                                                      Page 3 of 63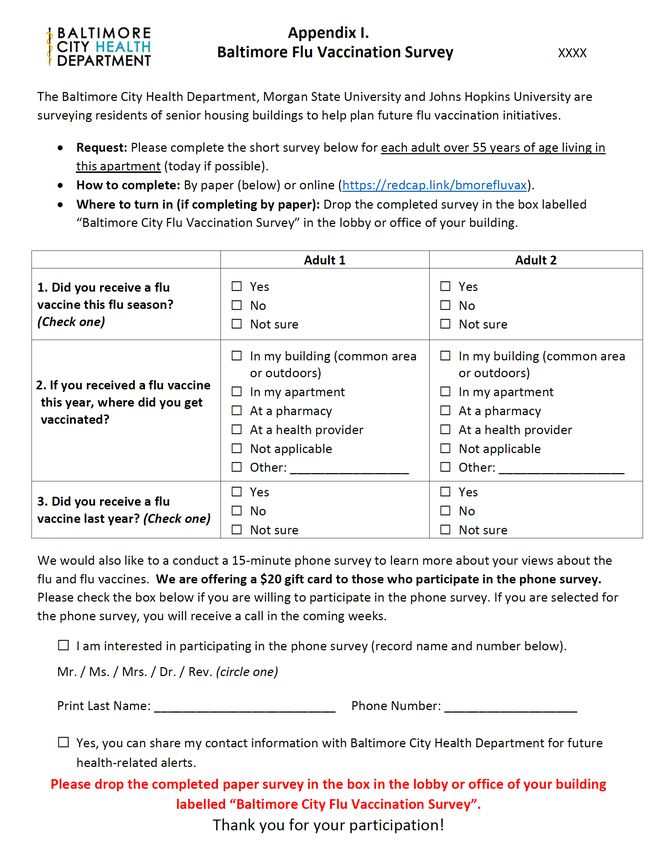
BCHD Flu Evaluation Report
February 19, 2021
Methods .......................................................................................................................................................... 27
Flu Initiative Planning ...................................................................................................................................... 28
BCHD Planning ....................................................................................................................................................28
Building Coordination .........................................................................................................................................29
Building Vaccine Clinics ................................................................................................................................... 30
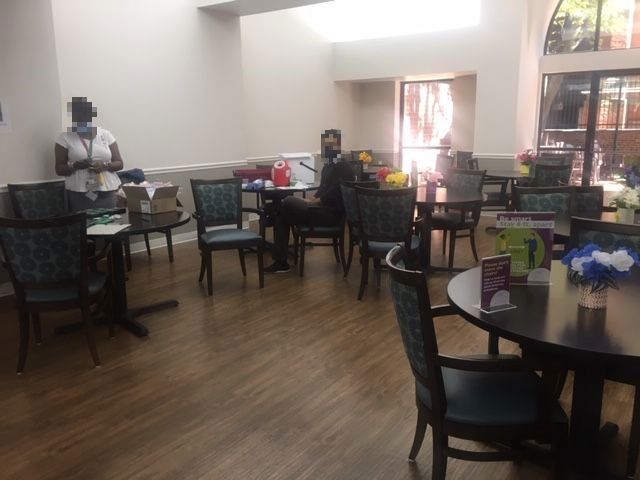
Clinic Observation ...............................................................................................................................................31
Door-to-Door vs. Common Area Strategies.........................................................................................................33
Types of Outreach ...............................................................................................................................................34
Feedback Regarding COVID-19 Vaccines .......................................................................................................... 35
Conclusions and Lessons Learned for Future Initiatives ........................................................ 36
Supplemental Materials ...................................................................................................... 38
Appendices ......................................................................................................................... 43
Page 4 of 63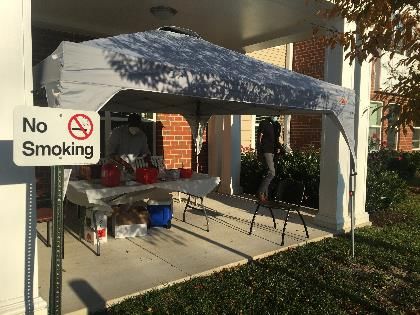
BCHD Flu Evaluation Report
February 19, 2021

EXECUTIVE SUMMARY
Introduction

Influenza (“flu”) and COVID-19 have disproportionately impacted communities of color and older adults in
Baltimore City. Vaccination rates in special populations have been historically low and the Baltimore City
Health Department (BCHD) has prioritized efforts in communities that include older adults and persons with
underlying conditions. To increase vaccination rates of older adults, BCHD offered flu vaccinations for
approximately 13,500 older adults living in 123 senior housing buildings in the City. To determine the
effectiveness, acceptability, and feasibility of the flu vaccination initiative as well as the acceptability of a
future COVID-19 vaccine among senior housing residents, BCHD worked with the International Vaccine Access
Center at the Johns Hopkins Bloomberg School of Public Health and Morgan State University to conduct an
evaluation of the initiative.

Methods

We used a mixed-methods approach and designed our efforts to evaluate the effectiveness of Baltimore City’s
flu vaccination initiative in increasing vaccination, including attitudes and perceptions, social norms,
motivation and practical issues described in the Increasing Vaccination Model (Brewer, et. al). We conducted
a paper survey distributed to senior housing residents in late November 2020 to measure flu vaccination
coverage. Acceptability of the initiative and knowledge, attitudes and perceptions as well as social norms
underlying vaccination behavior was assessed via a phone survey. The phone survey was administered
December 5-21, 2020 to a sample of the residents that completed the paper survey. Feasibility and
sustainability of the initiative were evaluated through key informant interviews with the Health Department,
Resident Service Coordinators (RSC), pharmacists and outreach partners including Coppin State University.

Results

The paper vaccination coverage survey was conducted in 44 buildings which housed over 6800 senior housing
residents. Findings from the paper survey indicate a high level (83.5%) of flu vaccine acceptance among the
1598 (23.5%) respondents. Although there was likely survey response bias, we conclude that flu vaccination
uptake is significantly higher than the 28.5% indicated by ImmuNet. Although it is difficult to ascertain the
true vaccination coverage given the low proportion of respondents, after adjusting for non-response, we
estimate flu vaccine coverage among all buildings was between 42% and 67%. Most people were vaccinated
in a doctor’s office or pharmacy, but 17% were vaccinated in their building. Respondents residing in a building
where a flu vaccine initiative was conducted (by BCHD or by the RSC) were significantly more likely to be
vaccinated than those in buildings with no initiative. Convenience of receiving the vaccine in their building
could influence both those who delay vaccination and those who are never vaccinated.

The phone survey (n=347) found that those who had received flu vaccine this year were more likely to have
reported receiving it last year than non-vaccinated individuals. Females had a higher likelihood of receiving
flu vaccine when compared to males. Nearly 75% of those immunized said it was because they habitually get
it. The key drivers for not getting vaccinated were concerns about vaccine safety or perceived low individual

                                                                                                     Page 5 of 63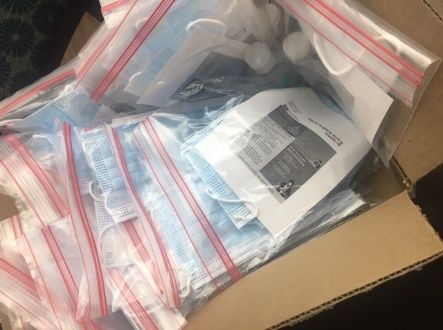
BCHD Flu Evaluation Report
February 19, 2021

risk of flu. Unvaccinated respondents were significantly more likely to worry that flu vaccine may give them
the flu (46% vs. 16% among vaccinated respondents).

Overall, 62% of phone survey respondents indicated they were somewhat or very likely to receive the COVID-
19 vaccine, which was lower (less than 50%) among unvaccinated respondents, especially after excluding
those planning to receive the flu vaccine this year (
BCHD Flu Evaluation Report
February 19, 2021

INTRODUCTION

Influenza (“flu”) and COVID-19 have disproportionately impacted communities of color and older adults
in Baltimore City. Vaccination rates in special populations have been historically low and the Baltimore
City Health Department (BCHD) has prioritized efforts in higher risk communities that include older
adults with underlying conditions, Latinx, and homeless persons. BCHD intensified efforts into these
categories, and, for older adults, they supplemented current strategies by offering onsite flu vaccination
for approximately 13,500 older adults living in 123 senior buildings in the City. The BCHD goal for this
population and across all populations was to achieve 70% coverage of flu immunization for the 2020-
2021 season, consistent with the Healthy People 2020 goals. In previous years, BCHD supported flu
clinics in senior centers, but participation of residents was very low. With the COVID-19 pandemic,
increasing flu vaccination rates of older adults became an even greater priority. In response to
residents’ concerns about going out during the pandemic and increasing their chance of contracting
COVID-19, the BCHD developed a strategy to bring flu vaccination directly to older adults in the senior
housing buildings (“BCHD-led initiative”). To plan clinics, BCHD coordinated directly with Resident
Service Coordinators (RSCs) at the senior housing buildings and provided information and support for
not only flu immunization but also for other City services for older adults. The flu vaccination clinics
were held in October and November 2020. They were organized by BCHD and RSCs and were staffed by
local pharmacists, nursing students from Coppin State University, and community health workers hired
by the City. Additional flu vaccination clinics were organized by buildings independently from BCHD
(“building led initiative”). For some buildings, no initiative was planned; older adults residing in these
buildings had to seek vaccination on their own.

The International Vaccine Access Center (IVAC) at Johns Hopkins Bloomberg School of Public Health and
Morgan State University were asked by BCHD to evaluate the initiative with the goal of assessing
program effectiveness, acceptability, feasibility and sustainability. Members of BCHD were also part of
the evaluation team to advise and facilitate the process. The results of the evaluation were presented
to BCHD to inform future flu vaccination efforts and to inform COVID-19 vaccination strategies for the
residents of senior housing. A Town Hall with the Health Commissioner, Senior Housing Residents and
Staff was held on February 2, 2021 to share results.

PROJECT AIMS

The evaluation was conducted with the following aims.

        1. Determine if the program met the 70% immunization rate target among residents living in
           senior housing buildings [program effectiveness]
        2. Compare coverage achieved among buildings, based on the primary vaccine delivery
           strategy used (building-led initiative vs. city-led initiative vs. no initiative) [program
           effectiveness]

                                                                                               Page 7 of 63
BCHD Flu Evaluation Report
February 19, 2021

        3. Assess knowledge, attitudes and behavior around the value of flu and future COVID-19
           vaccines to inform the design of future flu and COVID-19 vaccine campaigns. [acceptability]
        4. Describe resources required to plan and implement the initiative [feasibility, sustainability]
        5. Evaluate program reach, feasibility and sustainability based on human resource
           requirements [feasibility, sustainability]
        6. Identify bottlenecks or improvements to be implemented that can help inform the design of
           a COVID-19 vaccine program [feasibility, sustainability]

OVERVIEW OF RESEARCH PLAN AND APPROACH

To achieve the study aims, a mixed methods approach (qualitative and quantitative) was used. The
evaluation was grounded in The World Health Organization’s Increasing Vaccination Model (Brewer, et
al.) to measure the impact of attitudes and beliefs, social processes, motivations, and practical issues
related to the program on vaccination behavior (Figure 1). Resident Service Coordinators, who were key
partners in conducting the study given that they facilitated communication to residents of senior
housing, were briefed on the study approach in virtual meetings and in a series of emails prior to each
step. Effectiveness of the BCHD’s flu vaccination initiative (Aims 1 and 2) was evaluated using a paper
survey distributed to senior housing residents to measure vaccination coverage. Acceptability of the
initiative (Aim 3) was assessed via a phone survey administered to a sample of respondents completing
the paper survey. Finally, feasibility and sustainability of the initiative (Aims 4, 5, and 6) were evaluated
through key informant interviews with the Health Department, Resident Service Coordinators,
pharmacists and others. The methods for these three primary aims are further described under the
appropriate sections in this report.

Figure 1. Increasing Vaccination Model

                                                                                                 Page 8 of 63
BCHD Flu Evaluation Report
February 19, 2021

 Evaluation Timeline
The general timeline of evaluation activities was as follows:

Figure 2. Timeline of Evaluation Activities

In August of 2020, BCHD contacted senior housing buildings to inquire about past flu vaccination
activities at the buildings. Approximately 75% of buildings responded of which 50% reported holding a
vaccination event in the past with local pharmacies or schools. In September 2020, IVAC and BCHD held
a virtual meeting with senior housing RSCs to provide education on flu and flu vaccine; materials were
provided to RSCs to share with their residents. After contacting building RSCs again in late September
and October to determine each building’s plans for holding or not holding a vaccination clinic this year,
54 buildings opted to have BCHD conduct a vaccination clinic at their building, or a nearby building.
BCHD-led clinics, carried out with the support of RiteAid, were held in late October through mid-
November.

Buildings were selected and contacted for participation in the evaluation in mid-November. The majority
of paper surveys, along with informational flyers, were delivered to RSCs of the 44 participating
buildings at a BCHD event providing personal protective equipment for senior housing buildings; direct
delivery of surveys was arranged for a small number of buildings. RSCs were asked to post flyers and
distribute the surveys to their residents. After 7-10 days, IVAC team members collected the completed
surveys from all 44 buildings. JHU and MSU students entered the paper survey responses into REDCap
during the last week of November and the first week of December.

MSU and IVAC trained MSU students in proper interview techniques beginning in November, ending
with REDCap and mock interview virtual training sessions held December 2-4. A sample of paper survey
respondents who agreed to participate in the phone survey were selected for inclusion. Phone
interviews to assess acceptability of flu and COVID-19 vaccination were conducted December 5-21. All
phone interview responses were entered by the students directly into REDCap in real time.

Finally, Key informant interviews occurred throughout the month of December 2020.

Analyses of the paper survey, phone survey, and key informant interviews were completed in January
2021.

                                                                                              Page 9 of 63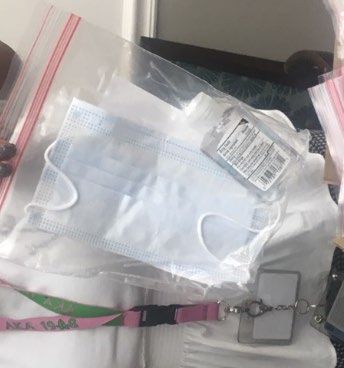
BCHD Flu Evaluation Report
February 19, 2021

 Ethical Approvals
Johns Hopkins School of Public Health: The study application was reviewed and deemed to be Public
Health Surveillance and not human subjects research by the Johns Hopkins School of Public Health
Institutional Review Board.

Baltimore City Health Department: Because the evaluation was commissioned by the BCHD, approval
was not required.

Morgan State University: The Morgan State University Institutional Review Board approved the
evaluation activities on November 10, 2020 (IRB #20/11-0144).

PAPER SURVEY: ESTIMATING COVERAGE (AIMS 1 &2)

 Vaccination Coverage Data
The State of Maryland currently uses a web-based electronic immunization registry, ImmuNet, to track
vaccinations across the state. In October of 2019, the State of Maryland mandated that all vaccinations
administered in the state be reported in ImmuNet, with the exception of nursing homes. However,
comparison of ImmuNet data with other survey data indicates that, despite the 2019 mandate, there is
likely substantial underreporting of immunizations in ImmuNet for various reasons (e.g., there is no
process for identifying providers who do not report, geocoding issues prevent some individuals from
being counted as Baltimore City residents, addresses are not always updated leading some individuals to
be incorrectly included or excluded from a count of vaccinations for Baltimore City, use of third-party
data companies to upload data to ImmuNet can lead to incorrect and missing data).

In the absence of other available data on immunizations for Baltimore City, it is not possible to fully
gauge the extent of potential underreporting in ImmuNet. Using data obtained from this evaluation, we
hoped to arrive at a better understanding of flu vaccination coverage in the senior housing population
and also of the accuracy of the ImmuNet data.

 Methods
To determine if the program met the 70% immunization rate target among an estimated 13,500
residents living in senior housing buildings and to compare coverage between buildings based on the
primary vaccine delivery strategy used, a short paper survey was distributed to all residents of a selected
sample of the 123 senior housing buildings in Baltimore City. Buildings were selected in an attempt to
achieve a representative sample and adequate representation of key factors such as poverty level and
type of flu vaccination initiative in the building (e.g. building-led, BCHD-led, no initiative). BCHD
contacted the RSC or property manager of all selected buildings to request participation, and BCHD’s
personal protective equipment (PPE) distribution event was leveraged to disseminate study materials
(paper survey, flyers, drop boxes, etc.) to RSCs of participating senior housing buildings. For participating

                                                                                                Page 10 of 63
BCHD Flu Evaluation Report
February 19, 2021
buildings not attending the PPE event, study materials were delivered directly to the building by an IVAC
study team member.
The short survey, designed by IVAC and MSU, included questions on flu vaccine receipt this season, the
location of vaccination, and flu vaccine receipt last season (Appendix 1). Residents of the selected
buildings were offered the opportunity to participate in a follow-up survey for which they would receive
a $20 gift card. Once completed, respondents returned the survey to a locked drop box placed in a
central location at the building. After approximately 1 week, surveys were collected from buildings by
IVAC and entered into REDCap by JHU and MSU students. Respondents were also given the option to
enter responses online into REDCap rather than complete the paper survey.
Target Sample Size
We aimed to estimate coverage among senior housing residents stratified by type of flu vaccination
initiative conducted in the buildings: BCHD-led initiatives (60 buildings, 7020 units), building-led
initiatives (39 buildings, 4524 units) and buildings with no initiative or buildings that did not report an
initiative (25 buildings, 1939 units). These figures were based on building plans at the time of selection,
and the number in each category did change slightly.
As many buildings as study resources allowed were sampled for participation, distributed across the
three strata. Initial selection included 13 BCHD-led, 13 building-led, and 11 no initiative/no response
buildings. Within each of the 3 strata, buildings were selected with probability of selection proportional
to population size as determined by the number of units in a building, while ensuring representation
from census tracts of varying poverty levels. In addition to these 37 buildings selected proportionally to
population size, all 6 buildings (3 BCHD-led and 3 building-led) that conducted door-to-door flu
vaccination within their buildings were selected to participate. We aimed for a 50% response rate
among residents at participating buildings.
Paper Survey Results
Response Rates
Of the 43 buildings initially selected, 31 agreed to participate in the evaluation. Thirteen additional
buildings present at the BCHD PPE distribution event were added to the evaluation based on their
willingness to participate. Thus, 44 buildings representing approximately 51% of the senior housing
population agreed to participate in the evaluation (Supplemental Table 1). Locations of participating and
non-participating buildings are shown in Figure 3.
Page 11 of 63BCHD Flu Evaluation Report
February 19, 2021
Figure 3. Map of Participating and Non-participating Senior Housing Buildings
The most common zip codes among the participating buildings were 21215 (25% of participating
buildings), 21217 (15.9%), and 21201 (9.1%); the most common zip codes of non-participating buildings
were 21218 (11.4%), 21224 (10.1%), 21223 (7.6%), and 21217 (6.3%) (Figure 3).
In total, 1612 respondents, representing approximately 12% of the senior housing population,
completed the paper survey (Supplemental Table 1). The mean response rate across all buildings was
23.5%, but ranged widely between buildings from 1% to 61%. Response rates also varied across
initiative type: 75% (15/20) of buildings with a building-led initiative had a response rate greater than
20% compared to 50% (7/14) of buildings with a BCHD-led initiative and 37.5% (3.8) of buildings with no
initiative (Figure 4).
Page 12 of 63BCHD Flu Evaluation Report
February 19, 2021
Figure 4. Paper Survey Response Rate by Building
Flu Vaccination Coverage Among Respondents
Among 1598 respondents with known flu vaccination status this season, 1335 (83.5%) received vaccine.
A lower proportion of respondents in buildings with no initiative indicated they received vaccine (Table
1); this difference was statistically significant (chi square p-value = .01).
Table 1. Flu Vaccination Receipt Among Respondents by Type of Building Vaccination Initiative
Flu Vaccination Flu Vaccination Coverage among Respondents1
Initiative Type % (95% CI2)
BCHD-led initiative 84.6 (81.2-87.4)
(n=525)
Building-led 84.7 (82.1-87.0)
initiative (n=844)
No 76.9 (71.0-81.9)
initiative/Unknown
(n=229)
All buildings 83.5 (81.6-85.3)
(n=1598)
Restricted to respondents with known flu vaccination status.
1
Wilson score interval
2
Page 13 of 63BCHD Flu Evaluation Report
February 19, 2021
Adjusted Flu Vaccination Coverage Estimates
We adjusted the observed flu vaccination coverage among survey respondents to account for non-
response by assuming various levels of uptake among the non-responders. Assuming non-responders
have the same uptake as responders within each building, the estimates equal the observed uptake
among survey respondents (row 1, Table 2). This provides us with an upper limit, since we know uptake
is likely lower in non-responders. Assuming no non-responders were vaccinated provides us with a lower
limit (row 5, Table 2).
We also calculated flu vaccination uptake assuming non-responders had an uptake equal to estimates
provided by ImmuNet (row 4, Table 2) as well as estimates provided by 2 national surveys (rows 2 and 3,
Table 2). ImmuNet estimates are specific to Baltimore City residents 60 years and older, but likely an
underestimate due to incomplete reporting. The estimates from the national surveys were restricted to
African-Americans 65 years and older and were further restricted to Maryland metropolitan city centers
(2019 Behavioral Risk Factor Surveillance System [BRFSS]) or the Baltimore-Columbia-Towson MSA
(2017 BRFSS Selected Metropolitan/Micropolitan Area Risk Trends [SMART] Survey). While these
estimates are not specific to Baltimore City, they may be the best available estimates for the Baltimore
City senior housing population. Assuming true flu vaccination coverage among non-responders lies
somewhere between 28% (ImmuNet) and 62% (2019 BRFSS Survey), we estimate that 42%-67% of
senior housing residents received flu vaccine this year.
Reported flu vaccine coverage of phone survey respondents was 83.5%, but adjusting for non-response
we estimate that 42%-67% of senior housing residents were vaccinated against flu.
Table 2. Estimated Flu Vaccination Uptake Among Senior Housing Buildings under Various Assumptions
Estimated Flu Vaccination Uptake (%)
BCHD-led Building-led No initiative Total
1 1 1 1
(N=15,525 ) (N=20,844 ) (N=8,229 ) (n=43,1598 )
Assuming non-respondents = 84.6 84.7 76.9 83.5
respondents (upper limit)
2
Assuming 62% uptake among non- 66.1 69.6 64.8 67.3
respondents
3
Assuming 57% uptake among non- 62.0 66.3 60.9 63.6
respondents
4
Assuming 28.5% uptake among non- 38.6 47.2 38.3 42.1
respondents
Assuming 0% uptake among non- 15.3 28.2 15.8 20.7
respondents (lower limit)
ImmuNet ( ≥ 60 years of age) 28.5
1 Analysis sample size (where flu vaccine receipt is known)
2 2019 BRFSS (survey weights applied, restricted to Maryland, metropolitan area city center, African-American, ≥ 65 y)
3 2017 BRFSS SMART Survey (survey weights applied, restricted to Baltimore-Columbia-Towson MSA, African-American, ≥ 65 y)
4 2020 ImmuNet Data (60+ y)
Page 14 of 63BCHD Flu Evaluation Report
February 19, 2021
Location of Flu Vaccination Receipt
The most common location of vaccination was at a healthcare Most respondents were vaccinated at
provider. Among respondents who received flu vaccine this year, a doctor’s office or pharmacy. Nearly
45% indicated they were vaccinated at a healthcare provider, 1 in 5 received flu vaccine in their
including Veterans Administration, underscoring the important building.
role healthcare providers play in vaccination. A large proportion of senior housing respondents (32%)
were vaccinated at a pharmacy while 17% were vaccinated in their building.
Flu Vaccine Receipt This year vs. Last Year
Among 1572 respondents with known flu vaccination status for both last year and this year (as reported
by respondents), 167 (58.2%) reported not receiving the vaccine both years, 1196 (76.1%) reported
receiving the vaccine both years, 120 (7.6%) reported receiving the vaccine this year but not last year,
and 89 (5.7%) reported receiving the vaccine last year but not this year. Thus, among respondents there
was an overall increase in the number vaccinated this year (n=1316) compared to last year (n=1285)
with an overall ‘gain’ of 31 respondents vaccinated (Figure 3).
Figure 5. Number of Respondents Receiving Flu Vaccination Last Year by This Year’s Vaccination Status
Limitations
Limited availability of building-level data prevents us from a clear understanding of any bias resulting
from potential differences in participating vs. non-participating buildings. Nevertheless, comparison of
participating and non-participating buildings using the limited data we do have did not identify any
unexpected differences. As described above, buildings were selected for participation with probability of
selection proportional to size with implicit stratification by the percent of the population living below
poverty level in the census tract to ensure representation of buildings from across the socioeconomic
spectrum. Because not all initially selected buildings could participate, convenience sampling was also
utilized. As a result of the size-proportional sampling methodology, buildings participating in the
evaluation were larger than those not participating. Including larger buildings would allow us to sample
Page 15 of 63BCHD Flu Evaluation Report
February 19, 2021
a larger proportion of the senior housing population. The median number of units among buildings
participating in the evaluation was 144 compared to 65 among non-participating buildings.
No statistically significant difference was found in the median percent of the population living below
poverty level when comparing census tract level data of participating and non-participating buildings;
the median percentage of the population living below poverty in census tracts of participating buildings
was 19.4% compared to 25.3% in non-participating buildings (p = .52). Sixteen percent of participating
buildings and 16.5% of non-participating buildings were managed by the Housing Authority of Baltimore
City (HABC); this difference was not statistically significant (p = .94)
Potential response bias among respondents of participating buildings is another limitation. Self-reported
vaccination may itself be associated with propensity to participate in the survey, and may upwardly bias
the coverage estimate. In addition, various reasons unique to this evaluation, may explain why senior
housing residents may not have participated in the paper survey other than unwillingness/lack of
interest. These include absence from the building during the short duration of the survey, lack of
awareness about the survey (some building RSCs did not post informational flyers in the building), and
lack of convenience/accessibility (in some buildings, surveys were placed in a common area rather than
distributed to the residents, preventing less mobile respondents from completing it). Because we
collected data on respondents only, but have no data on non-respondents, the degree and directionality
of such biases is not possible to ascertain.
In making extreme assumptions about flu vaccination uptake among non-respondents, we derived
minimum and maximum estimates of vaccination uptake among senior housing residents in Baltimore
City. We then narrowed the window using estimates from ImmuNet and from national surveys. While
results from these surveys can be restricted to older African-Americans in metropolitan areas of
Maryland and may provide the best estimates, it is important to note that these surveys were not
particular to Baltimore City, but included other metropolitan areas in Maryland as well. The older
African-American population in Baltimore City may differ in terms of flu vaccination coverage from other
metropolitan areas in Maryland. In addition, there may be differences in coverage between older adults
living in senior housing and the general older adult population.
PHONE SURVEY: KNOWLEDGE, ATTITUDES AND PERCEPTONS (AIM 3)
Phone Survey Methods
A survey tool was developed by the team and pre-tested with five older adults to ensure the questions
were easily understood and that the survey would take no longer than 15 minutes. Modifications were
made and the tool was finalized. The target sample size for the phone survey was 340, aiming for
approximately 170 individuals who received a flu vaccine this year and 170 who did not. The sample size
was set to detect a difference of ±15 percentage points between these two groups in the percentage of
respondents who intend to get a COVID-19 vaccine when it became available (β=0.80, α=0.05). The
Page 16 of 63BCHD Flu Evaluation Report
February 19, 2021
phone survey sample was derived from the 881 respondents of the paper survey who agreed to
participate in the phone survey and provided contact information. Anticipating high non-response
levels, all who did not receive a flu vaccine this year were sampled (n=202; 118% of target). A subset of
respondents who did receive a flu vaccine this year were sampled (n=509; 299% target), attempting to
sample an even number by senior housing building (N=44).
Ten students from Morgan State University were trained to conduct the phone interviews. Prior to
beginning the phone surveys, the students held weekly meetings with the evaluation co-lead to review
the questionnaire and survey methods, understand background on the senior housing buildings, and to
learn interviewing techniques. Students were trained on the data collection system (REDCap) and
conducted mock interviews with trainers from the Evaluation Team. Students were also trained to
provide respondents with the Maryland Access Point (MAP) phone line for further information about
other health or social needs.
Students were provided a list of participants to call and made up to five attempts to reach each
potential respondent. Verbal consent from the respondent was obtained before beginning the
interview (see Appendix II for questionnaire). All responses were recorded in a password-protected
data collection system (REDCap). For questions on factors influencing decisions and sources of
information, open-ended responses were recorded then matched to pre-specified categories by the
interviewer; respondents were not provided options to choose from and may have reported multiple
factors. Interviewers audio-recorded a sample of interviews during the first week of interviews, after
obtaining verbal permission, for quality control purposes. Feedback from the quality control review was
used to improve the interview process. Respondents were offered a $20 gift card in appreciation for
their time.
Characteristics of Survey Process
Seven hundred and eleven individuals were attempted for the phone survey in total, with 347 phone
surveys completed, exceeding the target sample size. Phone surveys were conducted between
December 5th to December 21st, 2020, with each student conducting between 15 to 48 interviews.
Results of the effort are shown below in Table 3.
Table 3. Status of Phone Interviews
Status Vaccinated Not Vaccinated Total
n (%) n (%)
Phone interview sample N=509 N=202 N=711
Interview completed 259 (50.9) 88 (43.6) 347 (48.8)
Refused 46 (9.0) 38 (18.8) 84 (11.8)
Call not answered 149 (29.3) 45 (22.3) 194 (27.3)
Call answered but selected individual 5 (1.0) 6 (3.0) 11 (1.6)
unavailable
Hung up 19 (3.7) 4 (2.0) 23 (3.2)
Page 17 of 63BCHD Flu Evaluation Report
February 19, 2021
Wrong number 19 (3.7) 16 (7.9) 35 (4.9)
Incomplete, other reason 12 (2.4) 5 (2.5) 17 (2.4)
Despite sampling all paper survey respondents who did not receive a flu vaccine, we did not achieve an
even split between vaccinated and unvaccinated individuals; the sample of respondents was biased
towards those that received flu vaccine (n=259, 75%). Completion rates were slightly lower for non-flu-
vaccine recipients (44%) compared to flu vaccine recipients (51%). Of note, forty-five percent of
respondents who did not receive a flu vaccine this year reported they plan to do so but had not by the
time the phone survey was completed (N=40). This suggests the ‘not vaccinated’ group includes both
respondents that delayed receiving flu vaccine and respondents that opted not to receive the vaccine at
all. A subset of analyses further restricting the ‘not vaccinated’ group to those with no plans to receive a
flu vaccine this year is presented in supplemental materials.
The demographic characteristics of our sample are presented below in Table 4. Two-thirds of the
sample were female, three-quarters between 55-75 years old, and 81% African American (a higher
proportion than the racial breakdown of all Baltimore City residents [66%, 2019 American Community
Survey]). The majority of respondents reported at least one underlying condition, with a slightly higher
percent observed among flu vaccine recipients. Flu vaccine recipients were more likely to be female.
Table 4. Demographic Characteristics of Phone Survey Respondents
n (col %) P-value flu
Characteristics All participants No flu vaccine Flu vaccine vs non-flu
(N=347) recipients (N=88) recipients (N=259) recipient
Female 227 (65.4) 47 (53.4) 180 (69.5) 0.006
Age
55 - < 65 y 92 (26.5) 31 (35.2) 61 (23.6) 0.05
65 - < 74 170 (49.0) 42 (47.7) 128 (49.4)
> 75 years 85 (24.5) 15 (17.1) 70 (27.0)
Race
African American 281 (81.0) 75 (85.2) 206 (79.5) 0.11
White 50 (14.4) 8 (9.1) 42 (16.2)
Other 7 (2.0) 1 (1.1) 6 (2.3)
Refused 9 (2.6) 4 (4.6) 5 (1.9)
Underlying conditions 251 (72.3) 58 (65.9) 193 (74.5) 0.10
Received flu vaccine last year 268 (77.2) 30 (34.1) 238 (91.9)BCHD Flu Evaluation Report
February 19, 2021
building but opted to receive it elsewhere, possibly due to timing of the clinic or other reasons, and 29%
were unsure if it was offered.
Table 5. Location of Flu Vaccine Receipt among Vaccine Recipients (Phone Survey)
Location of flu vaccine receipt n (%) (N=259)
Primary care doctor 100 (38.6)
Other health facility, a specialist 14 (5.4)
Pharmacy or supermarket 84 (32.4)
At my building (indoor or outdoor common area or inside home) 53 (20.4)
At a vaccination clinic separate from my building 4 (1.5)
Other 4 (1.5)
Restricted to those receiving a flu vaccine.
Factors Influencing Flu Vaccine Decision
Respondents were asked what influenced their decision to get, or to not get, the flu vaccine this year
(Figure 6, Supplemental Table 2). Three-fourths of vaccine recipients reported they always get
vaccinated. This aligns with the observation that 98% of those receiving a vaccine this year reported
they plan to receive it again next year. A third of flu
Flu Vaccine recipients vaccine recipients noted that concerns about flu illness
(based on personal experience with prior illness) and/or
“I have been getting it every year because
my doctor really wants me to have it.” concerns about potential complications due to age or
underlying conditions influenced their decision to get
“[I] got bacterial pneumonia and never
vaccinated. Twenty percent of vaccine recipients were
wanted to experience that again.”
influenced by a doctor’s recommendation, though this
was rarely mentioned among unvaccinated respondents.
General vaccine safety concerns or prior reaction from the
vaccine (e.g., “It made my arm hurt the last time I took it”) Non-flu vaccine recipients
were commonly mentioned among unvaccinated “Vaccines do not work for me.”
respondents; this increased to more than half of non-
“So far, so good, never had [the flu], never
vaccine respondents when excluding those planning to be took [the vaccine].”
vaccinated this year. Other common reasons mentioned by
non-vaccine recipients included lower perception of risk of “The first time I took the flu shot I got sick ,
flu illness or complications as well as standard practice (i.e., so I never got it again.”
“never get vaccinated”).
Page 19 of 63BCHD Flu Evaluation Report
February 19, 2021
Figure 6. Factors Influencing Flu Vaccine Decision
Categories not mutually exclusive; respondents may have reported multiple reasons.
Knowledge and Perceptions of the Flu and Flu Vaccine
Respondents were provided a series of statements about flu illness and flu vaccine and asked if they
agreed or disagreed with each statement. The percent of respondents perceiving flu illness to be
serious with potential to result in hospitalization or death was similar between flu and non-flu vaccine
recipients; approximately 50% of respondents noted they fear flu illness and worry about
hospitalization, and 75% agreed flu can result in death (Figure 7).
Page 20 of 63BCHD Flu Evaluation Report
February 19, 2021
Figure 7. Knowledge and Perceptions of the Flu
Attitudes and Perceptions About Flu Vaccine
Compared to unvaccinated respondents, vaccinated respondents were more likely to agree that the
vaccine was effective (84% vs. 72%) and that most people their age should get the vaccine (93% vs. 68%)
(Figure 8). Perceived vaccine effectiveness among non-vaccine recipients decreased when excluding
those planning to be vaccinated this year (Supplemental Figure 1).
Non-vaccine recipients were significantly more likely to worry the Non-flu vaccine recipients were
vaccine may give them the flu (46% vs. 16% among vaccine more likely to worry the flu
recipients); this difference increased when excluding those planning vaccine will give them the flu.
to be vaccinated this year (Supplemental Figure 1). While few
vaccine recipients worried the vaccine may give them the flu, 44% agreed most people they know have
that concern. Fewer non-vaccine recipients believed the vaccine is available for free compared to those
receiving the vaccine (75% vs. 87%). Half of non-vaccine respondents agreed that having the vaccine
Page 21 of 63BCHD Flu Evaluation Report
February 19, 2021
offered in their building would have increased the likelihood they get vaccinated, however this
decreased to only 23% when excluding those planning to be vaccinated this year (Supplemental Figure
1).
Figure 8. Attitudes and Perceptions of the Flu Vaccine
Willingness to Receive a COVID Vaccine
Respondents were asked how likely they would be to receive an approved COVID-19 vaccine if it were
easily accessible (Figure 9, Supplemental Table 3). Of note, the phone surveys were conducted either
just before Emergency Use Authorization was granted by the FDA or just following authorization when
the U.S. had just started vaccinating healthcare workers. This may have influenced respondents’ view on
the vaccine.
More than 6 in 10 respondents reported that they are likely to get the COVID-19 vaccine.
Among those not receiving and not planning to receive a flu vaccine, the likelihood of receiving a
COVID-19 vaccine drops to less than 3 in 10.
Overall, 62% of respondents indicated they were somewhat or very likely to receive the vaccine.
However, the sample was biased toward those receiving a flu vaccine, and willingness to receive a
Page 22 of 63BCHD Flu Evaluation Report
February 19, 2021
COVID-19 vaccine varied by flu vaccine receipt. Less than 50% of the non-flu vaccine recipients reported
being likely to get the COVID-19 vaccine, which decreased to under 30% when excluding those planning
to receive the flu vaccine this year. Even among the flu vaccine recipients, about 1 in 3 were either
unlikely to get the vaccine or undecided.
Fewer female respondents indicated they were likely to receive the COVID-19 vaccine compared to male
respondents (54% vs. 77%) (Figure 10). Increased hesitancy was also observed by race, with 60% of
African American respondents indicating they were likely to receive the vaccine compared to 76% of
White respondents. Older respondents (> 75 years) were more likely to receive the COVID vaccine
compared to younger respondents (71% vs 58% among 55 to < 74 years). No differences were observed
by presence of underlying conditions.
Figure 9. Likelihood of Receiving a COVID-19 Vaccine, Overall and by Flu Vaccine Receipt
Page 23 of 63BCHD Flu Evaluation Report
February 19, 2021
Figure 10: Likelihood of Receiving a COVID-19 Vaccine, by Demographic Characteristics
Factors Influencing COVID Vaccine Decision
Of those respondents likely to receive a vaccine, 70% indicated concerns about COVID illness or
complications, and concerns about the large number of people becoming ill and dying as a factor
influencing their decision to be vaccinated (Figure 11, Supplemental Table 4). Twenty-five percent of
those individuals valued recommendation or opinion of a doctor or health official (e.g., CDC, FDA) to
influence their decision; conversely, few of the respondents unlikely to receive the vaccine cited these
as factors influencing their decision. Past positive experiences with the flu vaccine and general trust in
science and other vaccines were also reported among those likely to receive the COVID vaccine.
Respondents likely to get COVID-19 Vaccine
“At my age, I don't want to take a chance. I have to protect myself from getting sick.”
"I think after seeing the news yesterday and the lady who got the first vaccine, she [was] feeling fine."
Page 24 of 63BCHD Flu Evaluation Report
February 19, 2021
Half of the undecided respondents and over 80% of the respondents unlikely to receive the vaccine cited
a lack of trust in the vaccine or concerns about safety as factors influencing their decision. The most
common concerns reported were related to the speed of manufacturing, lack of information available,
and potential side effects. One-quarter of the undecided and unlikely respondents citing concerns
reported a desire to wait for others to be vaccinated first to evaluate effectiveness and safety. A desire
to wait for others to be vaccinated was also noted among those likely to be vaccinated. Some
respondents also highlighted mistrust in the medical system and government as influencing their
decisions.
Respondents unlikely to get COVID-19 Vaccine or unsure
“I do not wish to be a guinea pig.”
“I will not trust it unless I see other people have it for at least 2 years and they have no problems.”
“I'm scared that the vaccine will give me the virus.”
Figure 11: Factors Influencing COVID-19 Vaccine Decision, by Likelihood of Future Vaccine Receipt
Trusted Sources of Information
Respondents were asked who they rely on most for information about flu vaccine (Table 6). The most
often cited source was medical professionals, although
this was more common among flu vaccine recipients Medical professionals are trusted sources when it
comes to information about flu vaccination, but
than those not receiving the flu vaccine. Restricting
less so for those that don’t receive the flu vaccine.
the non-vaccine recipients to those with no plans to
Page 25 of 63BCHD Flu Evaluation Report
February 19, 2021
receive the flu vaccine, just over 50% reported medical professionals as a trusted source of information
versus over 80% for those that did or were planning to receive a vaccine.
One-third cited media or internet (primarily news on television) and 16% cited family or friends as
trusted sources of information, with no difference by flu vaccine receipt. Both vaccine and non-vaccine
recipients reported they do their own research, taking information from various sources then deciding.
No differences in trusted sources were observed when About 1/3 of respondents cite the media or
stratifying respondents by likelihood of receiving the internet as a trusted source of information.
COVID vaccine.
Table 6: Trusted Sources of Information by Flu Vaccine Receipt
n (col %)
No flu vaccine Flu vaccine
Source of Information p-value
recipients recipients
(N=88) (N=259)
Medical professionals 58 (65.9) 226 (87.3)BCHD Flu Evaluation Report
February 19, 2021
the phone survey due to refusal or individuals not answering the phone. A second limitation of the
survey sample is the non-vaccine recipient group was likely a mix of vaccine hesitant with no plans to
receive a vaccine this year and those planning to be vaccinated who had delayed for various reasons. To
address this, analyses were presented restricting to those most likely to represent vaccine hesitant
individuals which demonstrated this subgroup differed from those who planned to receive a vaccine.
Future Directions
Based on the feedback in the phone surveys, there will be a need for education and providing
information that allays fears, particularly for the substantial “wait and see” population. Additionally, a
segment of the population, that may represent 30% or greater, could require additional focus to better
understand attitudes and perceptions which may be influenced by social determinants of health or
historical or current mistreatment by the health system or government. Building residents’ trust and
identifying trusted messengers will be crucial to ensure immunization. Targeted communication
through a trusted messenger can help address concerns about safety and efficacy, however deep seated
distrust in government and the institutions that may have treated them poorly in the past may need
more comprehensive, longer-term solutions. Demonstrating concern about issues other than
vaccination may be important to demonstrate trust and true commitment. It is important to remember
that populations are not monolithic, so multiple strategies are likely needed to ensure vaccination
uptake.
KEY INFORMANT INTERVIEWS: EVALUATING FEASIBILITY & SUSTAINABILITY (AIMS 4-6)
Methods
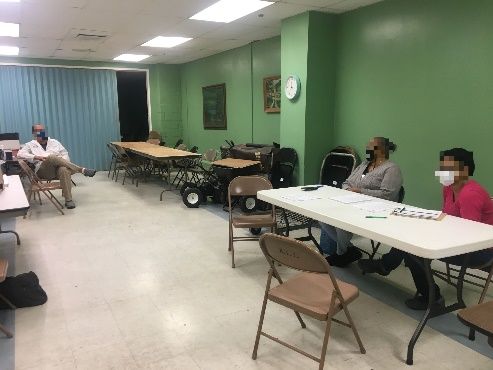
The feasibility of the BCHD flu vaccination initiative was assessed through documentation of the
formative process of the initiative among the senior housing facilities and through key informant
interviews, debriefings during routine BCHD meetings, and observation of flu vaccine service delivery
during senior building events. Participants in the key informant interviews and debriefings included
personnel from BCHD, pharmacists, Coppin State, and Resident Service Coordinators (RSCs) of the senior
housing buildings (see Appendix III – V for interview guides). RSCs, whose primary responsibilities are to
provide supportive services to residents, assist residents with issues that arise (e.g., social security, food
assistance, social isolation, substance abuse, home health services, legal aid), and develop wellness
programs and resources for residents, were the primary points of contact for BCHD in each building and
were responsible for coordinating the flu clinics.
We evaluated intervention feasibility using semi-structured key informant interviews, focus group
discussions, and clinic observation. Through the interviews and debriefings, we also documented the
engagement process for RSCs, participating pharmacies, and the target population (e.g., discussions with
other pastors and a congregation led by Pastor Terris King, town hall events led by BCHD, regular
conference calls with BCHD and participating pharmacies) and identified bottlenecks and areas for
Page 27 of 63BCHD Flu Evaluation Report
February 19, 2021
improvement for implementing such an initiative in the future. These interviews were approximately 30-
60 minutes in duration.
Sampling for the key informant interviews was purposive to ensure representation of key stakeholders
and constituencies participating in the flu vaccination initiative. The sample size for the key informant
interviews was driven by the range of respondents needed to provide a comprehensive understanding.
A total of 23 key informants were either • Baltimore City Health Department staff: 6
interviewed, provided written responses to • Participating Pharmacists: 2
interview/survey questions, or participated in • Resident Service Coordinators: 14
focus group discussions. • Outreach Partner (Coppin State University): 1
The evaluation included all aspects of the flu initiative, starting with initial BCHD engagement with
senior housing buildings to the clinic events and opportunities for continued engagement in the future
(Figure 12). Specific topics addressed in the semi-structured interviews focused on the aspects described
in Figure 12.
Figure 12: Aspects of the Flu Initiative Evaluated
Vaccine RSC and
Flu Initiative Building Vaccine Continued
Clinic Resident
Planning Engagement Clinic Events Engagement
Planning Outreach
Flu Initiative Planning
BCHD Planning
Initial planning for the flu initiative began August with the intent to partner with LabCorp for vaccine
service delivery. A contract with LabCorp's parent company was in place at the start of planning, but an
agreement with LabCorp for the initiative would not be finalized until October. LabCorp required a
minimum of one month notice to plan for specific clinic
events (e.g., estimating participation, hiring nursing staff, Pharmacy partners that could be
flexible in their plans contributed to
sending vaccinations to the nurses), which did not align with
the ability to reach a broader number
the clinic timelines. Due to challenges with LabCorp, Rite Aid of older adults.
agreed to participate in the senior housing clinics. The
pharmacist interviewed said that while most clinics were planned over the summer, Rite Aid has the
ability to participate in clinics on short notice.
Throughout the initiative, BCHD staff spent the majority of their time working on initiative activities.
Senior BCHD staff spent most of their time finalizing contracts with the partnering pharmacies, including
meetings, email communications, and consultations with the legal team. The Care Coordination team
was responsible for flu clinic planning.
Page 28 of 63You can also read