European Construction Sector Observatory - Country profile Poland September 2021
←
→
Page content transcription
If your browser does not render page correctly, please read the page content below

European Construction
   Sector Observatory
           Country profile Poland
                      September 2021

       1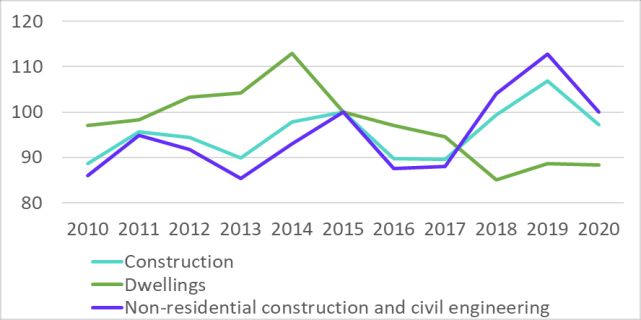
Country Fact Sheet Poland

                                       In a nutshell
 In 2020, Poland’s GDP stood at PLN 2,091.3 billion       With regards to employment, in 2020, there were
 (EUR 460.1 billion), representing a 2.7% decline         1,727,266 persons employed in the broad
 compared to 2019 and a 34.3% growth over the             construction sector in Poland, an increase of 20.9%
 2010-2020 period.                                        since 2010 (1,428,900 people). All the sub-sectors
                                                          registered growth in terms of persons employed in
The number of enterprises in the broad
                                                          the broad sector between 2010 and 2020, with the
construction sector increased by 51.4%, from
                                                          largest increase being in the real estate activities
341,953 in 2010 to 517,818 in 2020. This increase
                                                          (+46.4%) sub sector. This was followed by the
was driven by all the sub-sectors including the real
                                                          architectural and engineering activities (+36.9%),
estate activities (+99.8%), architectural and
                                                          manufacturing (+27.3%) and narrow construction
engineering     activities    (+64.7%),      narrow
                                                          (+12.4%) sub-sectors, during the same period.
construction (+43.0%) and manufacturing (+35.0%)
sub-sectors over the 2010-2020 period.                    The Polish government introduced several
                                                          initiatives to promote the residential housing
 Number of enterprises in
                                                          market. In May 2021, the government announced
 the broad construction
 sector between 2010 and             51.4%                that they are currently developing tailored
                                                          mechanisms or instruments to meet the housing
 2020
                                                          requirements of the Poles. These instruments
Similarly, the volume index of production in the          include housing vouchers and the government
broad construction sector increased by 16.4%              guarantee scheme for mortgage repayments for
between 2015 and 2020, mainly driven by the               purchasing or renting a flat – both for married
construction of civil engineering (+28.1%) and            couples and singles.
construction of buildings (+8.8%).                         The Polish government is also developing a
 Volume index of                                           programme designed for persons with credit
 production in the broad                                   standing who do not have the savings to cover the
 construction sector                  16.4%                capital required by banks.
 between 2015 and 2020                                    The initial projections state that the guarantee will
The total turnover of the broad construction sector       be awarded up to the amount of 40% of the total
reached EUR 144.4 billion in 2020, registering an         value of the flat in the case of a purchase without
increase of 58.3% compared to 2010 levels                 own contribution, both on the primary and
(EUR 96.7 billion). With regards to sub-sectors, the      secondary market.
real estate activities exhibited the largest growth in    Furthermore, in September 2020, the EIB provided
terms of turnover, being 91.1%, followed by the           EUR 20 million for financing the construction and
manufacturing (+85.7%), architectural and                 renovation of 250 social and affordable housing
engineering activities (+59.1%) and the narrow            units in Szczecin, Poland. The project forms part of
construction (+42.8%) sub-sectors over the                the larger urban regeneration programme of the
2010-2020 period.

  European Construction Sector Observatory                                                                  2
Country Fact Sheet Poland

historic part of the city and places a main focus on     by August 2026, including over 300 km on the TEN-
ensuring energy-efficiency1.                             T network (of which 200 km on the core network)5.
                                                         Given its significant environmental impact and
With regards to non-residential and infrastructure
                                                         ability to revive the overall economic recovery
construction, the National Road and Motorway
                                                         process, adversely impacted by the COVID-19, the
Construction Programme 2014-2023 (Program
                                                         construction sector could significantly benefit from
Budowy Dróg i Autostrad) envisages building 3,263
                                                         the investments of the country’s RRP.
kilometres of roads. The initial budget of the
Programme was PLN 107.1 billion, but it was              Currently, the Polish construction sector faces a few
increased to PLN 142.2 billion at the beginning of 3Q    issues. First, the country is also facing a shortage of
20192. Moreover, the Polish government, in June          skilled labour workforce. This issue is further
2021, announced plans to invest PLN 200 billion          strengthened by the significant gap between
(EUR 44.0 billion) in rail and road infrastructure       demand of training from businesses and training
under the country’s Polish New Deal plan to              supply in Poland. In this regard, the government
stimulate recovery following the COVID-19                introduced several measures to tackle this issue by
pandemic.                                                changing the provision of education and introducing
                                                         new forms of teaching and learning6. Second, the
 Under its 2021-2026 Recovery and Resilience
                                                         development of the Polish construction sector is
 Plan (RRP), Poland has been allotted about EUR
                                                         also impeded by the rise of cases of late payment.
 36.0 billion in total, comprising EUR 23.9 billion
                                                         As per the Atradius Payment Practices Barometer
 in grants and EUR 12.1 billion in loans. Out of
                                                         2020 report, the COVID-19 pandemic-induced
 this, Poland has allocated around EUR 7.0 billion
                                                         economic crisis led to an average 76% increase in
 towards building related activities3.
                                                         late payments in the country. In addition, squeezing
In particular, more than half of the building funding    liquidity is the main reason for Polish businesses to
(around EUR 3.9 billion) has been allocated for          withhold payment to their suppliers7.
building renovation related activities4. Also, Poland
                                                          Overall, the Polish construction sector has a
has allocated a substantial support towards
                                                          positive outlook in the medium and long term.
improving the country’s infrastructure, with a
                                                          The sector is primarily expected to be driven by
planned investment of around EUR 2.4 billion. This
                                                          public road and railway infrastructure
consists of the modernisation of railway lines
                                                          investment projects undertaken by the largest
including carrying out works under individual
                                                          public investors, further supported by
projects for around 478 kilometres of railway lines
                                                          EU-backed funding.

 European Construction Sector Observatory                                                                      3
Country Fact Sheet Poland
Table of Contents
In a nutshell ............................................................................................................................................. 2
1 Key figures ............................................................................................................................................ 5
Construction market.........................................................................................................................................5
Productivity ......................................................................................................................................................6
Turnover and profitability ................................................................................................................................6
Employment .....................................................................................................................................................7
2 Macroeconomic indicators .................................................................................................................... 9
Economic development ....................................................................................................................................9
Demography and employment.........................................................................................................................9
Public finance ................................................................................................................................................ 10
Entrepreneurship and access to finance ....................................................................................................... 10
3 Key economic drivers of the construction sector .................................................................................. 12
Business confidence ...................................................................................................................................... 12
Domestic sales ............................................................................................................................................... 12
Export of construction-related products and services .................................................................................. 13
Access to finance in the construction sector................................................................................................. 14
Access to housing .......................................................................................................................................... 14
Infrastructure................................................................................................................................................. 16
4 Key issues and barriers in the construction sector ................................................................................ 17
Company failure ............................................................................................................................................ 17
Trade credit ................................................................................................................................................... 17
Late payment ................................................................................................................................................. 18
Time and cost of obtaining building permits and licenses ............................................................................ 19
Skills shortage ................................................................................................................................................ 20
Sector and sub-sector specific issues ............................................................................................................ 21
5 Innovation in the construction sector................................................................................................... 22
Innovation performance................................................................................................................................ 22
Eco-innovation and digitalisation .................................................................................................................. 23
6 National and regional regulatory framework........................................................................................ 25
Policy schemes............................................................................................................................................... 25
Building regulations ....................................................................................................................................... 27
Insurance and liability related regulations .................................................................................................... 28
7 Current status and national strategies to meet Construction 2020 objectives ........................................ 30
TO 1 – Investment conditions and volumes .................................................................................................. 30
TO 2 – Skills .................................................................................................................................................... 32
TO 3 – Resource efficiency / Sustainable construction ................................................................................. 33
TO 4 – Single Market ..................................................................................................................................... 35
TO 5 – International competitiveness ........................................................................................................... 36
8 Outlook............................................................................................................................................... 38
European Construction Sector Observatory 4Country Fact Sheet Poland
1
Key figures
Construction market Figure 1: Number of enterprises in the Polish broad
construction sector between 2010 and 2020
The number of enterprises in the broad
construction sector in Poland totalled 517,818 in
20208 (Figure 1), with the narrow construction
sub-sector accounting for 64.4% of the total firms.
Overall, the number of enterprises in the broad
construction sector increased by 51.4% during the
2010-2020 period, led by 99.8% and 64.7%
increases in the real estate activities and
architectural and engineering activities sub-sectors,
respectively. Likewise, the number of enterprises in Source: Eurostat, 2021.
narrow construction and manufacturing Figure 2: Volume index of production in the Polish
sub-sectors grew by 43.0% and 35.0% respectively, construction sector between 2010 and 2020
during the same reference period. (2015=100)
Number of enterprises
in the broad
construction sector 51.4%
between 2010 and 2020
Partly driven by private investment, the volume
index of production in the broad construction
sector recorded a growth of 16.4% over the
2015-2020 period, after recording a drop of 14.1%
in 2016 over 2015 and 4.3% in 2020 over 2019, Source: Eurostat, 2021.
(Figure 2). The volume index of production in the
construction of civil engineering registered the The total added value of the broad construction
highest growth of 28.1% over the 2015-2020 period, sector10 increased by 64.1% between 2010 and
driven by the inflow of EU funds9. Last, the volume 2020, amounting to EUR 41.6 billion in 202011. The
index of production of construction of buildings narrow construction sub-sector contributed 44.2%
grew by 8.8% during the 2015-2020 period, notably of the total added value of the broad construction
supported by growing investment in the sector in 2020, followed by the real estate activities
non-residential segment. (30.5%, i.e. EUR 12.7 billion), manufacturing (18.9%,
i.e. EUR 7.9 billion), and architectural and
Volume index of production engineering activities (6.4%, i.e. EUR 2.7 billion)
in the construction of civil sub-sectors.
engineering between 2015 28.1% In 2020, the share of gross value added of the
and 2020
narrow construction sub-sector in the GDP reached
6.5%, below its 2010 level (7.4%) but above the
EU-27 average of 5.1%. Similarly, for the real estate
activities sub-sector, it stood at 5.3% of GDP in 2020
(against 4.7% in 2010), below the EU-27 average of
10.3% (Poland consists of 17 administrative
European Construction Sector Observatory 5Country Fact Sheet Poland
subdivisions (Voivodeships). The gross value added slight decline in absolute terms, from EUR 18,400 in
is not equally split over these subdivisions. 2010 to EUR 17,430 in 2020, marking a 5.3%
Warszawski stoleczny, Slaskie (Katowice) and decrease during the same reference period.
Malopolskie (Krakow) account for 38.1% of the However, it is worth noting that this sub-sector has
gross value added of the narrow construction sub- experienced slight increase in apparent labour
sector, and 34.3% of the real estate activities sub- productivity since 2017.
sector.
Labour productivity in
Figure 3). the narrow construction
Poland consists of 17 administrative subdivisions sub-sector between 21.8%
(Voivodeships). The gross value added is not equally 2010 and 2020
split over these subdivisions. Warszawski stoleczny, The construction sector will need to address the
Slaskie (Katowice) and Malopolskie (Krakow) issue of workforce shortage to shift the current
account for 38.1% of the gross value added of the trend. More importantly, the limited development
narrow construction sub-sector, and 34.3% of the in terms of digitalisation, new technology,
real estate activities sub-sector. automation especially in the MSME segment
Figure 3: Gross value added as a share of GDP in the represent additional barriers preventing the
Polish broad construction sector in 202012 (%) productivity (and competitiveness) of the sector to
grow substantially.
Figure 4: Labour productivity in the broad
construction sector in Poland between 2010 and
2020 (EUR k)
Source: Eurostat, 2021.
Productivity
Apparent labour productivity13 in the broad
construction sector reached EUR 23,388 in Source: Eurostat, 2021.
201814, marking an increase of 31.7% during the
2010-2018 period. However, this is well below Turnover and profitability
the EU-27 average of EUR 51,960.
The turnover of the broad construction sector
In particular, labour productivity within the real amounted to EUR 136.2 billion in 2018,
estate activities, manufacturing, and narrow 40.8% above the 2010 level (EUR 96.7 billion). It
construction sub-sectors displayed upward trends further increased to EUR 144.4 billion in 202015,
between 2010 and 2020. The largest increase in marking an acceleration of 49.3% during the period
labour productivity in absolute terms was 2010-2020. This growth was mainly driven by the
experienced in the real estate activities sub-sector, growth registered in the turnover by the real estate
growing from EUR 30,900 in 2010 to EUR 52,156 in activities (+80.2%), manufacturing (+76.3%),
2020, marking an increase of 68.8% during the architectural and engineering activities (+46.7%)
period. It was followed by the manufacturing sub- and narrow construction (+34.7%) sub-sectors
sector which grew by 31.2% during the same period, during the same reference period. The narrow
from EUR 18,975 in 2010 to EUR 24,891 in 2020. construction sub-sector registered the largest share
The narrow construction sub-sector experienced an of turnover within the sector, accounting for 56.3%.
increase of 21.8%, from EUR 14,900 in 2010 to This is followed by the manufacturing (19.9%), real
EUR 18,142 in 2020. Conversely, the architectural estate activities (18.5%), and architectural and
and engineering activities sub-sector experienced a engineering activities (5.2%) sub-sectors.
European Construction Sector Observatory 6Country Fact Sheet Poland
Turnover in the broad Figure 5: Construction cost index between 2010 and
construction sector
between 2010 and 2020
49.3% 2020 (2015=100)
The gross operating surplus of the broad
construction sector recorded an increase of 59.1%
between 2010 and 201816, reaching EUR 22.6
billion. The largest increases in gross operating
surplus were registered for the real estate activities
sub-sector (+116.4%), followed by the
manufacturing (50.4%) and narrow construction
(47.1%) sub-sectors, over the same period. In Source: Eurostat, 2021.
contrast, the gross operating surplus for the
architectural and engineering activities sub-sector Employment
declined by 28.4% for the period 2010-2018. In 202021, there were 1,727,266 persons employed
Gross operating in the broad construction sector in Poland, an
surplus in real increase of 20.9% since 2010 (1,428,900 people).
estate activities
sub-sector between
116.4% The narrow construction sub-sector employs 58.7%
(i.e. 1,014,299 people) of the total workforce of the
2010 and 2018 broad sector, followed by the manufacturing
(18.3% of the total workforce – 316,831
The gross operating rate of the broad construction
persons), real estate activities (14.1% of the total
sector17, which gives an indication of the sector’s
workforce – 243,494 persons), and the architectural
profitability, increased from 14.7% in 2010 to 16.6%
and engineering activities (8.8% of the total
in 201818, being slightly below the EU-27 average of
workforce – 152,640 persons) sub-sectors
16.7%. In terms of sub-sectors, the real estate
(Figure 6).
activities remained the most profitable sub-sector,
with the gross operating rate of 38.5% in 2018, as Figure 6: Percentage of people employed per
compared to 24.8% in 2010. The gross operating construction sub-sectors in Poland in 2020
rate for the architectural and engineering activities
and manufacturing sub-sectors decreased to 14.0%
(against 24.2% in 2010) and 13.6% (against 15.3% in
2010), respectively. Nevertheless, the narrow
construction sub-sector experienced a slight
increment in 2018, reaching 12.3%, as compared to
11.2% in 2010.
The construction costs index19 has increased by
8.1% between 2015 and 2019, after declining Source: Eurostat, 2021.
between 2012 and 2016.
All the sub-sectors registered growth in terms of
During 2019, the increase in construction persons employed in the broad sector between
material prices and expenses for wages and 2010 and 2020, with the largest increase being in
subcontractors adversely impacted the the real estate activities (+46.4%) sub-sector. This
profitability of construction businesses as they was followed by the architectural and engineering
had already signed project contracts with fixed activities (+36.9%), manufacturing (+27.3%) and
prices beforehand. While the share of such narrow construction (+12.4%) sub-sectors.
unprofitable contracts decreased in 2019, price
pressure remained high due to still rising labour In addition, SMEs in the broad construction sector
costs (lack of qualified staff)20. employed a large portion of workers with an 86.9%
share in 201822.
European Construction Sector Observatory 7Country Fact Sheet Poland
Regarding employment by the specific professions, closure, a total of 235,188 Ukrainian citizens left
the number of ‘technicians and associate Poland, while 86,714 entered. The net movement
professionals’ in the manufacturing and narrow across Poland’s border with Ukraine amounted to a
construction sub-sectors grew by 75.6% and 64.3% decline of 150,000 persons including workers24. The
respectively, between 2010 and 2020. Similarly, the COVID-19 crisis thus had a major impact on the
number of ‘professionals’ increased in all the three issue of labour shortage in Poland.
sub-sectors, including 70.8% in the manufacturing,
The number of self-employed workers in the
40.8% and 9.6% in the narrow construction and real
narrow construction sub-sector increased from
estate activities sub-sectors respectively during the
278,600 in 2010 to 343,300 in 2020, registering a
same period. Conversely, employment by the
growth of 23.2% during the period. In the real
‘elementary occupations’ registered declines of
estate sub-sector, self-employment reached 30,800
71.0%, 28.3% and 27.7% in the real estate activities,
persons, an increase of 48.8% in 2020 as compared
narrow construction and manufacturing
to 2010. Self-employed workers in the narrow
sub-sectors respectively during the 2010-2020
construction sub-sector accounted for 11.9% of all
period.
the self-employed in the general economy in 2020,
Number of professionals compared to 9.8% in 2010 and to 11.7% of the
in the narrow EU-27 average in 2020. At the same time, the real
construction sub-sector 40.0% estate sub-sector represented 1.1% of all
between 2010 and 2020 self-employed in the general economy, compared
to 1.6% of EU-27 average in 2020.
In 201823, the regions of Malopolskie (Krakow),
Slaskie (Katowice) and Wielkopolskie accounted for Self-employed workers in
30.9% of the total employment in the narrow the narrow construction
construction sub-sector, and 27.1% in the real sub-sector 2010 and 23.2%
estate activities sub-sector. Other regions, such as 2020
Dolnoslaskie, Pomorskie, and Lódzkie accounted for
In parallel, full-time employment in the narrow
7.9%, 7.8%, and 5.6%, respectively, of the total
construction sub-sector decreased by 11.5%
employment in the narrow construction sub-sector
between 2010 and 2020. In contrast, an increase of
in 2018. Similarly, these regions accounted for 7.6%,
18.7% was recorded in the real estate activities
7.1% and 7.2%, respectively, of the employment in
sub-sector during the same period.
the real estate activities sub-sector.
Full-time employment in
In March 2020, many workers in the construction
the narrow construction
sector migrated from Poland, mainly due to the
announcement made by Polish government about
sub-sector between 2010 11.5%
and 2020
borders’ closure to the COVID-19 pandemic.
According to border service data reported by
Business Insider, in the two months after the border
European Construction Sector Observatory 8Country Fact Sheet Poland
2
Macroeconomic indicators
Economic development Demography and employment
In 2020, Poland’s GDP amounted to PLN 2,091.3 The overall unemployment rate
billion (EUR 460.1 billion), representing a 2.7% in Poland stood at 2.7% in 2020,
decline compared to 2019. The decline was well below the EU-27 average of
mainly due to the COVID-19 pandemic crisis, 6.3% and the 2010 level of 8.1%.
heightened uncertainty, and the decrease in
private consumption and investment25.
Similarly, youth unemployment in Poland has
In 2020, the country’s potential GDP stood at decreased from 23.7% in 2010 to 10.8% in 2020 and
PLN 2,134.2 billion (EUR 469.5 billion), translating below the EU-27 average of 16.8%.
into a negative output gap of 2.0%. This exhibits
that the Polish economy is underutilising its
Unemployment rate in 2020
resources, as the actual output is less than the full
capacity output.
Moreover, the inflation rate, which stood at 1.2% in
2018, increased to 2.1% and 3.7% in 2019 and 2020.
The higher inflation is due to consequence of 2.7% 6.3%
consumer-driven growth, with a steadily declining
share of private investment in GDP26.
As per the National Bank of Poland’s (Narodowy
Bank Polski - NBP) projections (March 2021), the Poland EU-27
inflation is expected to decline to 2.5% in early
202127. Youth unemployment rate in 2020
The Polish currency, the Złoty, experienced a
decline caused by the spread of COVID-19. In
January 2020, the Polish stock market declined
leading to the considerable weakening of the Złoty
10.8% 16.8%
against foreign currencies28.
Poland EU-27
European Construction Sector Observatory 9Country Fact Sheet Poland
In terms of the total population, Poland’s In April 2020, the Polish government announced its
population amounted to 37.9 million people in intention to increase its public debt to bolster its
2020, a decrease of 14,674 people compared to coronavirus-hit economy34.
2019. It is expected to decline by 2.4% in 2030 and
decrease by 10.1% in 2050, reaching to 34.1 million. 90.7%
In parallel, in 2019, the working age population
(aged 15-64) accounted for 66.4% of the total 57.5%
population of Poland, higher than the EU-27
average of 64.3% in 2020. The share of working age
population is expected to decline to 63.8% by 2030
and further decline to 57.7% by 2050. In parallel,
the share of elderly population (65 years or over) of
EU-27 Poland
the total population stood at 18.2% in 2020, below
the EU-27 average of 20.6%29, and is forecasted to Government gross debt (% of GDP) in
reach 30.1% by 2050. 2020
It is expected that the working age population
will continue declining in the next decade.
Therefore, the successful integration of foreign Entrepreneurship and access to
workers (including their skills and competences) finance
who already play an important role, will be
needed for the future growth potential30. According to the World Bank Doing
Business 2020 report, with 82.9 score,
Poland is hence aging at a very high pace31, risking
Poland ranked 128th out of 190
‘getting old before getting rich’. In other words, the
countries in ease of starting a
aging population will likely be a key limitation for
business in 201935.
economic growth in Poland32. Nevertheless, there
will be likely opportunities for the construction As per the report, starting a business in Poland
sector as the demand for elderly infrastructures requires 5 procedures, taking 37 days and costing
(hospitals, care home, access infrastructure), will 9.3% of income per capita36.
keep on gradually rising in the medium and Furthermore, Poland scores one of the lowest in
long-term future prospects. terms of entrepreneurship intentions, as only 4.7%
of Polish population plan to start a business in the
Public finance next three years, according to Global
In 2020, general government expenditure Entrepreneurship Monitor report 201937. In
accounted for 48.7% of GDP, more than the addition, 59.6% of population (between 18-64 age)
previous year (41.8%), being well below the EU-27 consider starting a business as a desirable career
average of 53.4%. The government deficit choice38. Despite Poland’s weak performance in
accounted for 7.0% of the GDP, above the 3.0% entrepreneurship, some scale-ups have succeeded.
threshold of the EU’s Stability and Growth Pact In 2018, the share of high-growth enterprises in
(SGP) and EU-27 average of 6.9%. The same year, Poland was 12.5%, 9th best in the EU that year39.
general government gross debt accounted for
Moreover, due to the onset of COVID-19 Polish
57.5% of the country’s GDP, representing an
SMEs face the liquidity issues. In June 2020, 44.0%
increase compared to 2019 (45.6%), and remaining
of Polish entrepreneurs noted decreases in
below the EU-27 average of 90.7%. The increase in liquidity.
general government debt-to-GDP ratio was mainly
driven by the significant borrowings to fund The Polish government introduced measures to
COVID-19 support measures. The government gross address the liquidity issues faced by SMEs under
debt is estimated to increase further, reaching the ‘anti-crisis shield’ package. In 2020, this
around 62.3% of GDP by 2021-202233. support was estimated at 7.0% of GDP40.
European Construction Sector Observatory 10Country Fact Sheet Poland
In December 2020, the European Commission Furthermore, around 6.0% of Polish firms did not
approved the Polish programme titled "Financial apply for loans in the past six months of 2020 due
Buckler for SMEs 2.0” (Tarcza finansowa dla MŚP to fear of rejections, as compared to 4.0% of EU-27
2.0). This programme is aimed at the companies average43.
that had to reduce or suspend their activities due to
At the same time, it is worth noting that lending to
the pandemic. The scheme includes aid in the form
non-financial corporations has picked up in recent
of a grant for micro enterprises and in the form of a
years. Loans to non-financial corporations
subsidy to uncovered fixed costs for small and
increased over 2010-2020, growing from PLN 219.5
medium-sized enterprises. The budget of the
billion (EUR 48.3 billion) to PLN 367.0 billion
programme is PLN 13.0 billion (approximately
(EUR 80.7 billion) (+67.2%).
EUR 2.9 billion), of which PLN 6.5 billion (EUR 1.4
billion) will allocated to micro-enterprises and Loans to non-financial
PLN 6.5 billion (EUR 1.4 billion) to small and
medium-sized enterprises41.
corporations between
2010 and 2020
67.2%
According to the Survey on the access to finance of Poland has taken several measures to improve the
enterprises (SAFE Report) 202042, access to finance access to finance for SMEs. In 2019, it formulated a
is the most important concern for 7.9% of Polish new strategy (Capital Markets Development
SMEs, slightly below the EU-27 average of 10.0%. Strategy), which aims to develop the Polish capital
The survey further indicates that there was 20.2% market. The objective of this strategy is to increase
of rejections reported from SMEs who applied for a the attractiveness of the Polish capital market
loan (compared to a 6.3% EU-27 average). In thereby improving access to finance for companies
addition to this, 4.1% of companies who (especially SMEs). This strategy aims to overcome
successfully applied for bank loans received less barriers in access to finance and to further develop
than they applied for (EU-27: 6.0%). a competitive infrastructure that allows for a more
agile market development and innovation44.
Share of SMEs experiencing loan’s application The Capital Markets Development Strategy
rejection in 2020 (Strategia Rozwoju Rynku Kapitałowego) was
adopted following a process of public
consultation and covers the period 2019-202345.
20% 6% Additionally, Poland introduced a new form of
public limited liability company with a minimum
capital of PLN 1.0 (circa EUR 0.2) in order to
incentivise the creation of new businesses46.
Poland EU-27
European Construction Sector Observatory 11Country Fact Sheet Poland
3
Key economic drivers of the
construction sector
Business confidence registered growth of 38.9%, rising from EUR 3,600
to EUR 5,000 during the same period. In contrast, it
Over the 2010-2019 period, business confidence decreased by 10.0% for the architectural and
in Poland improved significantly in particular for engineering activities sub-sector, declining from
the consumers and construction confidence EUR 2,000 in 2010 to EUR 1,800 in 201850.
indicators. However, in 2020 there was a
considerable decline in the business confidence 19,530
indicators over the previous year, mainly due to
the adverse impact of COVID-19 pandemic.
In 2020, the consumer confidence reached to -12.3, 17,886
below the 2010 level of -8.3 and 4.2 recorded in the
previous year. However, this is above the EU-27
average of -14.0. Similarly, the industry confidence
indicator deteriorated in 2020, standing at -22.3, in 2010 2018
comparison to -12.9 in 2010 and -8.8 in 2019. This is
well below the EU-27 average of -14.4. In contrast, Investment per worker in Poland in EUR
the construction confidence indicator improved in
2020, ending at -26.0, against the 2010 level (-30.4)
Domestic sales
and the EU-27 average of -9.3. Nonetheless, this is The ranking of the top five most domestically sold
well below the 2019 level of -10.0. construction products in Poland has experienced
In April 2020, Consumer Confidence Index (CCI) some fluctuations in 201951 as compared to 2010.
stood at -36.4 due to adverse effect The value of the top five domestic sales has grown
of COVID-19. Nonetheless, it slightly improved between 2010 and 2019, with “Tiles, flagstones,
to -30.1 in May 2020 and -19.4 in June 2020. bricks and other similar articles” and “Ready-mixed
However, it again declined to -29.2 in November concrete” increase by 57.9% and 32.1%,
202047. respectively. The highest increases in sales were
realised with the product groups “Pallets, box
In 2020, the investment ratio stood at 17.3% as pallets and other load boards of wood” (+427.6%),
compared to 18.8% in 2010, below than the followed by “Bridges and bridge-sections of iron or
previous year (18.6%). In contrast, investment per steel” (+74.7%) and “Towers and lattice masts of
worker fell by 8.4% from EUR 19,530 in 2010 to iron or steel” (+67.9%) over the same reference
EUR 17,886 in 201848. period.
In terms of investment per worker, the real estate The top 5 most domestically sold construction
activities sub-sector exhibited the highest growth products are presented in Table 1, including a
during 2010-201849period, increasing by 65.0% comparison with the top sellers in the EU-27. These
from EUR 12,300 to EUR 20,300. It was followed by top five products represented 50.6% of total
the narrow construction sub-sector which domestic construction product sales in 2019.
European Construction Sector Observatory 12Country Fact Sheet Poland
Table 1: Five most domestically sold construction exported products has changed since 2010.
products in Poland and in the EU-27 201952 "Assembled parquet panels”, “Builders' joinery and
Poland EU-27 carpentry” and “Doors, windows etc.” were
replaced by “Other structures and parts”,
Share in
construction
“Fibreboard of wood” and “Wooden frames for
Value paintings”. The top five most exported products
Product product Product
(EUR m)
domestic represent 52.4% of total export value.
sales (%)
Table 2: Five most exported construction products
Other
structures in Poland and EU-27 in 201953
and parts of
Ready-mixed Poland EU-27
structures,
1 concrete
1,296.0 11.8 plates, rods, Share in
(group
angles, construction
236310) Value
shapes Product product Product
(group (EUR m)
export sales
251123) (%)
Portland
Other Other
cement,
structures structures
aluminous
Doors, and parts of and parts of
cement, slag
windows, 1 structures, 894.7 14.3 structures,
cement and
2 1,262.0 11.5 etc. plates, rods, plates, rods,
similar
etc. (group etc. (group
hydraulic (group
251123) 251123)
cements 251210)
(group Doors,
235112) Windows windows
2 and other and their
788.6 12.6
Tiles, (group frames, etc.
flagstones, 162311) (group
bricks and 251210)
Ready-mixed
similar
3 concrete Fibreboard
articles, of 1,155.7 10.5
(group of wood or
cement, Ready-mixed
236310) other
concrete etc. concrete
3 ligneous 562.8 9.0
(group (group
236111) materials
236310)
(group
Other 162115)
structures
Wooden Prefabricate
and parts of
Prefabricate frames for d buildings
structures,
d buildings 4 paintings 541.5 8.7 of metal
plates, rods,
4 960.5 8.7 of metal etc. (group (group
angles,
162914) 251110)
shapes (group
(group 251110) Prefabricate
251123) d structural
Pallets, box components
5 pallets, etc. for building
480.5 7.7
Prefabricate (group or civil
Particle 162411) engineering
d structural
5 board (group
900.3 8.2 components
(group 236112)
etc. (group
162112)
236112)
Source: PRODCOM, 2021.
Source: PRODCOM, 2021.
In terms of cross-border provision of
Export of construction-related construction services54, Poland exported for a
products and services total amount of EUR 1.5 billion worldwide in
202055, an increase of 55.0% as compared to the
Table 2 presents the top five most exported 2010 value (EUR 998 million). Almost 84.0%
construction products both in Poland and in the EU (EUR 1.3 billion) of these exports were destined
in 2019. Poland is a major exporter of wooden to the EU-27 countries.
products and windows. The ranking of the most
European Construction Sector Observatory 13Country Fact Sheet Poland
At the same time, Poland imported EUR 419.8 Number of households
million of construction services from the world, between 2010 and 2020 11.0%
where almost 64.0% (EUR 270 million) came from
the EU-27, stressing the importance of the EU single Parallel to this trend, the mean equivalised net
market. Therefore, Poland achieved a trade surplus income increased by 56.8% between 2010 and
of EUR 1.1 billion in 2020. 201961, from EUR 5,116 to EUR 8,022, reflecting
rising wages, which translates into higher
Access to finance in the purchasing power. These factors, together with the
construction sector lowest mortgage interest rates since 2010 (Figure 8)
are the driving force behind the growth of the
The Polish companies finance themselves mostly housing market, as shown by the slow recovery of
through banks, trade credit and informal sources house prices since 2013 (Figure 7).
(e.g., family members, friends, moneylenders). As
Figure 7: House price index in Poland between 2010
per the EIB Investment Survey for 2020 report, bank
and 2020 (2015=100)
loans account for the highest share of external
finance (30.0%) for the Polish firms, which is almost
half the share of the EU average (59.0%). This is
followed by other bank finance (25.0%) and grants
(20.0%) remains well above the EU average (8.0%
and 6.0% respectively). Also, 61.0% respondents
believe that “availability of finance” is a long-term
barrier for the Polish construction sector56.
The EIB Investment Survey
for 2020 shows that 14.0% Source: Eurostat, 2021
Polish firms are
The house price index for total dwellings in Poland
dissatisfied with collateral
increased by 35.3% during the 2015-2020 period.
requirements57.
The increase in home prices was mainly driven by
As per the report, 14.0% construction firms are the housing demand and growing construction
dissatisfied with the collateral requirements asked costs, which was due to a strong construction
of them. Also, 20.0% firms in the Polish construction demand in the entire economy.
sector are pessimistic about the availability of
internal finance over the next 12 months. This House price index
pessimism stands at 31% in terms of availability of between 2015 and 2020 35.3%
external finance in the sector. In addition, 65.0%
firms in the construction sector consider According to the Polish Central Bank (Narodowy
‘availability of finance’ as a ‘long term barrier to Bank Polski, NBP), the average price of existing flats
investment’58. in Poland’s seven big cities (Warsaw, Gdańsk,
Furthermore, 26.0% construction firms are satisfied Gdynia, Kraków, Łódź, Poznań, and Wrocław)
depending mainly on internal sources to finance increased by 5.6% in 2020 to an average of
investment, particularly compared to infrastructure PLN 8,325 (EUR 1,819) per square metre (sq. m.)62.
firms (11.0%)59. According to NBP, in 2020, Warsaw had Poland’s
most expensive housing, with an average
Access to housing transaction price for existing homes of
There were 14.7 million households in Poland in PLN 10,072 (EUR 2,198) per sq. m. while Łódź
2020, which represents an 11.0% increase had the cheapest houses among the seven big
compared to the 2010 level. In parallel, in 201960, cities, with an average price of PLN 5,522
the country had a high urbanisation rate, with (EUR 1,205) per sq. m63.
35.0% of the population living in densely populated
areas.
European Construction Sector Observatory 14Country Fact Sheet Poland
In fact, interest rates on mortgages (for over 5 In parallel with the residential construction, the
years of original maturity) fell from 6.0% in 2010 to number of building permits index for dwellings
2.9% in 2020. increased by 49.1% between 2015 and 2020. In case
of one dwelling buildings, and two and more
In March 2020, to strengthen the economy
dwelling buildings, it recorded increases of 51.0%
amidst the COVID-19 pandemic, the Central
and 47.8%, respectively, over the same period.
Bank of Poland cut its key rate by 50 basis points
to a record low of 0.1%. The rediscount rate was Building permits index
cut to 1.05% from 1.75%64. for dwellings between
2015 and 2020
49.1%
Figure 8: Mortgage rates for loans for over 5 years
original maturity (%) between 2010 and 2020
Nevertheless, both demand and supply have fallen
last year due to the COVID-19 pandemic. In 2020,
the total number of new flats sold in Poland’s six
major cities declined by 19% to 53,000 units as
compared to the previous year, in contrast to a
slight growth of 0.8% in 2019. New supply also fell
by 24% from 201970.
Furthermore, actuals rentals for housing in Poland
showed a modest growth of 19.7% during
Source: ECB MFI Interest Rate Statistics, 2021. 2015-2020 period. The movement of people from
other cities to the capital, particularly students or
Fostered by low interest rates and rising incomes,
young people looking for work, also pushes the
housing loans to households have been growing
demand for renting. The big downside is that round
steadily over the past years. The total outstanding
trip transaction costs are high in Poland71.
residential loans increased by 60.5%, from
EUR 67.5 billion in 2010 to EUR 108.3 billion in In addition, housing quality remains below the
2019. EU-27 average. The overcrowding rate72 in Poland
stood at 37.6% in 2019, well above the EU-27
Total outstanding average of 17.1%73. These relatively high numbers
residential loans in Poland
between 2010 and 2019
60.5% are partly explained by the high proportion (58.9%
in 2019) of 18-34 years old Polish, who live with
their parents, and the fact that flats have been
In January 2021, total outstanding housing loans traditionally small74.
in Poland grew by 6.1% to PLN 494.4 billion
Similarly, the severe housing deprivation rate75
(EUR 107.8 billion) from the same period last
stood at 7.9% in 2019, below the EU-27 average of
year, according to the NBP65.
4.0%76. On the contrary, the housing cost
In the context of ownership, the building stock overburden rate77 was at 6.0% in 2019, lower than
distribution of residential dwellings between the EU-27 average of 9.6%78.
owners and tenants has steadily increased from
2010 to 201966, from 81.3% of owners in 2010 up to Overcrowding rate in 2019
84.2% in 201967 (among which 12.2% have a
mortgage or a loan). Similarly, the population
earning above 60% of median equivalised income
experienced a slight improvement in terms of 37.6% 17.1%
dwelling owned – 85.1% in 201968, from 82.7% in
2010. Likewise, the population earning below 60%
of median equivalised income shows a sharp
growth in ownership. It increased from 74.9% in Poland EU-27
2010 to 79.3% in 201969.
European Construction Sector Observatory 15Country Fact Sheet Poland
Infrastructure Poland is the biggest beneficiary of the EU funding.
The commitment of EU Member States to shift
According to the 2019 Global 30.0% of road freight to more environment-friendly
Competitiveness Report79, modes of transport may considerably support the
Poland ranked 25th out of 141 development of railway infrastructure up to 203084.
in terms of its overall The National Road and Motorway Construction
infrastructure quality80. Programme 2014-2023 (Program Budowy Dróg i
As per the report, Poland ranked 13th for its railroad Autostrad) is an important driver for infrastructure
density, 23rd for liner shipping connectivity, 32nd for investments in Poland and it envisages building
road connectivity and 38th for airport connectivity81. 3,263 kilometres of roads. The original budget of
the Programme amounted to PLN 107.1 billion
In Poland, there is still a need to unlock the (EUR 23.6 billion, but it was increased to PLN 142.2
potential of the railway sector and increase its share billion (EUR 31.3 billion) at the beginning of the
of transport. The share of railways in passenger third quarter of 201985.
transport is at par the level of the EU average (7.9%
in Poland compared to 8.0% in the EU in 2018), In July 2021, the Polish prime minister
while in freight transport it is 8.0 pp. higher than the announced to invest around PLN 200 billion
EU average and reached 26.8% in 201882. This may (EUR 44.4 billion) in road and rail infrastructure,
be explained by the role of the broad gauge that as part of the Polish New Deal plan86.
runs from the Poland-Ukraine border to the The government also signed a contract for
Western part of the country, close to Katowice, and construction of the Warsaw – Solidarity Transport
which transports freights coming from China to Hub (CPK) – Łódź high-speed line. The funding will
Europe83. be utilised for station renovation including the
reconstruction of the track, new platforms,
upgrades to the traffic control system and improved
interchanges with public transport87.
European Construction Sector Observatory 16Country Fact Sheet Poland
4
Key issues and barriers in the
construction sector
Company failure Kredytowej) estimates that the arrears in payments
in the construction sector stood at PLN 5.2 billion
Company births in the narrow construction (EUR 1.1 billion) in the 2nd quarter of 2020 against
sub-sector increased by 25.4%, from 48,605 in 2010 PLN 4.5 billion (around EUR 1.0 billion) by the end
to 60,975, whereas the company deaths increased of 201994.
by 18.3%, from 38,531 in 2010 to 45,614 in 201888.
To address the bankruptcy issue, a bankruptcy
Similarly, the real estate activities sub-sector framework was introduced in January 2016,
experienced an increase of 58.9% in company birth providing debtors with additional modalities to
(from 4,085 in 2010 to 6,494 in 2018) and 89.9% restructure company and limit their obligations
increment in company deaths (from 2,642 in 2010 towards creditors, allowing an easier cessation and
to 5,019 in 201889). Similarly, company deaths in the creation of firms95.
architectural and engineering activities sub-sector
increased by 69.1% (from 2,908 in 2010 to 4,918 in Trade credit
201890). Also, company birth in the same sub-sector
increased by 18.3% (from 5,551 in 2010 to 6,570 in According to the Survey on the Access to Finance
2018). of Enterprises (SAFE) 2020, trade credit
constitutes a relevant source of financing for
Company births in the 40.3% of Polish SMEs, above the EU-27 average
real estate activities
sub-sector over 58.9% of 27.7% in 202096.
2010-2018 Furthermore, 47.3% of the SMEs applied this
financing approach in the last six months, well
above the EU-27 average of 31.4% in 2020.
Company deaths in
Nonetheless, only 2.4% of SMEs did not apply for it
the real estate
activities sub-sector 89.9% for the fear of rejection. Additionally, among the
respondents who applied and negotiated for trade
over 2010-2018
credit financing, around 75.8% of the applicants
The construction sector has long been indicated as received everything they applied for. This is also
the one with most bankruptcy related risks, above the EU-27 average of 67.3% for the same97.
burdened with payment bottlenecks, problems Moreover, there is no indication of increased needs
with profitability and a drop in sales revenues91. to use trade credit with over 71.7% of respondents
SMEs reporting their credit requirement remaining
In the first half of 2020, the construction sector
unchanged over the last 6 months. This is higher
reported 51 bankruptcies and restructurings,
than the EU-27 average of 65.7%.
which represents a 16% decrease compared to
the first half of 201992. In parallel, 7.2% of respondents consider that trade
credit availability improved in 2020 (compared to
Payment backlogs is one of the main caused for the
the EU-27 average of 13.5%). Around 8.5% of SMEs
bankruptcy of construction companies93. Moreover,
expect that the availability of trade credit will
the Credit Reference Agency (Biuro Informacji
European Construction Sector Observatory 17Country Fact Sheet Poland
improve in the near future, below the EU-27 According to the Poland Corporate Payment
average of 12.3%98. Survey 2021, Polish companies experience
average payment delays of 48 days, almost 9
According to Payment Practices Barometer
days less as compared to the 2019 survey. In
Poland 2020, there was an increase in the use of
2020, the construction and transports
trade credit in B2B transactions in Poland. This
companies reported the longest payment
is mainly due to sales strategy employed by
delays, nearly 79 days and 78 days
businesses in an increasingly competitive
respectively105.
market99.
Moreover, the arrears in construction in 2020
As per the report, Polish businesses seek to
worsened from quarter to quarter for invoices
encourage sales on the domestic market by
unpaid over 60 days due to payment gridlocks, as
increasing the amount of trade credit offered to B2B
per the BIK Credit Information Bureau estimates106.
customers100.
However, there has been a general improvement in
Late payment this area, because of the percentage of enterprises
that do not pay and simply take loans at the
According to the CRIBIS D&B Payment Study 2020, expense of their creditors dropping from 25.0% to
4.5% of respondent companies in Poland reported 11.0%.
late payments (for more than 90 days), an increase
of 1.8 pps over the December 2019 level (2.7%). In Poland has taken several measures to combat the
June 2020, 76.5% of respondent companies made payment delays. In January 2020, the late payments
their payment by due date, a decrease of 2.2 regulation entered into force, which consist of
percentage points over the 78.7% in December legally binding deadlines for payments, which will
2019101. help address arrears and support firms’ financial
liquidity107. The new regulation prohibits “excessive
Late payment is a key issue in the Polish delays” in payments. Excessive delays are
construction sector. With many companies having understood to be a situation where the total sum of
limited financial liquidity, late payment is one of the overdue payments, as well as payments settled with
main causes of bankruptcy. a delay, exceeds PLN 2.0 million (approx.
According to Atradius report EUR 450,000) in total for three (3) consecutive
“Market Monitor Construction months (PLN 5.0 million (approx. EUR 1,150,000) in
Poland 2020”, it takes on 2020/21)108.
average 75 days for the Previously, in 2013, Poland implemented the Late
payments in the Polish Payment Directive (2011/7/EU) via the Law on
construction sector102. Payment Deadlines in Commercial Transactions.
As per the Atradius Payment Practices Barometer Regarding the payment to Subcontractors for roads
2020 report, the COVID-19 pandemic-induced contracts implemented by GDDKiA, PZPB estimates
economic crisis led to an average 76.0% increase in that only 10% of the payments made to
late payments in Poland. Moreover, around 71.0% construction companies are based on the
of the businesses surveyed in Poland follow unpaid legislation. This is due to smaller companies being
bills with reminder notes. Squeezing liquidity is the unwilling to take action against their larger
main reason for Polish businesses to withhold counterparts (effectively using late payment as a
payment to their suppliers103. costless source of credit) for fear of losing contracts.
The Coface’s survey 2021 reveals that 86.4% of
corporates surveyed continue to face payment
delays. Only 2.4% of the companies surveyed
reports receiving payments on time104.
European Construction Sector Observatory 18Country Fact Sheet Poland
Time and cost of obtaining building of single-family residential houses, which
only require a formal notification to the
permits and licenses construction authority.
Poland ranked 39th (out of 190) in “Dealing with Depending on local conditions, additional permits
Construction Permits”, one place higher than a may be required, such as water law permit, permit
year before (40th), according to the 2020 World of the monument protection office, permit for
Bank’s Doing Business Report109. cutting down trees. In the case of public
In 2019, completing the formalities to build a infrastructural developments (highways, railway,
warehouse110 took on average 137 days, below the airports, etc.) simplified procedures are available
OECD average of 152.3, and involved 12 for public developers, where the planning basis,
administrative procedures, an improvement since expropriation and division of properties as well as
the 16 procedures needed in 2015 (Table 3). Poland the building permit are included in a joint decision.
streamlined the process for obtaining a building Table 3: Construction procedures timing and costs
permit, thus reducing the number of procedures in Poland in 2020
and the overall time for obtaining a building permit. Time to Associated
In addition, the cost of completing the formalities to Procedure
complete costs
build a warehouse represents 0.3% of the value of Receive an approval from the
the warehouse, well below the OECD high-income Project Documentation
average of 1.5%111. Coordination Unit (ZUDP) 30 days No charge
about the lack of conflicts
In 2020, construction permits were granted and among utility connections
registrations with a construction project were Obtain current geodesic map 21 days
PLN 2,000 /
EUR 440
issued for 276,100 dwellings, 2.7% more than in
2019, 98.0% of which will be realised in new Request and obtain consent
7 days
PLN 750 /
from licensed sanitary expert EUR 165
residential buildings. The number of new non-
residential buildings for which construction permits Request and obtain consent PLN 1,000 /
3 days
were granted in Poland in 2020 amounted to from licensed fire safety expert EUR 220
30,000, a decrease of 9.1% in comparison with Request and obtain building PLN 588 /
65 days
2019. The number of dwellings for which permit EUR 129.4
construction permits were granted or registrations Conclude agreement with
PLN 250 /
with a construction project were issued was utility provider: water and 5 days
EUR 55
sewage
constantly going up in the analysed five-year period,
resulting in an increase in this variable by over Notify municipal authority
about the beginning of
30.0% between 2016 and 2020112. construction and register the
1 day no charge
building diary
Furthermore, the amendments to the Construction
Law (Prawo Budowlane) in 2015 abolished the Receive inspection from Local
Water Company and obtain
requirement for a building permit to build a water and sewage
1 day no charge
house113, reducing red tape. Moreover, SME owners connections
(except retail objects) no longer need an occupancy Receive inspection from the
permit of retail space, thus facilitating the running National Sanitary Inspectorate 14 days no charge
and obtain approval
of the business.
Receive inspection from the
Construction (particularly infrastructural projects) PLN 50 / EUR
State Fire Service and obtain 14 days
11
requires a number of administrative permits. All approval
projects require: Obtain geodetic post-executive PLN 2,000 /
3 days
inventory EUR 440
• planning basis in the form of a local master
Request and receive PLN 135 /
plan or individual decision, setting the occupancy permit
21 days
EUR 29.7
conditions of development;
Source: Doing Business overview for Poland, Word Bank, 2020.
• building permit, except for certain
categories of objects, such as the majority
European Construction Sector Observatory 19You can also read