Deep learning detects cardiotoxicity in a high-content screen with induced pluripotent stem cell-derived cardiomyocytes
←
→
Page content transcription
If your browser does not render page correctly, please read the page content below
RESEARCH ARTICLE

                                   Deep learning detects cardiotoxicity in a
                                   high-content screen with induced
                                   pluripotent stem cell-derived
                                   cardiomyocytes
                                   Francis Grafton1, Jaclyn Ho1, Sara Ranjbarvaziri2, Farshad Farshidfar1,
                                   Anastasiia Budan1, Stephanie Steltzer1, Mahnaz Maddah3, Kevin E Loewke3,
                                   Kristina Green1, Snahel Patel1, Tim Hoey1, Mohammad Ali Mandegar1*
                                   1
                                    Tenaya Therapeutics, South San Francisco, United States; 2Cardiovascular Institute
                                   and Department of Medicine, Stanford University, Stanford, United States; 3Dana
                                   Solutions, Palo Alto, United States

                                   Abstract Drug-induced cardiotoxicity and hepatotoxicity are major causes of drug attrition. To
                                   decrease late-stage drug attrition, pharmaceutical and biotechnology industries need to establish
                                   biologically relevant models that use phenotypic screening to detect drug-induced toxicity in vitro.
                                   In this study, we sought to rapidly detect patterns of cardiotoxicity using high-content image
                                   analysis with deep learning and induced pluripotent stem cell-derived cardiomyocytes (iPSC-CMs).
                                   We screened a library of 1280 bioactive compounds and identified those with potential cardiotoxic
                                   liabilities in iPSC-CMs using a single-parameter score based on deep learning. Compounds
                                   demonstrating cardiotoxicity in iPSC-CMs included DNA intercalators, ion channel blockers,
                                   epidermal growth factor receptor, cyclin-dependent kinase, and multi-kinase inhibitors. We also
                                   screened a diverse library of molecules with unknown targets and identified chemical frameworks
                                   that show cardiotoxic signal in iPSC-CMs. By using this screening approach during target discovery
                                   and lead optimization, we can de-risk early-stage drug discovery. We show that the broad
                                   applicability of combining deep learning with iPSC technology is an effective way to interrogate
*For correspondence:
                                   cellular phenotypes and identify drugs that may protect against diseased phenotypes and
mandegar@tenayathera.com
                                   deleterious mutations.
Competing interest: See
page 23
Funding: See page 24

Preprinted: 24 March 2021          Introduction
Received: 24 March 2021            Drug development is a lengthy and expensive endeavor, often requiring an estimated 10 years and
Accepted: 27 July 2021             $0.8–2.6 billion. The cost—and risk—grows exponentially as drugs advance toward the clinic
Published: 02 August 2021          (DiMasi et al., 2016). To reduce costs and risk, pharmaceutical companies need effective screening
                                   methods to prevent drug attrition at late stages of the development process.
Reviewing editor: Arduino A
Mangoni, Flinders Medical
                                       Major causes of therapeutic attrition are drug-induced toxicity, including cardiotoxicity and hepa-
Centre, Australia                  totoxicity. Cardiotoxicity alone accounts for approximately one-third of drugs withdrawn due to
                                   safety concerns (Guo et al., 2011; Mathur et al., 2013; Weaver and Valentin, 2019). To decrease
   Copyright Grafton et al. This
                                   the potential for toxicity, and for late-stage drug attrition, pharmaceutical and biotechnology indus-
article is distributed under the
                                   tries seek in vitro systems that can identify drug-induced toxicity with phenotypic screening at early
terms of the Creative Commons
Attribution License, which         stages of development (Moffat et al., 2014). This screening enables interrogation of a large number
permits unrestricted use and       of perturbagens (e.g., small molecules, siRNAs, CRISPR gRNAs) in a target-agnostic assay that meas-
redistribution provided that the   ures phenotypic changes (Eder et al., 2014).
original author and source are         Some of the best in vitro models rely on human primary cells isolated directly from tissues. These
credited.                          models retain the morphological and physiological characteristics of their tissue of origin (Kaur and

Grafton et al. eLife 2021;10:e68714. DOI: https://doi.org/10.7554/eLife.68714                                                      1 of 28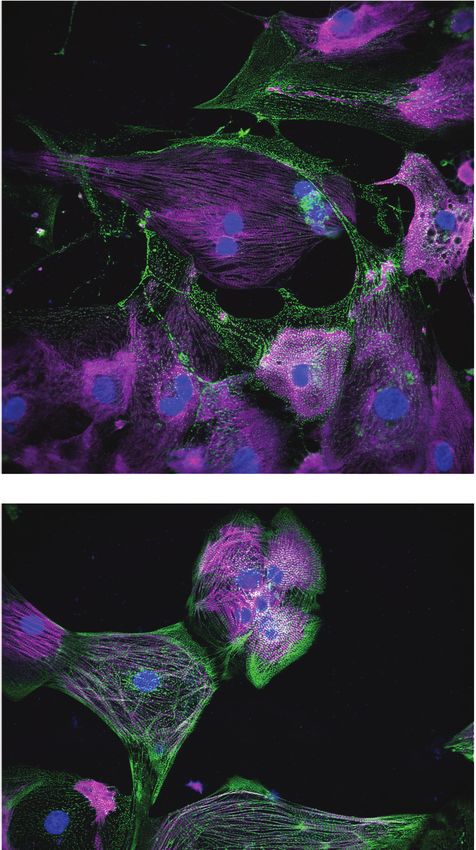
Research article                                                                               Stem Cells and Regenerative Medicine

                                      Dufour, 2012). However, the supply of primary cells is finite. Primary cells also have limited potential
                                      for proliferation, are technically complicated to culture for long periods, and are difficult to geneti-
                                      cally manipulate. As a result, scientists often turn to immortalized cell lines, such as HEK293T cells,
                                      HepG2 human liver cancer cells, and HL-1 cardiac muscle cells. Many of these cell lines have been
                                      transformed (Ahuja et al., 2005; Prager et al., 2019), which may cause karyotypic abnormalities,
                                      and they do not fully recapitulate their in vivo counterparts.
                                          More recently, researchers have turned to cell types derived from human induced pluripotent
                                      stem cells (iPSCs) (Takahashi et al., 2007). Cells derived from iPSCs more closely recapitulate human
                                      biology than immortalized cells (Moffat et al., 2017; Scannell and Bosley, 2016). These derived
                                      cells have been used for disease modeling (Judge et al., 2017; Lan et al., 2013; Pérez-
                                      Bermejo et al., 2020; Ribeiro et al., 2017; Sharma et al., 2017; Sun et al., 2012), proposed for
                                      drug discovery (Carlson et al., 2013; Grskovic et al., 2011; Robinton and Daley, 2012), and used
                                      to assess arrhythmogenic and structural liabilities of drugs (Guo et al., 2011; Maddah et al., 2020).
                                      Additionally, iPSCs can be derived from patients carrying deleterious mutations and genetically
                                      modified using nucleases (Judge et al., 2017; Kime et al., 2016; Mandegar et al., 2016;
                                      Miyaoka et al., 2012). They can also be expanded to sufficient quantities and cultured for extended
                                      periods that facilitate screening at scale (Burridge et al., 2014; Ghazizadeh and Majd, 2020;
                                      Sharma et al., 2017). Hence, iPSC-derived cell types enable high-throughput interrogation and
                                      screening using arrayed libraries of perturbagens.
                                          As of early 2021, few studies have used iPSC-derived cells for phenotypic screening in a high-
                                      throughput manner that is truly scalable and, most importantly, has an assay readout with an appro-
                                      priate window for screening and high signal-to-noise ratio. The screening window, commonly
                                      assessed using the Z-factor, ensures detection of true-positive hits and limits the number of false-
                                      negative and false-positive hits. Additionally, most published studies have been limited to single-
                                      readout phenotypes, such as cell survival (Sharma et al., 2017; Sun et al., 2017), expression of a sin-
                                      gle marker (Ghazizadeh and Majd, 2020), or reporter screens (McLendon et al., 2017). While these
                                      studies revealed great insight into cardiomyocyte biology, they have not described a general and
                                      unbiased screening strategy that can be applied to other cell types and used at scale.
                                          Given the limitation of single-readout assays, researchers have turned to high-content screening
                                      to assess cellular features using traditional image processing (Moen et al., 2019; Salick et al.,
                                      2020). However, they must first choose which feature to quantify from a vast array of possible cellu-
                                      lar phenotypes, such as nuclear fragmentation, protein aggregation, cell density, organelle damage
                                      and distribution, and changes to cytoskeleton organization. While quantifying a combination of
                                      these features may reflect the true state or importance of the phenotype, this approach can be chal-
                                      lenging. Researchers may need to develop a new algorithm for each feature, and then decide on the
                                      biological relevance of each parameter. This strategy is time-consuming and subject to bias.
                                          An alternative approach uses machine learning to decipher cellular features at high accuracies.
                                      For example, deep learning, a branch of artificial intelligence, uses a set of machine-learning techni-
                                      ques to train neural networks and learn input data (LeCun et al., 2015). Previously, we used pheno-
                                      typic interrogation with deep learning to identify drug-induced structural toxicity in hepatocytes and
                                      cardiomyocytes (Maddah et al., 2020). Herein, we aimed to expand that work to induced pluripo-
                                      tent stem cell-derived cardiomyocytes (iPSC-CMs) in a high-content screen (HCS) of 1280 bioactive
                                      compounds with putative primary targets. We then sought to validate identified hits using orthogo-
                                      nal assays to assess cellular stress, including mitochondrial respiration and brain natriuretic peptide
                                      (BNP) levels. Finally, we aimed to use our deep learning approach to screen a library of 1280 diverse
                                      compounds with no known targets and identify chemical structures and frameworks that show a car-
                                      diotoxicity signal in iPSC-CMs.

                                      Materials and methods
Key resources table
Reagent type
(species) or                                                    Source or                                                 Additional
resource                      Designation                       reference                       Identifiers               information
Continued on next page

Grafton et al. eLife 2021;10:e68714. DOI: https://doi.org/10.7554/eLife.68714                                                           2 of 28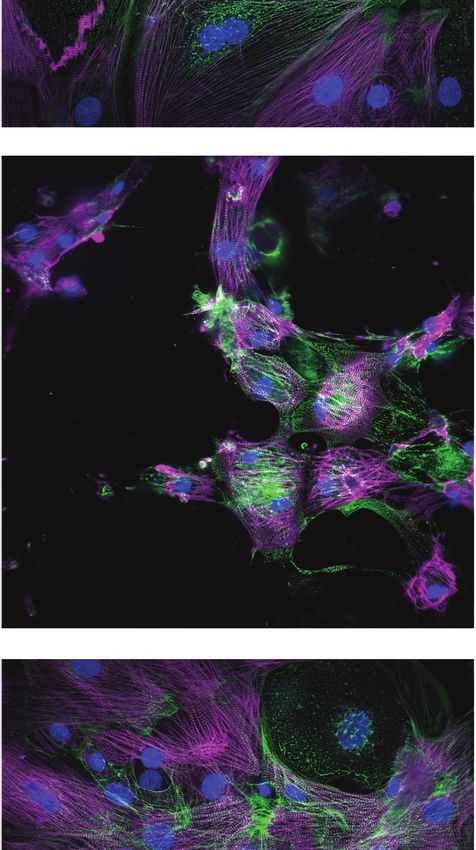
Research article                                                                           Stem Cells and Regenerative Medicine

Continued

Reagent type
(species) or                                                   Source or                                             Additional
resource                      Designation                      reference                  Identifiers                information
Cell line                     WTC                              Gladstone Institutes                                  Human iPSC line
(Homo sapiens)
Antibody                      Primary                          Santa Cruz                 Sc-137237                  1:200
                              Anti-MYBPC3
                              Mouse (monoclonal)
Antibody                      Primary                          Thermo Fisher              701914                     1:200
                              Anti-ACTN2                       Scientific
                              Rabbit (monoclonal)
Antibody                      Secondary                        Thermo Fisher              A-21202                    1:500
                              Donkey anti-Rabbit               Scientific
                              IgG (H+L) Alexa Fluor 594
Antibody                      Secondary                        Thermo Fisher              A-21207                    1:500
                              Donkey anti-Mouse                Scientific
                              IgG (H+L) Alexa Fluor 488
Sequence-                     MYH7                             Thermo Fisher              Hs01110632_m1              TaqMan qPCR probe,
based reagent                                                  Scientific                                            cardiac marker
Sequence-                     MYH6                             Thermo Fisher              Hs01101425_m1              TaqMan qPCR probe,
based reagent                                                  Scientific                                            cardiac marker
Sequence-                     TNNI3                            Thermo Fisher              Hs00165957_m1              TaqMan qPCR probe,
based reagent                                                  Scientific                                            cardiac marker
Sequence-                     TNNI1                            Thermo Fisher              Hs00913333_m1              TaqMan qPCR probe,
based reagent                                                  Scientific                                            cardiac marker
Sequence-                     MYBPC3                           Thermo Fisher Scientific   Hs00165232_m1              TaqMan qPCR probe,
based reagent                                                                                                        cardiac marker
Sequence-                     TNNT2                            Thermo Fisher              Hs00943911_m1              TaqMan qPCR probe,
based reagent                                                  Scientific                                            cardiac marker
Sequence-                     GAPDH                            Thermo Fisher              Hs99999905_m1              TaqMan qPCR probe,
based reagent                                                  Scientific                                            housekeeping marker
Chemical                      CHIR-99021                       Selleckchem                S1263                      Small molecule
compound,
drug
Chemical                      Y-27632                          Selleckchem                S1049                      Small molecule
compound,
drug
Chemical                      IWP2                             Sigma                      I0536                      Small molecule
compound,
drug
Chemical                      Blasticidine S                   Thermo Fisher              15205                      Small molecule
compound,                     hydrochloride                    Scientific
drug
Chemical                      Bortezomib                       Selleckchem                S1013                      Small molecule
compound,
drug
Chemical                      Doxorubicin                      Selleckchem                S1208                      Small molecule
compound,
drug
Chemical                      Givinostat                       Selleckchem                S2170                      Small molecule
compound,
drug
Chemical                      Bafilomycin                      Selleckchem                S1413                      Small molecule
compound,
drug
Chemical                      Paclitaxol                       Selleckchem                S1150                      Small molecule
compound,
drug
Continued on next page

Grafton et al. eLife 2021;10:e68714. DOI: https://doi.org/10.7554/eLife.68714                                                      3 of 28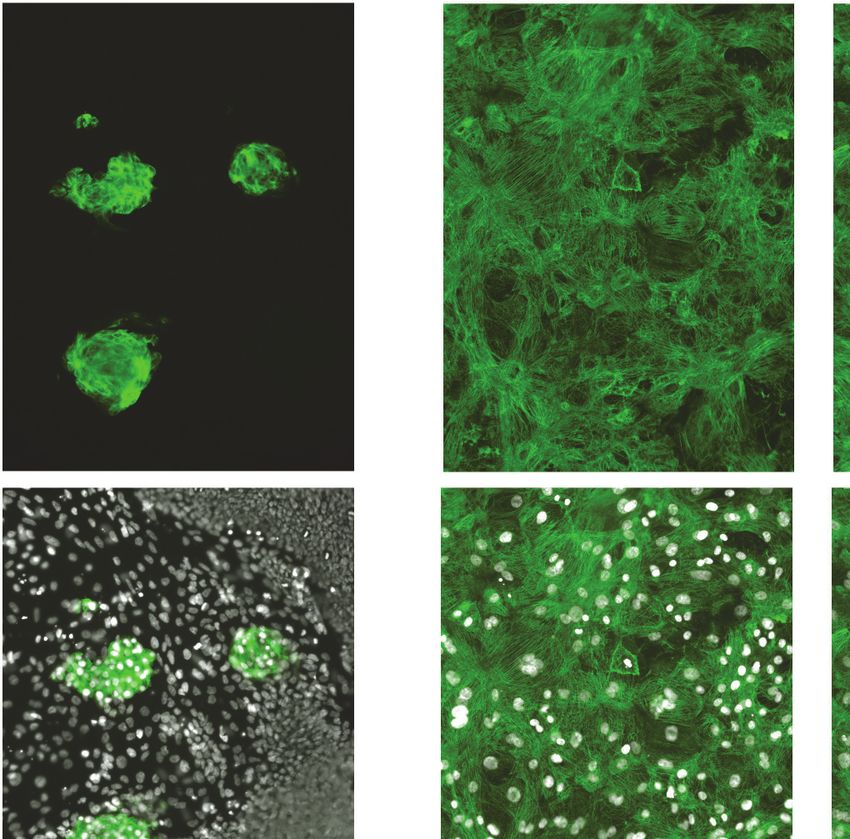
Research article                                                                              Stem Cells and Regenerative Medicine

Continued

Reagent type
(species) or                                                    Source or                                               Additional
resource                      Designation                       reference                      Identifiers              information
Chemical                      Cisapride                         Selleckchem                    S4751                    Small molecule
compound,
drug
Chemical                      Sorafenib                         Selleckchem                    S7397                    Small molecule
compound,
drug
Chemical                      FDA-approved                      Selleckchem                    L1300                    Compound library
compound,                     Drug Library
drug
Chemical                      Discovery                         Enamine                        DDS-10-Y-10              Compound library
compound,                     Diversity Set
drug
Chemical                      Dimethyl                          Sigma                          D8418                    Solvent
compound,                     sulfoxide (DMSO)
drug

                                       iPSC culture, iPSC-CM differentiation, and blasticidin selection
                                       WTC iPSCs (Mandegar et al., 2016) and derivative lines were maintained under feeder-free condi-
                                       tions on growth factor-reduced Matrigel (BD Biosciences) and fed daily with E8 medium (STEMCELL
                                       Technologies) (Ludwig et al., 2006). Accutase (STEMCELL Technologies) was used to enzymatically
                                       dissociate iPSCs into single cells. To promote cell survival during enzymatic passaging, cells were
                                       passaged with p160-Rho-associated coiled-coil kinase (ROCK) inhibitor Y-27632 (10 mM; Selleck-
                                       chem) (Watanabe et al., 2007). iPSCs were frozen in 90% fetal bovine serum (HyClone) and 10%
                                       dimethyl sulfoxide (Sigma). iPSCs were differentiated into iPSC-CMs using the Wnt modulation-dif-
                                       ferentiation method (Lian et al., 2012) with 7 mM CHIR (Selleckchem) and 5 mM IWP2 (Sigma) in
                                       RPMI media supplemented with B27 (Thermo Fisher Scientific). iPSC-CMs were purified using 1 mM
                                       blasticidin (Thermo Fisher Scientific). Then, 15 days after adding CHIR, iPSC-CMs were frozen in 90%
                                       fetal bovine serum (FBS) with 10% dimethyl sulfoxide (DMSO). iPSC-CMs were thawed in RPMI with
                                       B27% and 10% FBS directly onto Matrigel-coated 384-well plates at a density of 20,000 cells/well.
                                       The next day, the media was switched to Tenaya’s cardiomyocyte (TCM) media for 6 days before
                                       screening. TCM media comprises Dulbecco’s Modified Eagle Medium (DMEM) without glucose,
                                       10% dialyzed FBS, 10 mM D-(+)-galactose, and 1 mM sodium pyruvate. To compare TCM against
                                       previously published maturation protocols, iPSC-CMs were cultured in RPMI without glucose, sup-
                                       plemented with 4 mM L-lactic acid and 100 nM triiodo-l-thyronine (RPMI/LT3 media) (Lin et al.,
                                       2017).

                                       Generation of blasticidin-selectable iPSC line
                                       A plasmid containing the Bsd open reading frame and a selectable marker containing puromycin
                                       and green fluorescent protein was knocked into the 30 end of the MYH6 locus of WTC iPSCs. Cells
                                       were selected with puromycin. After the first round of selection, the selectable marker was removed
                                       using a plasmid expressing Cre recombinase (Figure 1—figure supplement 1A). Clones were iso-
                                       lated and verified using colony polymerase chain reaction (PCR) to ensure the presence of the Bsd
                                       marker and absence of the selectable cassette. Finalized clones showing the appropriate iPSC mor-
                                       phology were sent to WiCell for single-nucleotide polymorphism karyotyping (Figure 1—figure sup-
                                       plement 1B).

                                       Compound library screening
                                       A library containing 1280 bioactive compounds consisting of FDA-approved drugs, tool compounds,
                                       and pre-clinical drug candidates was sourced from Selleck Chemicals (Houston, TX). Screening and
                                       validation studies on the bioactive compounds were performed at three doses of 0.3 mM, 1.0 mM,
                                       and 3.0 mM in 0.1% DMSO. The library of diverse compounds was sourced from Enamine (Kyiv,

Grafton et al. eLife 2021;10:e68714. DOI: https://doi.org/10.7554/eLife.68714                                                         4 of 28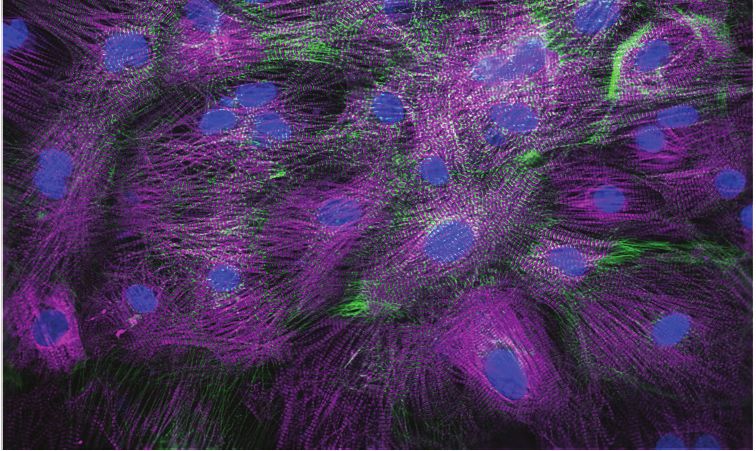
Research article                                                                           Stem Cells and Regenerative Medicine

                                   Ukraine) and screened at 1.0 mM. StarDrop version 6.6.4.23412 (https://www.optibrium.com/star-
                                   drop/) was used to analyze data from the screen of diverse compounds.

                                   Immunocytochemistry
                                   iPSC-CMs were fixed for 15 min in 4% (v/v) paraformaldehyde (Thermo Fisher Scientific) in phos-
                                   phate buffered saline (PBS) and permeabilized in 0.1% (v/v) Triton X-100 (Thermo Fisher Scientific)
                                   for 15 min. Cells were blocked in 5% (w/v) bovine serum albumin (BSA) (Sigma) with 0.1% (v/v) Triton
                                   X-100 in PBS for 60 min. Primary antibodies were diluted in 5% (w/v) BSA and 0.1% (v/v) Triton
                                   X-100 in PBS and incubated overnight at 4˚C. After treatment with primary antibodies, cells were
                                   washed three times in PBS for 15 min each. Secondary antibodies were diluted in 5% (w/v) BSA and
                                   0.1% (v/v) Triton X-100 in PBS, and then incubated for 1 hr at room temperature. After treatment
                                   with the secondary antibody, cells were washed three times in PBS for 15 min each. Nuclei were
                                   stained using Hoechst 33342 (Thermo Fisher Scientific) (1:1000 dilution). Images were taken using a
                                   Cytation 5 microscope (BioTek Instruments) at 10 magnification (nine images per 384-well plate). A
                                   list of primary and secondary antibodies with the appropriate dilution is listed in Supplementary file
                                   4.

                                   Sarcomere analysis using scanning gradient Fourier transform
                                   Sarcomere organization and alignment were assessed using scanning gradient Fourier transform
                                   (SGFT) with a pattern size of 1.8, scanning resolution of 16, and a Fourier threshold of >0.8
                                   (Salick et al., 2020). Briefly, SGFT performs gradient analysis on ACTN2 images to determine the
                                   myofibril directionality and then one-dimensional fast Fourier transforms to determine sarcomere
                                   organization and alignment. The code for this SGFT algorithm is available on GitHub: https://github.
                                   com/maxsalick/SGFT           (Grafton,      2021       copy        archived      at      swh:1:rev:
                                   1413b18726172659dcb9a09e6f91653063ab3361).

                                   Contractility measurements
                                   Contractility video measurements were taken with an SI8000 Cell Motion Imaging System (Sony Bio-
                                   technology) and analyzed using Pulse software (Maddah et al., 2015).

                                   Construction of deep learning models and neural network architecture
                                   To avoid complications associated with cell segmentation, we used block image segmentation and
                                   seeded a confluent monolayer of iPSC-CMs. Deep learning artificial intelligence models were built
                                   using the PhenoLearn platform (https://www.phenolearn.com/). We used PyTorch as the framework
                                   for the deep learning library, and a ResNet50 architecture, a 50-layer-deep convolutional neural net-
                                   work. Images from the DMSO control group were trained against the toxic groups (defined as either
                                   mildly toxic, toxic, or highly toxic). Each input image was divided into 12 square sub-images to have
                                   sizes ranging from 224  224 pixels to 300  300 pixels (Maddah et al., 2020). Each sub-image was
                                   flipped and rotated to create seven more augmented sub-images, and then fed into the input layer
                                   of ResNet50. Pseudo-image generation by rotation and flipping ensures enough diversity is seen by
                                   the network so that the algorithm is not biased based on the orientation of the images (Moen et al.,
                                   2019). We used 80% of the images to construct the neural network and the remaining 20% to vali-
                                   date the deep learning model. A consistent set of parameters were used for all training operations,
                                   including an initial learning rate of 0.01 and 20 epochs. For each training, the final neural network
                                   was selected from the epoch with the highest validation accuracy. Z-factor was calculated using the
                                   following formula:

                                                                                            3 sp   sn
                                                                          Z     f actor ¼ 1
                                                                                              p  n

                                   proBNP assay
                                   The proBNP/NPPB human sandwich ELISA kit (Invitrogen) was used to determine the level of
                                   secreted human proBNP. Cell culture media was collected from wells containing approximately 105
                                   iPSC-CMs exposed to cardiotoxic drugs for 4 days. Media was diluted to obtain a proBNP concen-
                                   tration between 0.137 and 100 ng/mL (1:3-1:5). A standard mixture of recombinant human proBNP
                                   was diluted 1:3 from 0.137 to 100 ng/mL. Then 100 mL of diluted sample and standards were added

Grafton et al. eLife 2021;10:e68714. DOI: https://doi.org/10.7554/eLife.68714                                                      5 of 28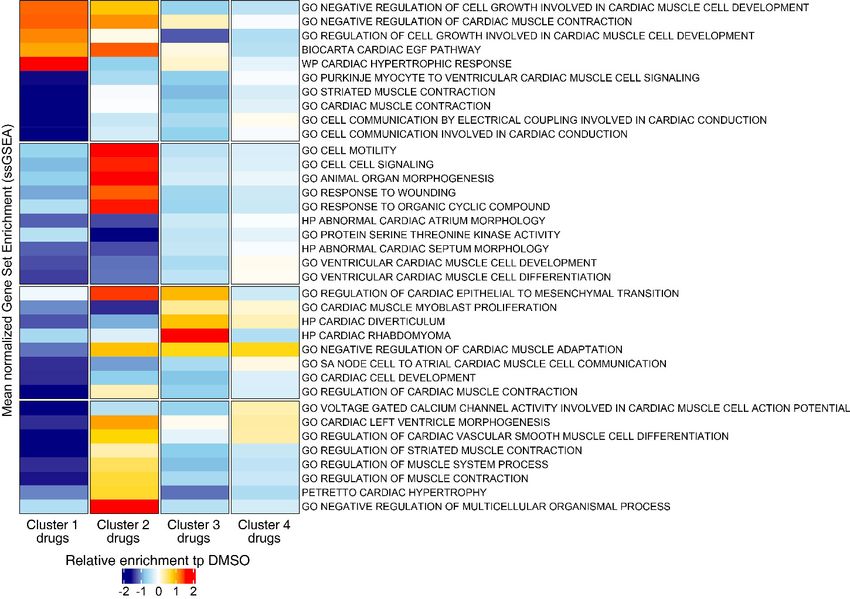
Research article                                                                           Stem Cells and Regenerative Medicine

                                   to the human proBNP solid-phase sandwich ELISA microplate and incubated at room temperature
                                   for 2.5 hr with gentle shaking. The plate was then washed four times with 300 mL of 1 wash buffer.
                                   Next, 100 mL/well of biotin conjugate was added to a microplate and incubated at room tempera-
                                   ture for 1 hr with gentle shaking. The plate was then washed four times with 300 mL 1 wash buffer.
                                   Next, 100 mL/well of streptavidin-horseradish peroxidase solution was added to the microplate and
                                   incubated at room temperature for 45 min with gentle shaking. The plate was then washed four
                                   times with 300 mL 1 wash buffer. Next, 100 mL/well of TMB substrate was added, and the plate was
                                   incubated in the dark at room temperature for 30 min. Then, 50 mL of stop solution was added
                                   directly to the TMB substrate and gently mixed. Absorbance was measured using a Cytation 5
                                   microscope at 450 nm and 550 nm. For analysis, background signal was removed by subtracting the
                                   550 nm signal from the 450 nm signal. A linear regression was fit to the standard absorbance meas-
                                   urements. ProBNP values from experimental samples were extrapolated from linear regression. Ini-
                                   tial sample dilutions were accounted for when determining the final proBNP concentration.

                                   RNA extraction and TaqMan qPCR analysis
                                   Approximately 105 to 106 iPSC-CMs were lysed with TRI Reagent (Zymo Research) and frozen at
                                     80˚C to ensure complete cell lysis. Total RNA was extracted and washed from lysed cells using the
                                   Direct-zol-96 RNA Kit (Zymo Research) according to the manufacturer’s instructions. Samples were
                                   treated with DNase I for 15 min at room temperature. cDNA was reverse transcribed from 1 mg of
                                   RNA through random hexamers using the SuperScript-III kit (Invitrogen) according to the manufac-
                                   turer’s instructions. Real-time qPCR reactions were performed using the TaqMan universal PCR mas-
                                   ter mix (Applied Biosystems) with the TaqMan probes listed in Supplementary file 5 (Life
                                   Technologies). RT-qPCR reactions were performed using the QuantStudio7 Flex Real-Time PCR sys-
                                   tems (Life Technologies). Each reaction was performed in triplicate for a given RT-qPCR run, and
                                   each condition had four experimental replicates. Relative expression of the gene of interest was nor-
                                   malized to glyceraldehyde 3-phosphate dehydrogenase (GAPDH) as the housekeeping control using
                                   the 2–DDCT method (Schmittgen and Livak, 2008).

                                   High-throughput transcriptional analysis using RNA-seq
                                   Raw RNA-seq reads were aligned with Salmon (Patro et al., 2017) (version 1.3.0) to the GENCODE
                                   (Frankish et al., 2019) version 33 reference transcript assembly (hg38 v.13) using best practice
                                   parameters to ensure mapping validity and reproducibility (–seqBias –gcBias –posBias –useV-
                                   BOpt –rangeFactorizationBins 4 –validateMappings –mimicStrictBT2). Next, tximport
                                   (Soneson et al., 2015) was used to generate an expression matrix normalized to transcripts per mil-
                                   lion (TPM). To ensure consistency, we limited our analysis to genes with detectable expression in at
                                   least 90% of the samples. Protein-coding genes were determined using Ensembl release 100 human
                                   annotation (Cunningham et al., 2019) (GRCh38, Apr 2020) and extracted by biomaRt
                                   (Durinck et al., 2009) (version 2.45.9); non-protein-coding and mitochondrial genes were omitted
                                   from the analysis. After this step, expression values were re-normalized to TPM. After adding 1 as
                                   the pseudo-count, the expression matrix was log2-transformed. For the initial assessment, principal
                                   component analysis (PCA) models were generated in the R environment using the prcomp function,
                                   and the first two principal components were used for visualization. To quantify the distances
                                   between each drug’s samples and generate a PCA-based similarity matrix, we used Euclidean dis-
                                   tance in the PCA space, as calculated by the pca2euclid function from the tcR package. We calcu-
                                   lated the distance using all replicates and used the averaged expression in replicates for each drug.
                                   Visualizations were generated in R using the ggplot2 and ComplexHeatmap packages.
                                      To compare the differential gene expression analysis of these clusters with the DMSO-treated
                                   group, we limited our downstream analysis to the genes in our curated list of genes with high rela-
                                   tive expression in cardiac tissue. We also applied the following filters: (1) protein-coding genes (as
                                   defined by Ensembl) that had a median log2-transform TPM expression of >1 in at least one cluster
                                   and (2) showed a minimum of 0.25-fold change compared to the DMSO control. Transcriptomes in
                                   each cluster’s replicates were compared with DMSO-treated replicates by Welch’s t-test. A t-statistic
                                   value for each gene’s expression vector was used to rank-order the transcriptome in each cluster.
                                      To evaluate functional perturbations in each cluster, we limited our analysis to two gene sets:
                                   those labeled with a ‘cardiac’ annotation in MSigDB (Liberzon et al., 2011) version 7.2 (127 gene

Grafton et al. eLife 2021;10:e68714. DOI: https://doi.org/10.7554/eLife.68714                                                      6 of 28
Research article                                                                             Stem Cells and Regenerative Medicine

                                   sets), and the top 100 gene sets that significantly overlapped with our curated cardiac-rich expres-
                                   sion gene set as defined by false discovery rate (FDR) q-value. The FDR q-value is the FDR analog of
                                   the hypergeometric p-value after correcting for multiple hypothesis testing according to the Benja-
                                   mini and Hochberg method. In each drug cluster, Welch’s t-test statistical values were used to iden-
                                   tify and compare most perturbed gene sets to the DMSO-treated group. A p-value < 0.05 was
                                   considered significant. We deposited our RNA-seq data on the Gene Expression Omnibus (GEO)
                                   database: GEO Submission (GSE172181), https://www.ncbi.nlm.nih.gov/geo/query/acc.cgi?acc=
                                   GSE172181.

                                   Seahorse assay
                                   The Agilent Seahorse XFe96 Analyzer was used to measure mitochondrial function in iPSC-CMs. The
                                   96-well Seahorse plates were coated with Matrigel (1/100 dilution) in a phenol-free medium over-
                                   night. WTC iPSC-CMs were seeded at 30,000 cells per XFe96 well and recovered in TCM media for
                                   1 week. Cardiotoxic compounds were diluted to 3 mM, 1 mM, 0.3 mM, and 0.1 mM in 1.0% DMSO in
                                   TCM media. Drugs were administered in fresh media for 4 days. Following 4 days of exposure to
                                   drugs, the cells were washed and incubated for 1 hr before the assay with Seahorse XF DMEM Basal
                                   Medium supplemented with 2 mM glutamine, 2 mM pyruvate, and 10 mM glucose. The Seahorse
                                   XFe96 cartridge was prepared according to the manufacturer’s guidelines. First, basal oxygen con-
                                   sumption rate (OCR) was measured. Next, the Mito Stress Test was performed with inhibitors
                                   injected in the following order: oligomycin (2.5 mM), carbonyl cyanide 4-(trifluoromethoxy) phenylhy-
                                   drazone (FCCP; 1 mM), and rotenone and antimycin A (0.5 mM). OCR values were normalized to the
                                   total nuclear count per well as quantified by Hoechst staining. Basal respiration was calculated as
                                   (last rate measurement from the first oligomycin injection) – (minimum rate measurement after rote-
                                   none/antimycin A). Maximal respiration was calculated as (maximum rate measurement after FCCP
                                   injection) – (minimum rate measurement after rotenone/antimycin A). Spare respiratory capacity was
                                   calculated as (maximal respiration) – (basal respiration). ATP production was calculated as (last mea-
                                   surement before oligomycin injection) – (minimum rate after oligomycin injection).

                                   Proteasome activity assay
                                   Proteasome activity was measured in iPSC-CMs using the Proteasome-Glo Chymotrypsin-Like Assay
                                   according to the manufacturer’s instructions (Promega). Cells were incubated with the inhibitors
                                   (ranging from 2 to 5000 nM) for 1 hr before running the assay. IC50s were calculated using PRISM 8
                                   software.

                                   Results
                                   iPSC-CM production, selection, and recovery after thaw
                                   To efficiently and reproducibly assess cardiotoxicity in a highly enriched population of cardiomyo-
                                   cytes, we generated a blasticidin-selectable iPSC line by targeting the MYH6 locus (Figure 1—figure
                                   supplement 1A, B). Following standard differentiation of iPSC-CMs (Figure 1A), blasticidin selection
                                   reproducibly enriched a heterogenous population of iPSC-CMs to greater than 95% pure iPSC-CMs
                                   as measured by ACTN2, TNNT2, and MYBPC3 immunostaining (Figure 1B, C). Compared to previ-
                                   ously published protocols, recovery in culture media leads to improved maturity metrics based on
                                   quantitative polymerase chain reaction (qPCR) markers, contractility (beat rate and velocity), and
                                   immunostaining (Figure 1—figure supplement 1C–F). To optimize recovery time of iPSC-CMs
                                   before screening, daily contractility metrics were performed using Pulse (Maddah et al., 2015).
                                   Then, 6–8 days after thaw, iPSC-CMs fully recovered and had stabilized contractility readings
                                   (Figure 1D).

                                   Known cardiotoxic compounds used to establish the extent of
                                   functional damage to iPSC-CMs
                                   To establish training sets for deep learning models, we treated iPSC-CMs with bortezomib (protea-
                                   some inhibitor), doxorubicin (topoisomerase inhibitor), cisapride (serotonin 5-HT4 receptor agonist),
                                   sorafenib (tyrosine kinase inhibitor), givinostat (histone deacetylase inhibitor), bafilomycin (vacuolar-
                                   type H+-ATPase), paclitaxel (microtubule stabilizer), and JQ1 (bromodomain and extraterminal

Grafton et al. eLife 2021;10:e68714. DOI: https://doi.org/10.7554/eLife.68714                                                        7 of 28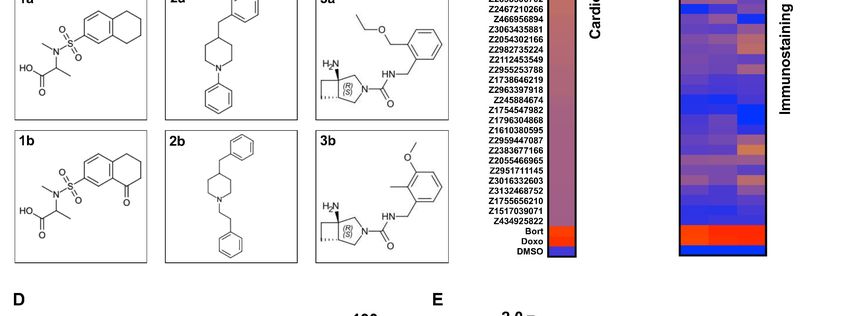
Research article                                                                                                                       Stem Cells and Regenerative Medicine

            !                                                                                                           -
                                           8)'')3&                        45%),1                   9+::&"&,*+)*&

                                                                                                                                % Positive Cells for Marker
                                                                                                                                                               100

                                                                                                                                                                       80

                                                                                                                                                                       60
      ;
Research article Stem Cells and Regenerative Medicine
! Bortezomib Doxorubicin Bafilomycin @
"+41'5+6/7
Displacement (Pixels)
10µM 10µM 10µM
0.6 0.6 0.6
3µM 3µM 3µM
1µM 1µM 1µM
0.3µM 0.4 0.3µM 0.4 0.3µM 0.4
0.1µM 0.1µM 0.1µM
0.03µM 0.2 0.03µM 0.2 0.03µM 0.2
0.01µM 0.01µM 0.01µM
DMSO DMSO DMSO
0 0 0
1 2 3 4 1 2 3 4 1 2 3 4
Days on Drug Days on Drug Days on Drug
"
Beats Per Minute
150 150 150
125 125 125
3+.+487/0/9
100 100 100
75 75 75
50 DMSO 50 DMSO 50 DMSO
25 25 25
0 0 0
0.01 0.1 1 10 0.01 0.1 1 10 0.01 0.1 1 10
Bortezomib Dose (µM) Doxorubicin Dose (µM) Bafilomycin Dose (µM)
A
Velocity (Pixels/s)
12 12 12
10 10 10
8 8 8
6 DMSO 6 DMSO 6 DMSO
4 4 4
2 2 2
0 0 0 ":,/)+620/9
0.01 0.1 1 10 0.01 0.1 1 10 0.01 0.1 1 10
Bortezomib Dose (µM) Doxorubicin Dose (µM) Bafilomycin Dose (µM)
3
(DMSO Normalized)
150 ACTN2 150 ACTN2 150 ACTN2
Signal Intensity
125 MYBPC3 MYBPC3 MYBPC3
125 125
Nuclear Count Nuclear Count Nuclear Count
100 DMSO 100 100
DMSO DMSO
75 75 75
50 50 50
25 25 25
0 0 0
0.01 0.1 1 10 0.01 0.1 1 10 0.01 0.1 1 10
Bortezomib Dose (µM) Doxorubicin Dose (µM) Bafilomycin Dose (µM)
Organizational Index
3;
1.0 1.0 1.0
DMSO DMSO DMSO
0.8 0.8 0.8
0.6 0.6 0.6
0.4 0.4 0.4
0.2 0.2 0.2
0.0 0.0 0.0
0.01 0.1 1 10 0.01 0.1 1 10 0.01 0.1 1 10
Bortezomib Dose (µM) Doxorubicin Dose (µM) Bafilomycin Dose (µM)
?
&'(')*+,*
% $ # %$ # % $ #
-+./0/12
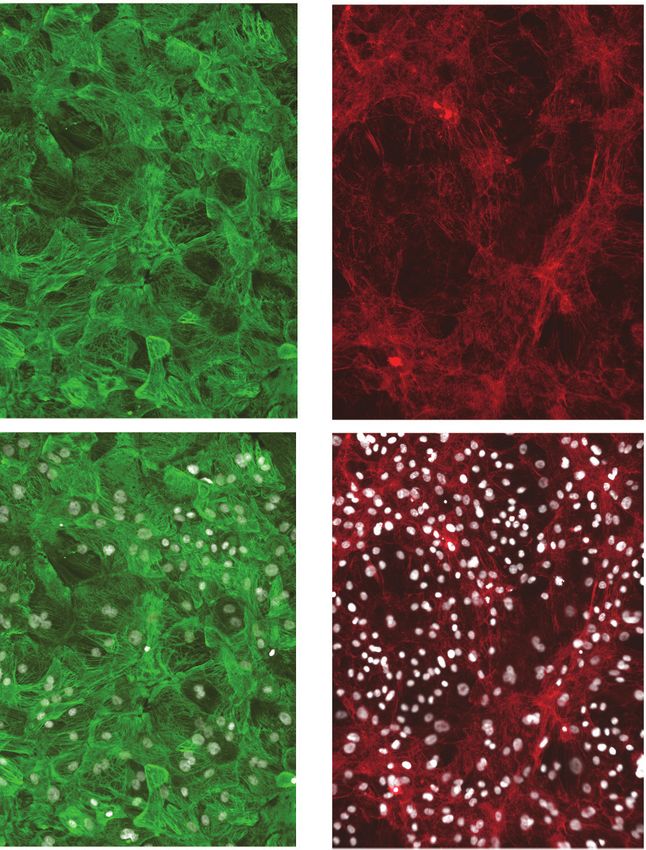
Figure 2. Effect of representative cardiotoxins on inducing structural toxicity in induced pluripotent stem cell-derived cardiomyocytes (iPSC-CMs). (A)
Displacement of iPSC-CMs was measured as a function of dose and duration of exposure to drug. Results from three representative cardiotoxins
(bortezomib, doxorubicin, and bafilomycin) are displayed as a heatmap. (B, C) Contractility measures of beats per minute and velocity on the fourth day
of drug exposure as a function of drug dose. Data indicate a time- and dose-dependent decline in contractility. Error bars = SD; n = 8 technical
replicates per drug dose, n = 26 for dimethyl sulfoxide (DMSO) group. (D) Signal intensities of sarcomeres stained with antibodies against MYBPC3 and
ACTN2 were measured using total fluorescent staining and normalized to DMSO control. Nuclear count was quantified and normalized to DMSO
Figure 2 continued on next page
Grafton et al. eLife 2021;10:e68714. DOI: https://doi.org/10.7554/eLife.68714 9 of 28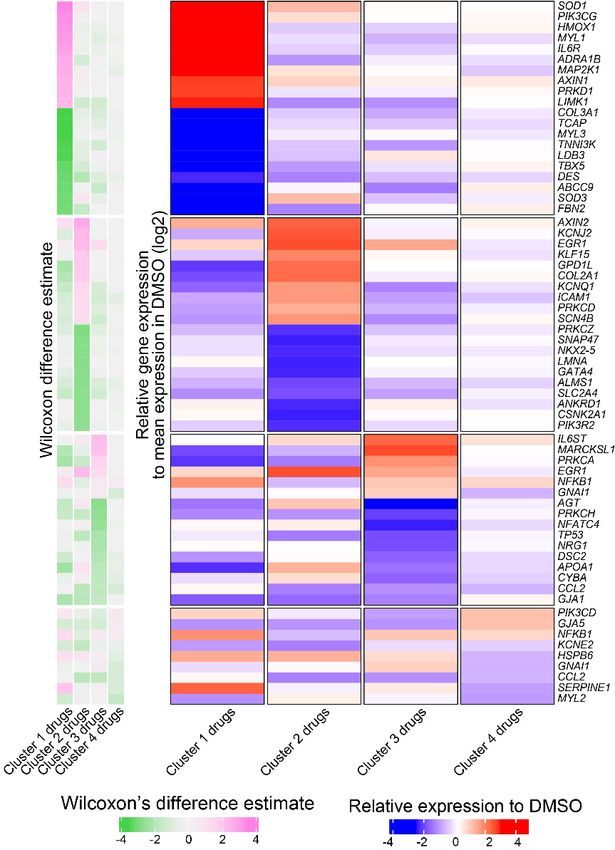
Research article                                                                                     Stem Cells and Regenerative Medicine

Figure 2 continued
control. Dashed gray line, DMSO control condition. Error bars = SD; n = 8 technical replicates per drug dose, n = 26 for DMSO group. (E) Relative
sarcomere organization quantified using scanning gradient Fourier transform and normalized to DMSO control. The organizational index refers to the
average Fourier strength measured across the image. Error bars = SD; n = 8 technical replicates per drug dose, n = 26 for DMSO group. (F) Levels of
structural toxicity for each drug were binned into the three categories of highly toxic (class 3), toxic (class 2), and mildly toxic (class 1). (G)
Representative immunostaining of levels of structural toxicity in iPSC-CMs treated with bortezomib (30 nM), doxorubicin (100 nM), and bafilomycin (100
nM). Magenta, MYBPC3; green, ACTN2. Scale bars = 100 mm.
The online version of this article includes the following source data and figure supplement(s) for figure 2:
Source data 1. Effect of representative cardiotoxins on inducing structural toxicity in iPSC-CMs.
Figure supplement 1. Known cardiotoxins were used to establish levels of functional toxicity in induced pluripotent stem cell-derived cardiomyocytes
(iPSC-CMs).

                                    displayed as a heatmap (Figure 2A). For each compound, beats per minute and velocity measured
                                    on the fourth day of drug exposure are displayed as a function of drug dose (Figure 2B, C). We
                                    observed that the cardiotoxins had both a dose- and time-dependent effect on contractility meas-
                                    urements. In most cases, the contraction velocity and displacement declined, and the beat rate
                                    reduced as a function of dose and time (Figure 2—figure supplement 1). In some instances (e.g.,
                                    doxorubicin), immediately before spontaneous contractility completely stopped, we observed an
                                    increased beat rate and reduced contraction velocity and displacement. This change may reflect a
                                    compensatory mechanism by which the cells increase beat rate to induce more ‘output’ while the
                                    velocity and displacement are reduced (Burridge et al., 2016; Maddah et al., 2015).
                                        Next, we assessed sarcomere organization and cell survival. Sarcomere staining intensity was
                                    measured using antibodies against MYBPC3 and ACTN2, and cell survival was measured using
                                    Hoechst nuclear stain (Figure 2D). To assess the structural integrity of the sarcomere and myofibril,
                                    which are negatively impacted by cardiotoxin-induced damage (Burridge et al., 2016; Judge et al.,
                                    2017; Maillet et al., 2016), sarcomere organization and alignment were also analyzed with the
                                    SGFT. This method can quantify subcellular myofibril alignment through one-dimensional fast Fourier
                                    transforms following sarcomere mapping (Salick et al., 2020; Figure 2E). Based on contractility met-
                                    rics, sarcomeric staining, and nuclear count, we define three levels of structural toxicity binned into
                                    the three categories: highly toxic (class 3), toxic (class 2), and mildly toxic (class 1). DMSO-treated
                                    cells were designated as non-toxic (class 0) (Figure 2F and Supplementary file 1). Representative
                                    immunostaining of iPSC-CMs stained with MYBPC3 and ACTN2 show various levels of structural tox-
                                    icity (Figure 2G).

                                    Optimizing the deep learning model
                                    Frozen iPSC-CMs were thawed and allowed to recover in 384-well plates to enable high-content
                                    screening. These plates were divided into three categories: a training plate, a validation plate, and
                                    library plates. The cells were then immunostained using MYBPC3 before capturing images. Images
                                    from the training plate (dosed with known cardiotoxins ranging from 10 nM to 10 mM for 4 days)
                                    were used to establish the deep learning models. Images from the validation plate were used to test
                                    the accuracy of the deep learning models. And images from the library plates were used to test the
                                    toxicity level of compounds. iPSC-CMs in the library plates were exposed to 1280 bioactive com-
                                    pounds at three doses (0.3 mM, 1.0 mM, and 3.0 mM for 4 days) (Figure 3A).
                                        Based on defined criteria for reduced contractility, loss of immunostaining, and nuclear count
                                    when cells were treated with various doses of cardiotoxins (Figure 2F and Supplementary file 1),
                                    we developed three deep learning models: 4-class, 3-class, and 2-class. The 4-class model distin-
                                    guished highly toxic, toxic, and mildly toxic compound doses from the non-toxic DMSO-treated con-
                                    dition. The 3-class model combined highly toxic and toxic compound doses and kept mildly toxic
                                    compound doses separate. The 2-class model binned highly toxic and toxic compound doses from
                                    the non-toxic DMSO-treated condition. The total number of images used per class is outlined in
                                    Supplementary file 2.
                                        We compared the deep learning accuracies across the three models. All models showed more
                                    than 95% accuracy in identifying the non-toxic DMSO-treated condition (class 0). For the 2-class
                                    model, the validation showed 100% accuracy in distinguishing the toxic from non-toxic conditions.
                                    For the 3- and 4-class models, the accuracies were lower when attempting to distinguish mildly toxic,

Grafton et al. eLife 2021;10:e68714. DOI: https://doi.org/10.7554/eLife.68714                                                                 10 of 28
Research article Stem Cells and Regenerative Medicine
! :;#%?%@" /01-#-$ !""#$
2.0 DMSO (0.1%)
Doxorubicin (0.3µM)
Cardiotoxicity Score
Doxorubicin (1.0µM)
%&''()&*+,&-$ .(/01-#-$ Test Plate + Compounds
1.5
(3-Class Model)
F#$" 3 4 23
1.0
:-#0808B(='#D&
R2 = 0.930
0.5
0.0
0.00 0.25 0.50 0.75 1.00
J#'09#D0+8(='#D& Cardiotoxicity Score
A5#B&( (2-Class Model)
!*C70"0D0+8
2-Class vs. 4-Class Model
3.0 DMSO (0.1%)
G70'9(H&7-#'( Doxorubicin (0.3µM)
Cardiotoxicity Score
Doxorubicin (1.0µM)
H&DResearch article Stem Cells and Regenerative Medicine
Figure 3 continued
the three models. All models show more than 95% accuracy in identifying the non-toxic dimethyl sulfoxide (DMSO)-treated condition (class 0). Model
accuracies were lower when attempting to distinguish mildly toxic, toxic, and highly toxic classes. (C) The three deep learning models compared in a
two-dimensional plot on the validation plate. Regardless of how each model was trained (based on the defined images fed into the neural network), all
models were strongly correlated when analyzing the validation dataset (R2 > 0.93). The DMSO-treated cells scored the lowest in toxicity, and
doxorubicin-treated (1 mM) cells scored the highest. The mildly toxic class (doxorubicin at 0.3 mM) showed an intermediate toxicity separated from the
non-toxic and highly toxic classes.
The online version of this article includes the following source data and figure supplement(s) for figure 3:
Source data 1. Schematic of drug screening and deep learning approach.
Figure supplement 1. Optimization of cell seeding density and model performance.
Figure supplement 1—source data 1. Optimization of cell seeding density and model performance.
toxic, and highly toxic classes (Figure 3B). This reduced accuracy may be a result of cellular toxicity
signatures that follow a continuous spectrum, rather than clearly defined categories.
After training, the three deep learning models were independently used to score the validation
plate (which the neural network had not seen before). The results from the three models on the vali-
dation plate are compared in a 2D plot in Figure 3C. The data suggested that all three models
showed a strong correlation upon validation (R2 > 0.93, pResearch article Stem Cells and Regenerative Medicine
/ !""#$%&'()$)$*+ 4 0--1+2-(3$)$*+ 7 5%.-6+
,-(.%#' ,-(.%#' 7%"1(3)&%$
Z-Factor Z-Factor 3-Class vs. 4-Class Model
– 8.31 –0.99 0.51 0.60 DMSO (0.1%)
Cardiotoxicity Score
3.0
Nuclear Count/Well
Bortezomib (0.1µM)
5000
3.0
Cardiotoxicity Score
Doxorubicin (1.0µM)
(4-Class Model)
Screening Plates
4000
(4-Class Model)
2.0
3000 2.0
2000 1.0
1.0 R2 = 0.964
1000
0 0.0 0.0
0.0 0.5 1.0 1.5 2.0
SO
)
)
SO
)
)
µM
µM
µM
µM
Cardiotoxicity Score
M
M
.1
.0
.1
.0
D
D
(0
(1
(0
(1
(3-Class Model)
t
o
t
o
or
or
ox
ox
B
B
D
D
Z-Factor Z-Factor 2-Class vs. 3-Class Model
– 6.02 –0.02 0.52 0.59 DMSO (0.1%)
Cardiotoxicity Score
2.0
MYBPC3 Intensity
Bortezomib (0.1µM)
(DMSO Normalized)
150
Cardiotoxicity Score
Doxorubicin (1.0µM)
2.0
(3-Class Model)
Screening Plates
1.5
(3-Class Model)
100
1.0
1.0
50 R2 = 0.965
0.5
0 0.0 0.0
0.00 0.25 0.50 0.75 1.00
SO
)
)
SO
)
)
µM
µM
µM
µM
Cardiotoxicity Score
M
M
.1
.0
.1
.0
D
D
(0
(1
(2-Class Model)
(0
(1
t
o
t
o
or
or
ox
ox
B
B
D
D
Z-Factor Z-Factor 2-Class vs. 4-Class Model
– 2.68 –0.19 0.78 0.81 DMSO (0.1%)
Cardiotoxicity Score
3.0
Bortezomib (0.1µM)
(DMSO Normalized)
ACTN2 Intensity
150
Cardiotoxicity Score
Doxorubicin (1.0µM)
1.0
(2-Class Model)
Screening Plates
(4-Class Model)
2.0
100
0.5
1.0 R2 = 0.956
50
0 0.0 0.0
0.00 0.25 0.50 0.75 1.00
SO
)
)
SO
)
)
µM
µM
µM
µM
Cardiotoxicity Score
M
M
.1
.0
.1
.0
D
D
(0
(1
(2-Class Model)
(0
(1
t
o
t
o
or
or
ox
ox
B
B
D
D
Figure 4. Dynamic range and Z-factors of positive and negative controls in screening plates. (A) Comparison of Z-factor of nuclear count and MYBPC3
and ACTN2 staining intensities for dimethyl sulfoxide (DMSO) vs. bortezomib (Bort; 0.1 mM) and doxorubicin (Doxo; 1 mM). The Z-factors (< 0) and the
limited dynamic range of the nuclear count and sarcomere intensities prevent reliable separation of positive and negative controls. Error bars = SD. (B)
While using deep learning (regardless of how the models are trained), the dynamic range and Z-factors (> 0.5) enable identification of the toxic controls
Figure 4 continued on next page
Grafton et al. eLife 2021;10:e68714. DOI: https://doi.org/10.7554/eLife.68714 13 of 28Research article Stem Cells and Regenerative Medicine
Figure 4 continued
from the DMSO condition. Error bars = SD. (C) Cardiotoxicity scores from all screening wells at three doses of DMSO, bortezomib, and doxorubicin
controls are compared in various deep learning models. Regardless of how each deep learning model was trained, cardiotoxicity scores from all three
models had strong correlation when applied to the screening plates (R2 > 0.95).
The online version of this article includes the following source data and figure supplement(s) for figure 4:
Source data 1. Dynamic range and Z-factors of positive and negative controls in screening plates.
Figure supplement 1. Sarcomere intensity and nuclear count on screening plates at three doses.
Figure supplement 1—source data 1. Sarcomere intensity and nuclear count on screening plates at three doses.
(Bray and Carpenter, 2017; Zhang et al., 1999). By using deep learning and the appropriate cell
seeding density, we can increase the dynamic range and reduce the variability between treatment
groups. These changes would increase the screening window coefficient (Z-factor > 0.5) for an HCS
(Figure 4B).
We compared the cardiotoxicity scores from all screening wells at three doses, including the
DMSO, bortezomib, and doxorubicin controls. Regardless of how each deep learning model was
trained, all three models showed strong correlation (R2 > 0.95, pResearch article Stem Cells and Regenerative Medicine
DMSO (0.1%)
" Bortezomib (0.1µM)
# Deep Learning Immunostaining
nt
ou
Doxorubicin (1.0µM)
C
N 3
ar
A PC
N T2
1. µM
3. µM
µM
0. SO
Compound Library
le
YB
uc
M
C
3
0
0
Cardiotoxicity Score
M
D
!"#$%
!"#$%
2.0 2 1.0
WZ8040
Zileuton
1.5
Mosapride 1 0.5
Hit Threshold
Roscovitine
&"'(!"#$%
&"'(!"#$%
1.0 Streptozotocin
Adrucil 0 0
Immunostaining Toxicity Signal
Cardiotoxicity Score
0.5 Betamethasone
Meropenem
Regorafenib
0.0 Lamivudine
Compounds at 0.3µM Cntrls Chlorpromazine
Imidapril
Rasagiline
Cardiotoxicity Score
2.0 Anagrelide
CI-1040
Dimesna
1.5
Sotalol
Hit Threshold
Melatonin
1.0 Solifenacin
BI 2536
0.5 Daunorubicin
Nitrendipine
PHA-767491
0.0 Rosiglitazone
Compounds at 1.0µM Cntrls AG-1478
Bortezomib
Doxorubicin
Cardiotoxicity Score
2.0
1.5
Hit Threshold
$
1.0
0.5
0.0
Compounds at 3.0µM Cntrls
!
Total=25
DNA intercalator (4) MEK1,2 inhibitor (1)
Ion channel blocker (4) Multi-kinase inhibitor (1)
GPCR agonist/antagonist (4) PLK4, BRD4 inhibitor (1)
EGFR inhibitor (2) PPARG agonist (1)
CDK inhibitor (2) Other (5)
Figure 5. Screen of bioactive compound library and identified cardiotoxic hits. (A) Cardiotoxicity score from screening 1280 bioactive compounds at
three doses. Data from the 3-class deep learning model are plotted. Higher scores correspond to a higher probability of a cardiotoxicity signature.
Bortezomib and doxorubicin were used as cardiotoxic controls (Cntrls). (B) Cardiotoxicity heatmap scores of top 25 cardiotoxic hits based on deep
learning signal. The immunostaining signal is also displayed as a heatmap. Drugs and doses with cardiotoxicity signals in induced pluripotent stem cell-
Figure 5 continued on next page
Grafton et al. eLife 2021;10:e68714. DOI: https://doi.org/10.7554/eLife.68714 15 of 28Research article Stem Cells and Regenerative Medicine
Figure 5 continued
derived cardiomyocytes (iPSC-CMs) are indicated in red and yellow, while non-toxic drugs are indicated in blue. Signal intensity from immunostaining
and nuclear count was normalized to the dimethyl sulfoxide (DMSO) control and converted to a toxicity scale. Based on the generated heatmaps,
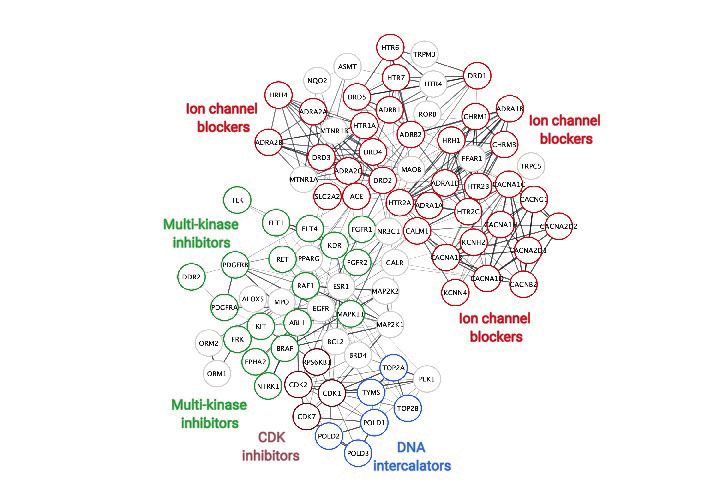
phenotypic screening with deep learning is more sensitive in detecting signals than pure immunostaining assays. (C) Target class composition of top
cardiotoxic hits from the screen, including DNA intercalators and ion channel blockers, as well as epidermal growth factor receptor (EGFR), cyclin-
dependent kinase (CDK), and multi-kinase inhibitors. (D) Search Tool for the Retrieval of Interacting Genes/Proteins (STRING) protein-protein interaction
network was used to identify interactions between drug targets (nodes) identified through the PRISM repurposing dataset. Seven clusters in four
protein families of DNA (green), multi-kinase (light blue), ion channels (dark blue), and CDK (red) were found based on the highest number of
interactions. The minimum required interaction score was set to 0.4, and the edge thickness indicated the degree of data support.
The online version of this article includes the following source data and figure supplement(s) for figure 5:
Source data 1. Screen of bioactive compound library and identified cardiotoxic hits.
Figure supplement 1. Screening results and hit identification.
Figure supplement 1—source data 1. Screening results and hit identification.
Figure supplement 2. Deep learning vs. immunostaining analysis.
Chlorpromazine (dopamine and potassium channel inhibitor) was linked to fast and irregular heart
rate (WebMD, 2020). Anagrelide (PDE3 inhibitor) may cause cardiovascular effects, including fast,
irregular, pounding, or racing heartbeat or pulse (Clinic M, 2020). Sotalol (beta-blocker and anti-
arrhythmic) has serious cardiac side effects, including QT prolongation, heart failure, or broncho-
spasm (FDA.gov, 2020). Solifenacin (muscarinic receptor antagonist) overdose may cause fast heart-
beat (Plus M, 2020). Daunorubicin (doxorubicin analog, topoisomerase II inhibitor, and DNA
intercalator) causes cardiotoxicity (Menna et al., 2012; Sawyer et al., 2010). Rosiglitazone (PPAR-g
agonist used to treat patients with type 2 diabetes) was associated with a significant increase in the
risk of myocardial infarction (Nissen and Wolski, 2007). These reports support the value of screen-
ing with deep learning and iPSC-CMs to detect early signs of cardiotoxicity.
Validation studies using deep learning and orthogonal assays
We further evaluated a subset of hits that showed cardiotoxic liabilities using deep learning analysis
but did not show a strong toxic liability using immunostaining image analysis (Figure 5—figure sup-
plement 2). This subset included six compounds that showed a cardiotoxic signal in iPSC-CMs: three
pre-clinical compounds (WZ8040 [EGFR inhibitor], BI-2536 [CDK inhibitor], and PHA-767491 [CDK
inhibitor]) and three FDA-approved compounds (danorubicin [DNA intercalator], nitrendipine [Ca2+-
channel blocker], and solifenacin [muscarinic receptor antagonist]). As a positive control, we also
included tegaserod (5-HT4 agonist), which was withdrawn from the market in 2007 due to adverse
cardiovascular effects (MayoClinic, 2020). With these seven compounds, we performed a secondary
round of validation using deep learning and additional orthogonal assays. This validation showed
that all seven compounds had cardiotoxic liability (Figure 6A and Figure 6—figure supplement
1A).
To further assess those seven validated compounds, we treated iPSC-CMs with the compounds
and measured their mitochondrial respiration 4 days later using the Seahorse XFe96 Analyzer. Based
on real-time OCR, all seven compounds dose-dependently reduced basal respiration in iPSC-CMs
(Figure 6B and Figure 6—figure supplement 1B), suggesting decreased respiratory function com-
pared to the DMSO control. To indirectly measure OCR, we treated iPSC-CMs with the compounds
and oligomycin (ATP synthase [complex V] inhibitor) and then measured their capacity to produce
adenosine triphosphate (ATP). Similarly, we found a dose-dependent decrease in the capacity of
iPSC-CMs to produce ATP. Finally, we measured whether these compounds affect the spare respira-
tory capacity (maximum OCR subtracted by basal OCR) in iPSC-CMs. The spare respiratory capacity
represents the cell’s ability to respond to an energetic stress. When compared to DMSO control, all
compounds resulted in a dose-dependent decrease in maximal respiration and spare respiratory
capacity (Figure 6C, D and Figure 6—figure supplement 1C). These data suggest that all seven
compounds dose-dependently impair mitochondrial bioenergetics. Thus, by analyzing mitochondrial
respiration, we validated the cardiotoxic compounds that were identified by deep learning but not
by immunostaining image analysis.
Grafton et al. eLife 2021;10:e68714. DOI: https://doi.org/10.7554/eLife.68714 16 of 28Research article Stem Cells and Regenerative Medicine
" Deep Learning Validation #
BI-2535 (1µM) WZ8040 (1µM)
0. O
M
M
M
S
3µ
0µ
0µ
M Tegaserod (1µM)
1.
3.
Daunorubicin (1µM)
D
!"#$%
2.0
Oxygen Comsumption Rate
Oxygen Comsumption Rate
WZ8040 800 Nitrendipine (1µM) 800 PHA-767491 (1µM)
1.5
1.0 Bortezomib (0.1µM) Solifenacin (1µM)
Daunorubicin
0.5 600 DMSO 600 DMSO
(pmol/min)
(pmol/min)
&"'(!"#$%
BI 2536 0
Cardiotoxicity Score
400 400
Nitrendipine
PHA-767491 200 200
Solifenacin
0 0
Tegaserod 0 20 40 60 80 0 20 40 60 80
Time (minutes) Time (minutes)
! Basal Respiration ATP Production Max Respiration Spare Respiratory Capacity
&"'(!"#$%
1. M
3. M
µM
0. O
SO
0. O
0. O
M
M
M
M
M
M
M
M
M
µ
µ
S
S
S
3µ
0µ
0µ
3µ
0µ
0µ
3µ
0µ
0µ
M
M
M
M
3
0
0
1.
3.
0.
1.
3.
1.
3.
D
D
D
D
125 125
600
WZ8040 100 100
400
75 75 400
Daunorubicin 50 50 200
200
25 25
!"#$%
BI 2536 0 0 0 0
OCR
OCR
OCR
OCR
Nitrendipine
PHA-767491
Solifenacin
Tegaserod
% $ ProBNP Levels
%&'()#*+,-.*&/(0+12-314
SO
M
M
M
!"#$
3µ
0µ
0µ
M
5(6()+ 1:9;. 7*689"(:9;.
WZ8040 1.5
!"#$%$ &$'$$$( &$'$$$( $'$()% $'$*+( 1.0
Daunorubicin
,-./01.2343/ $'$$$% $'$$$) &$'$$$( &$'$$$( 0.5
BI 2536 0
567)8+* &$'$$$( &$'$$$( &$'$$$( $'$$$) (DMSO Normalized)
Nitrendipine
ProBNP Level
93:1;?@AB*B%C( $'$$$# $'$$)* $'$$)B $'$$8%
Solifenacin
D0E3F;/-43/ &$'$$$( &$'$$$( $'$$B( $'$8%C
Tegaserod
G;H-I;10< $'$$$* &$'$$$( $')C*) $'8%)8
Figure 6. Hit validation using deep learning and orthogonal assay analysis. (A) Cardiotoxicity heatmap scores for validation of seven compounds: six
cardiotoxic hits from the primary screen and tegaserod (known to cause cardiotoxicity and withdrawn from the market). (B) Kinetic plots of oxygen
consumption rates for the seven compounds and bortezomib as another control. Kinetic data from only the 1 mM dose is plotted. Error bars = SD. (C)
Heatmaps for basal respiration, adenosine triphosphate (ATP) production, maximal respiration, and spare respiratory capacity. BI-2535, daunorubicin,
nitrendipine, and bortezomib had the largest effect on basal respiration, ATP production, and maximal respiration. The oxygen consumption rate (OCR)
Figure 6 continued on next page
Grafton et al. eLife 2021;10:e68714. DOI: https://doi.org/10.7554/eLife.68714 17 of 28Research article Stem Cells and Regenerative Medicine
Figure 6 continued
was measured as pmol/min/nuclear count. (D) All seven compounds show significantly different basal respiration and ATP production (one-way
ANOVA). All drugs, except tegaserod, show significantly different maximal respiration. SRC: spare respiratory capacity. (E) Heatmaps for ProBNP levels
show that PHA-767491 elevates ProBNP levels at all three doses. All other drugs showed no change or a slight decrease in ProBNP levels, suggesting
that ProBNP is the least-sensitive marker to assess cardiotoxicity and cellular stress.
The online version of this article includes the following source data and figure supplement(s) for figure 6:
Source data 1. Hit validation using deep learning and orthogonal assay analysis.
Figure supplement 1. Validation using deep learning and mitochondrial respiration.
ProBNP levels are not a reliable marker for detecting cardiotoxicity in
iPSC-CMs
BNP is natriuretic peptide and hormone secreted from cardiac tissue. During heart failure, BNP
secretions are elevated (Bay et al., 2003; Doust et al., 2006; Januzzi et al., 2005). BNP is also
expressed in iPSC-CMs, which secrete the hormone into their culture media.
We used a ProBNP ELISA kit as an orthogonal, follow-up assay on media collected from iPSC-
CMs treated with the seven validated cardiotoxic compounds and evaluated the levels of BNP. We
found an inconsistent pattern of ProBNP levels and cardiotoxicity signal in the media of treated cells.
Only PHA-767491 (at all three doses) elevated ProBNP. In contrast, WZ8040, daunorubicin, nitrendi-
pine, and solifenacin dose-dependently reduced ProBNP (Figure 6E). This reduction may be due to
poor health of iPSC-CMs after treatment with the cardiotoxic compounds. We found that BI-2536
did not alter the levels of ProBNP and that tegaserod only reduced BNP at the highest dose (3 mM)
(Figure 6E).
RNA-seq analysis confirms drug-specific changes in key pathways that
regulate cardiac muscle contraction, development, and identity
To delineate perturbed transcriptional profiles in iPSC-CMs treated with drugs, we performed RNA
sequencing on samples treated with our previously defined nine cardiotoxic compounds (two repli-
cates/drug) and DMSO-treated iPSC-CMs (six replicates). Using PCA, four drugs (bortezomib, dau-
norubicin, doxorubicin, and BI-2536) fell into three distinct clusters, whereas the other five drugs
(nitrendipine, PHA-767491, solifenacin, tegaserod, and WZ8040) clustered more closely with DMSO-
treated controls (Figure 7A). Based on hierarchical clustering on each sample’s projected location in
the PCA space with 23 components, we classified the transcriptomic profiles into four clusters (n =
24; cluster 1: bortezomib; cluster 2: doxorubicin and daunorubicin; cluster 3: BI-2536; cluster 4:
nitrendipine, PHA-767491, solifenacin, tegaserod, and WZ8040). We generated the heatmap in
Figure 7B by selecting the top overexpressed and underexpressed genes in each cluster that inter-
sected with a curated set of 310 genes with enriched expression in cardiac tissue. We did not see
any major difference in the clustering structure between these two methods. For simplicity, we show
the averaged PCA-based similarity matrix for each drug cluster in Figure 7B.
Bortezomib-treated cardiomyocytes showed significant downregulation of major genes encoding
structural proteins associated with different forms of familial cardiomyopathies (Haas et al., 2015).
For example, TCAP (regulates sarcomere assembly and titin assembly; implicated in familial hyper-
trophic cardiomyopathy), MYL3 (myosin light chain 3; implicated in left ventricular hypertrophic car-
diomyopathy and restrictive cardiomyopathy), LDB3, and DES were highly downregulated
(Figure 7C). Doxorubicin- and daunorubicin-treated clusters were identified by substantial downre-
gulation of ANKRD1 (associated with dilated cardiomyopathy), LMNA (Lamin A/C; known mutations
result in cardiomyopathy), as well as NKX2-5,and GATA4 (two transcription factors essential for car-
diac development and survival).
BI-2536-related cardiotoxicity in cluster 3 was associated with reduced expression of AGT (angio-
tensinogen; a critical component of the renin-angiotensin system), PRKCH (protein kinase C, eta; a
calcium-dependent serine/threonine protein kinase), and NFATC4 (a cardiac transcription factor
required for oxidative phosphorylation activity as well as cardiomyocyte proliferation and differentia-
tion) (Bushdid et al., 2003). The fourth cluster with the remaining five drugs (nitrendipine, PHA-
767491, solifenacin, tegaserod, and WZ8040) presented more subtle transcriptional changes, includ-
ing reduced expression of KCNE2 (potassium voltage-gated channel subfamily E regulatory subunit
Grafton et al. eLife 2021;10:e68714. DOI: https://doi.org/10.7554/eLife.68714 18 of 28You can also read