Adipocyte NR1D1 dictates adipose tissue expansion during obesity
←
→
Page content transcription
If your browser does not render page correctly, please read the page content below

RESEARCH ARTICLE

                                   Adipocyte NR1D1 dictates adipose tissue
                                   expansion during obesity
                                   Ann Louise Hunter1†, Charlotte E Pelekanou1†, Nichola J Barron1,
                                   Rebecca C Northeast1, Magdalena Grudzien1, Antony D Adamson1,
                                   Polly Downton1, Thomas Cornfield2, Peter S Cunningham1, Jean-Noel Billaud3,
                                   Leanne Hodson2, Andrew SI Loudon1, Richard D Unwin4, Mudassar Iqbal5,
                                   David W Ray2, David A Bechtold1*
                                   1
                                    Centre for Biological Timing, Faculty of Biology, Medicine and Health, University of
                                   Manchester, Manchester, United Kingdom; 2Oxford Centre for Diabetes,
                                   Endocrinology and Metabolism, University of Oxford, and NIHR Oxford Biomedical
                                   Research Centre, John Radcliffe Hospital, Oxford, United Kingdom; 3Digital
                                   Insights, Qiagen, Redwood City, United States; 4Stoller Biomarker Discovery
                                   Centre, Division of Cancer Sciences, Faculty of Biology, Medicine and Health,
                                   University of Manchester, Manchester, United Kingdom; 5Division of Informatics,
                                   Imaging and Data Sciences, Faculty of Biology, Medicine and Health, University of
                                   Manchester, Manchester, United Kingdom

                                   Abstract The circadian clock component NR1D1 (REVERBa) is considered a dominant regulator
                                   of lipid metabolism, with global Nr1d1 deletion driving dysregulation of white adipose tissue (WAT)
                                   lipogenesis and obesity. However, a similar phenotype is not observed under adipocyte-selective
                                   deletion (Nr1d1Flox2-6:AdipoqCre), and transcriptional profiling demonstrates that, under basal
                                   conditions, direct targets of NR1D1 regulation are limited, and include the circadian clock and
*For correspondence:
                                   collagen dynamics. Under high-fat diet (HFD) feeding, Nr1d1Flox2-6:AdipoqCre mice do manifest
david.bechtold@manchester.ac.uk
                                   profound obesity, yet without the accompanying WAT inflammation and fibrosis exhibited by
†
 These authors contributed         controls. Integration of the WAT NR1D1 cistrome with differential gene expression reveals broad
equally to this work               control of metabolic processes by NR1D1 which is unmasked in the obese state. Adipocyte NR1D1
Competing interest: See            does not drive an anticipatory daily rhythm in WAT lipogenesis, but rather modulates WAT activity
page 20                            in response to alterations in metabolic state. Importantly, NR1D1 action in adipocytes is critical to
                                   the development of obesity-related WAT pathology and insulin resistance.
Funding: See page 20
Received: 22 September 2020
Preprinted: 25 September 2020
Accepted: 30 July 2021
Published: 05 August 2021          Introduction
                                   The mammalian circadian clock directs rhythms in behaviour and physiology to coordinate our biol-
Reviewing editor: Peter
                                   ogy with predictable changes in food availability and daily alternations between fasted and fed
Tontonoz, University of
California, Los Angeles, United
                                   states. In this way, profound cycles in nutrient availability and internal energy state can be managed
States                             across multiple organ systems. A central circadian clock in the suprachiasmatic nuclei (SCN) drives
                                   daily rhythms in our behaviour (e.g. sleep/wake cycles) and physiology (e.g. body temperature), and
   Copyright Hunter et al. This
                                   orchestrates rhythmic processes in tissue systems across the body (Dibner et al., 2010; West and
article is distributed under the
                                   Bechtold, 2015). The molecular clock mechanism is also present in most cell types. The rhythmic
terms of the Creative Commons
Attribution License, which         transcriptome that defines cells and tissues is shaped by both local tissue clock activity and input
permits unrestricted use and       from the central clock and rhythmic systemic signals (Guo et al., 2005; Hughes et al., 2012;
redistribution provided that the   Kornmann et al., 2007; Koronowski et al., 2019; Lamia et al., 2008; Hunter et al., 2020). The rel-
original author and source are     ative importance of these intrinsic and systemic factors remains ill-defined. Mounting evidence sug-
credited.                          gests that systemic signalling (e.g. SCN and/or behaviour-driven rhythmicity) is highly dominant in

Hunter, Pelekanou, et al. eLife 2021;10:e63324. DOI: https://doi.org/10.7554/eLife.63324                                          1 of 26
Research article                                                                                          Cell Biology Medicine

                                   setting daily rhythms, while local clocks serve to buffer tissue/cell responses based on time of day.
                                   Nevertheless, it is clear that our rhythmic physiology and metabolic status reflects the interaction of
                                   clocks across the brain and body (West and Bechtold, 2015). Disturbance of this interaction, as
                                   occurs with shift work and irregular eating patterns, is increasingly recognised as a risk factor for
                                   metabolic disease and obesity (Broussard and Van Cauter, 2016; Kim et al., 2020).
                                       Extensive work over the past 20 years has demonstrated that circadian clock function and its com-
                                   ponent factors are closely tied into energy metabolism (Bass and Takahashi, 2010; Reinke and
                                   Asher, 2019), with strong rhythmicity evident in cellular and systemic metabolic processes. Clock-
                                   metabolic coupling in peripheral tissues is adaptable, as demonstrated by classical food-entrainment
                                   studies (Damiola et al., 2000; Mistlberger, 1994), and by recent work showing that systemic pertur-
                                   bations such as cancer and high-fat diet (HFD) feeding can reprogramme circadian control over liver
                                   metabolism (Dyar et al., 2018; Masri et al., 2016). Plasticity therefore exists within the system, and
                                   the role of the clock in tissue and systemic responses to acute and chronic metabolic perturbation
                                   remains a critical question. The nuclear receptor NR1D1 (REVERBa) is a core clock component, and
                                   has been highlighted as a key link between the clock and metabolism. NR1D1 is a constitutive
                                   repressor, with peak expression in the latter half of the inactive phase (daytime in the nocturnal ani-
                                   mal). In liver, NR1D1 exerts repressive control over programmes of lipogenesis by recruiting the
                                   NCOR/HDAC3 co-repressor complex to metabolic target genes, such that global loss of NR1D1 or
                                   liver-specific deletion of HDAC3 results in hepatosteatosis (Feng et al., 2011; Zhang et al., 2015);
                                   (Zhang et al., 2016). Importantly, we recently showed that NR1D1 regulation of hepatic metabolism
                                   is state-dependent, with minimal impact under basal conditions yet increased transcriptional influ-
                                   ence in response to mistimed feeding (Hunter et al., 2020). The selective functions of NR1D1 in
                                   white adipose tissue (WAT) are not well established and remain poorly understood. Early studies
                                   implicated an essential role of Nr1d1 in adipocyte differentiation (Chawla and Lazar,
                                   1993; Kumar et al., 2010); however, these findings are difficult to align with in vivo evidence.
                                   Indeed, pronounced adiposity and adipocyte hypertrophy are evident in Nr1d1-/- mice, even under
                                   normal feeding conditions (Delezie et al., 2012; Hand et al., 2015); (Zhang et al., 2015). Daily
                                   administration of NR1D1 agonists has also been shown to reduce fat mass and WAT lipogenic gene
                                   expression in mice (Solt et al., 2012), although these agents do have significant off-target actions
                                   (Dierickx et al., 2019). Given the links between circadian disruption and obesity, and the potential
                                   of NR1D1 as a pharmacological target, we now define the role of NR1D1 in dictating WAT
                                   metabolism.
                                       Transcriptomic and proteomic profiling of WAT in global Nr1d1-/- mice revealed an expected de-
                                   repression of lipid synthesis and storage programmes. However, in contrast, selective deletion of
                                   Nr1d1 in adipocytes did not result in dysregulation of WAT metabolic pathways. Loss of NR1D1
                                   activity in WAT did, however, significantly enhance adipose tissue expansion in response to HFD
                                   feeding; yet despite exaggerated obesity, adipocyte-specific knockout (KO) mice were spared the
                                   anticipated obesity-related pathology. Integration of transcriptomic data with the WAT NR1D1 cis-
                                   trome demonstrates that, under basal conditions, NR1D1 activity is limited to a small set of direct
                                   target genes (enriched for extracellular matrix [ECM] processes). However, NR1D1 regulatory control
                                   broadens to include lipid and mitochondrial metabolism pathways under conditions of obesity. Our
                                   data recast the role of NR1D1 as a regulator responsive to the metabolic state of the tissue, rather
                                   than one which delivers an anticipatory daily oscillation to the WAT metabolic programme.

                                   Results
                                   Adiposity and up-regulation of WAT lipogenic pathways in Nr1d1-/-
                                   mice
                                   We first examined the body composition of age-matched Nr1d1 global KO (Nr1d1-/-) mice and litter-
                                   mate controls (wild type [WT]). In keeping with previous reports (Delezie et al., 2012; Hand et al.,
                                   2015), Nr1d1-/- mice are of similar body weight to littermate controls (Figure 1A), yet carry an
                                   increased proportion of fat mass (KO: 24.2 ± 3.0% of body weight; WT: 10.8 ± 1.4%; mean ± SEM,
                                   p
Research article                                                                                                                                                       Cell Biology Medicine

     A                                           WT       Nr1d1-/- (KO)                                                             B
                                    50                                  20        **                            35           **
                  Body weight (g)

                                                                                              Lean weight (g)
                                                                                                                30

                                                       Fat weight (g)
                                    40                                  15
                                                                                                                25
                                    30                                  10                                      20
                                    20                                  5                                       15
                                                                                                                                             WT                                           KO
                                     0                                  0                                       0
                                          WT    KO                           WT        KO                               WT    KO

     C                                                                                      D                                           Number of proteins        E
                   3                                                                                                                         0     20   40   60                     2.0
                                                                                                                                                                                             **                     0.6
                                                                                                                                                                                                                              *

                                                                                                                                                                  Molecular ratio

                                                                                                                                                                                                  Molecular ratio
    -Log10(FDR)

                                                                                                                              Metabolism                                            1.5
                   2                                                                                                                                                                                                0.4
                                                                                                                 Fatty acid metabolism
                                                                                            Metabolism of carbohydrates                                                             1.0
                   1
                                                                                                                     Biological oxidations                                                                          0.2
                                                                                                                                                                                    0.5
                                                                                                                     Glucose metabolism
                   0
                                                                                                                                                                                    0.0                             0.0
                                          -1            0                       1                                                            0 2 4 6 8 10                                 C16:0 /                         C16:1n-7 /
                                               Log2(FC KO vs WT)                                                                                 -Log10(Padj)                             C18:2n-6                         C16:0

Figure 1. Global deletion of Nr1d1 results in obesity and increased adipose lipid synthesis. (A) Nr1d1-/- mice exhibit significantly greater fat mass
relative to wild-type (WT) littermate controls. Body weight, fat mass, and lean mass of 13-week-old males (n=12–14/group). (B) Increased fat mass in
Nr1d1-/- mice is reflected in adipocyte hypertrophy in gonadal white adipose tissue (gWAT) (representative 10 H and E images shown). (C, D) gWAT
from Nr1d1-/- mice exhibits a programme of increased lipid synthesis. Proteomic profiling of gWAT depots (Nr1d1-/- mice plotted relative to their
respective weight-matched littermate controls, n=6/group (C)) shows deregulation of metabolic regulators and enrichment (D) of metabolic pathways
(up- and down-regulated proteins shown in blue and red, respectively). Top five (by protein count) significantly enriched Reactome terms shown. (E)
Analyses of fatty acid (FA) composition reveal increased de novo lipogenesis (reflected by C16:0/C18:2 n ratio) and FA desaturation (reflected by C16:1
n-7/C16:0 ratio) in gWAT of Nr1d1-/-. n=6/group. Data presented as mean with individual data points (A, E). *p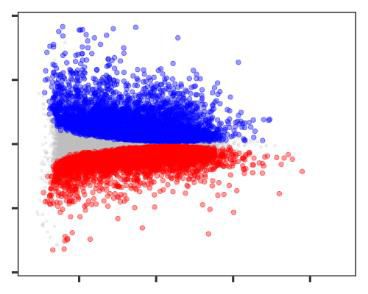
Research article Cell Biology Medicine
validate this putative increase in local lipid synthesis, we quantified fatty acid species in gWAT, and
indeed, the ratio of palmitic to linoleic acid (C16:0/C18:2n6), a marker of de novo lipogenesis, was
significantly elevated in Nr1d1-/- samples (Figure 1E, Figure 1—figure supplement 1G). Fatty acid
profiling also revealed evidence of increased SCD1 activity (C16:1 n-7/C16:0). Enhanced fatty acid
synthesis in gWAT of mice lacking NR1D1 may be in part driven by increased glucose availability
and adipose tissue uptake as previously suggested (Delezie et al., 2012), although we do not
observe elevated blood glucose levels in the Nr1d1-/- animals (Figure 1—figure supplement 1H).
The propensity to lipid storage is further highlighted by the substantial obesity, compared to litter-
mate controls, displayed by Nr1d1-/- mice when challenged with 10 weeks of HFD (Figure 1—figure
supplement 1I; Delezie et al., 2012; Hand et al., 2015). Interestingly, we observed a strong posi-
tive correlation between body weight and daily intake of HFD in the Nr1d1-/- mice (Figure 1—figure
supplement 1J), suggesting that HFD-induced hyperphagia exacerbates weight gain and obesity in
the Nr1d1-/- mice.
Limited impact of adipocyte-selective Nr1d1 deletion under basal
conditions
To define the role of NR1D1 specifically within WAT, we generated a new mouse line with loxP sites
flanking Nr1d1 exons 2–6 (Nr1d1Flox2-6), competent for Cre-mediated conditional deletion
(Hunter et al., 2020). We crossed this mouse with the well-established adiponectin Cre-driver line
(AdipoCre; Eguchi et al., 2011; Jeffery et al., 2014) to delete Nr1d1 selectively in adipocytes. This
A Nr1d1 Arntl B Cre -ve
C 40 4 30
Cre+ve
1.5 15
Lean weight (g)
Body weight (g)
Relative expression
Relative expression
** ** ** **
Fat weight (g)
28
35 3
26
1.0 10 REVα
30 2
(75 kDa) 24
25 1 22
0.5 5
0 0 0
0.0 0
e
e
e
e
e
e
+v
+v
+v
-v
-v
-v
gWAT BAT Liver Lung gWAT BAT Liver Lung
re
re
re
re
re
re
C
C
C
C
C
C
D E F
Average food intake (g)
** **
Body temperature ( C)
4 ** 0.8 100 39 **
**
Daily activity (%)
** **
3
** 0.6
80 38 Nr1d1Flox2-6 (Cre-ve)
Kcal/hr
60
2 0.4 37 Nr1d1Flox2-6:AdipoqCre (Cre+ve)
40
1 0.2 20 36
0 0.0 0 35
Day Night Day Night Day Night Day Night
Figure 2. Impact of adipose Nr1d1 deletion is limited under normal conditions. (A) Nr1d1 and Arntl (Bmal1) gene expression in gonadal white adipose
tissue (gWAT), brown adipose (BAT), liver and lung in Nr1d1Flox2-6 (Cre-ve), and Nr1d1Flox2-6:AdipoqCre (Cre+ve) mice (n=4–5/group). (B) NR1D1 protein
expression (arrowhead) in Cre-ve and targeted Cre+ve mice. Lower blot shows Ponceau S protein staining. (C) Body weight, fat mass, and lean mass in
13-week-old Cre-ve and Cre+ve male mice (n=7/group). (D–F) Both Nr1d1Flox2-6:AdipoqCre Cre+ve and Cre-ve mice demonstrate diurnal rhythms in
behaviour and physiology, with no genotype differences observed in food intake (D), energy expenditure and daily activity (E) or body temperature (F)
in 13-week-old males (n=4–7/group). Data presented as mean ± SEM (A) or as mean with individual data points (C–F). *p
Research article Cell Biology Medicine
new line results in loss of Nr1d1 mRNA (Figure 2A) and protein (Figure 2B) expression in adipose
tissue depots, as well as coordinate de-repression of Arntl (Bmal1), upon Cre-mediated recombina-
tion. In marked contrast to global Nr1d1-/- mice, adult Nr1d1Flox2-6:AdipoqCre mice did not show an
increase in adiposity when maintained on a standard chow diet (Figure 2C; n=7/group), with no dif-
ferences in mean body weight, fat, and lean mass observed. In parallel with this, we saw no differen-
ces in daily patterns of food intake, energy expenditure, activity levels, or body temperature in
matched Nr1d1Flox2-6:AdipoqCre and control (Nr1d1Flox2-6) mice (Figure 2D–F). As brown adipose
Up-regulated Down-regulated
Number of genes Number of genes
A B 0 200 400 600 0 50 100150200
Log2(FC KO vs W T)
10 Nr1d1-/-
Metabolism Metabolism of lipids
5
IL1 signalling Met. amino acids
0 Antigen presentation Met. carbohydrates
HIF1A hydroxylation TCA cycle
-5
Up: 2577 Neddylation ODC regulation
-10 Down: 1586
0 5 10 15 0 5 10 15 0 2 4 6 8 10
Average Log2(CPM) -Log10(Padj) -Log10(Padj)
Number of genes
C D E
Log2(FC Cre+ vs Cre-)
10 Nr1d1Flox2-6:AdipoqCre 0 2 4 6 8
Nr1d1Flox2-6:
5 AdipoqCre Assembly of collagen fibrils
Collagen chain trimerisation
0 Collagen formation
105 126 4037
-5 Collagen degradation
Up: 128 Collagen biosynthesis
-10 Down: 103
0 5 10 15 Nr1d1-/- 0 1 2 3 4
Average Log2(CPM) -Log10(Padj)
F Nr1d1Flox2-6:AdipoqCre Nr1d1-/- G Nr1d1Flox2-6:AdipoqCre Nr1d1-/-
Relative expression
Relative expression
Relative expression
6 6 2 15
** *
4 4 ** **
**
10
** *
** ** ** 1
2 ** 2 *
* 5 *
** * **
** *
0 0 0 0
4
4
C a1
C 3
C a1
C a2
3
C a1
C a3
C 1
C a2
3
El d36
El d36
C s3
F vl6
C s3
F vl6
dx
dx
M pl
M pl
Pl e1
Pl e1
6p n
Scin2
6p n
Scin2
d1
d1
Acaca
Acaca
xl
xl
5a
6a
6a
6a
G as
G as
L
L
1
6
6
1
5
6
Lo
Lo
s
s
o
o
ol
ol
ol
ol
ol
ol
ol
ol
ol
ol
Ac
Ac
C
C
Figure 3. Global or adipose-specific Nr1d1 deletion produces distinctive gene expression profiles. (A, B) Nr1d1-/- gonadal white adipose tissue (gWAT)
demonstrates extensive remodelling of the transcriptome and up-regulation of metabolic pathways. Mean difference (MD) plot (A) showing significantly
(FDR
Research article                                                                                          Cell Biology Medicine

                                   tissue (BAT) makes an important contribution to whole body energy metabolism, we studied thermo-
                                   regulation in Nr1d1Flox2-6:AdipoqCre mice in greater detail. It has previously been proposed that
                                   NR1D1 is key in conferring circadian control over thermogenesis, through its repression of uncou-
                                   pling protein 1 (UCP1) expression (Gerhart-Hines et al., 2013). However, we saw no evidence of
                                   genotype differences in thermoregulation between Nr1d1Flox2-6:AdipoqCre and Nr1d1Flox2-6 mice
                                   (Figure 2—figure supplement 1A–E). Despite increased BAT UCP1 expression in the Cre+ve mice,
                                   no differences in body temperature profiles were observed between Cre-ve and Cre+ve mice when
                                   housed under normal laboratory temperature (22˚C) nor when placed under thermoneutral condi-
                                   tions (29˚C) for >14 days. Moreover, Cre-ve and Cre+ve mice did not differ in their thermogenic
                                   response to an acute cold challenge (4˚C for 6 hr) (Figure 2—figure supplement 1F–H). These data
                                   support our overall findings that adipocyte-selective deletion of Nr1d1 does not have a significant
                                   impact on metabolic phenotype under normal chow (NC) feeding conditions. Together, our data
                                   also suggest that the lack of adiposity phenotype in the Cre+ve mice is not driven by an increase in
                                   locomotor activity, energy expenditure, or thermogenesis.

                                   In normal WAT, NR1D1 regulated targets are limited to clock and
                                   collagen genes
                                   To investigate adipocyte-specific Nr1d1 activity, we performed RNA-seq at ZT8 (n=6/group) in both
                                   Nr1d1-/- and Nr1d1Flox2-6:AdipoqCre mouse lines. Global Nr1d1 deletion had a large effect on the
                                   gWAT transcriptome, with 4163 genes showing significant differential expression (FDR¡0.05)
                                   between Nr1d1-/- mice and age- and weight-matched WT littermate controls (Figure 3A). Pathway
                                   enrichment analysis demonstrated that these changes are dominated by metabolic genes
                                   (Figure 3B), with lipid metabolism and the TCA cycle emerging as prominent processes (Figure 3B).
                                   Thus, the gWAT transcriptome in Nr1d1-/- mice is concordant with the phenotype, and the gWAT
                                   proteome, in demonstrating up-regulation of lipid accumulation and storage processes. By contrast,
                                   and consistent with the absence of an overt phenotype, only a small genotype effect on the tran-
                                   scriptome was observed when comparing gWAT RNA-seq from Nr1d1Flox2-6:AdipoqCre and
                                   Nr1d1Flox2-6 littermates (Figure 3C; n=6/group). Here, 231 genes showed significant differential
                                   expression between genotypes, of which 126 were also differentially regulated in the WAT analysis
                                   of global Nr1d1-/- mice (Figure 3D). These 126 common genes included circadian clock components
                                   (Arntl, Clock, Cry2, Nfil3), whilst pathway analysis also revealed collagen formation/biosynthesis pro-
                                   cesses to be significantly enriched (Figure 3E). Regulation of the molecular clock is expected, but
                                   the discovery of collagen dynamics as a target of NR1D1 regulatory action in adipocytes has not
                                   been previously recognised. We validated consistent up-regulation of collagen and collagen-modify-
                                   ing genes in Nr1d1-/- and Nr1d1Flox2-6:AdipoqCre gWAT by qPCR (Figure 3F). It is notable that
                                   Nr1d1Flox2-6:AdipoqCre mouse gWAT exhibits neither enrichment of lipid metabolic pathways nor
                                   de-regulation of individual key lipogenic genes, previously identified as NR1D1 targets (Figure 3E,
                                   G; Feng et al., 2011; Zhang et al., 2015; Zhang et al., 2016). These findings suggest that lipogenic
                                   gene regulation may be a response to system-wide changes in energy metabolism in the Nr1d1-/-
                                   animals and challenge current understanding of NR1D1 action. These findings parallel our recent
                                   observations in hepatocyte-selective deletion of Nr1d1 (Hunter et al., 2020).
                                      Work in liver has suggested that the NR1D1 paralogue, NR1D2 (REVERBb), contributes to the
                                   suppression of lipogenesis, and that concurrent NR1D2 deletion amplifies the impact of NR1D1 loss
                                   (Bugge et al., 2012). We therefore performed double knockdown of Nr1d1 and Nr1d2 in differenti-
                                   ated 3T3-L1 cells (Figure 3—figure supplement 1A). Whilst double knockdown produced greater
                                   Arntl de-repression than either Nr1d1 or Nr1d2 knockdown alone, it did not lead to de-repression
                                   of lipogenic genes previously considered NR1D1 targets (Figure 3—figure supplement 1B). We
                                   observed a similar pattern when comparing the liver transcriptome of liver-specific Nr1d1/Nr1d2
                                   dual-deletion mice with that of global Nr1d1-/- KO; double knockdown produces a greater effect
                                   than loss of Nr1d1 alone, but does not lead to de-repression of metabolic genes (Hunter et al.,
                                   2020). Moreover, any potential compensation by NR1D2 does not prevent adipose lipid accumula-
                                   tion in the global Nr1d1-/- mice. Thus, although it cannot be ruled out, these findings suggest that
                                   compensation by NR1D2 does not underlie the mild phenotype observed in the Nr1d1Flox2-6:Adi-
                                   poqCre mice.
                                      Therefore, whilst global NR1D1 targeting produces an adiposity phenotype with up-regulation of
                                   WAT lipogenesis and lipid storage, this is not seen when NR1D1 is selectively targeted in adipose

Hunter, Pelekanou, et al. eLife 2021;10:e63324. DOI: https://doi.org/10.7554/eLife.63324                                           6 of 26
Research article                                                                                          Cell Biology Medicine

                                   alone. The distinction is not due to loss of Nr1d1 expression in brown adipose, and is not due to
                                   compensatory NR1D2 action. Taken together, our data suggest that under a basal metabolic state,
                                   the adipose transcriptional targets under direct NR1D1 control are in fact limited to core clock func-
                                   tion and collagen dynamics. NR1D1 is not a major repressor of lipid metabolism in this setting. This
                                   also suggests that the enhanced lipid accumulation phenotype of Nr1d1-/- adipose tissue is either
                                   independent from adipose NR1D1 entirely or that the action of NR1D1 in adipose is context-
                                   dependent.

                                   Diet-induced obesity reveals a broader WAT phenotype in tissue-
                                   specific NR1D1 deletion
                                   Studies in liver tissue have demonstrated reprogramming of both nuclear receptor and circadian
                                   clock factor activity by metabolic challenge (Eckel-Mahan et al., 2013; Goldstein et al.,
                                   2017; Guan et al., 2018; Quagliarini et al., 2019). Both our data here, and previous reports
                                   (Delezie et al., 2012; Feng et al., 2011; Hand et al., 2015; Le Martelot et al.,
                                   2009; Preitner et al., 2002), highlight that the NC-fed Nr1d1-/- mouse is metabolically abnormal.
                                   The emergence of the collagen dynamics as a direct NR1D1 target and exaggerated diet-induced
                                   obesity evident in Nr1d1-/- mice supports a role for NR1D1 in regulating adipose tissue expansion
                                   under obesogenic conditions. To test this, Nr1d1Flox2-6:AdipoqCre and Nr1d1Flox2-6 mice were pro-
                                   vided with HFD for 16 weeks to drive obesity and WAT expansion. Indeed, compared to their con-
                                   trols, Nr1d1Flox2-6:AdipoqCre mice exhibited greater weight gain and adiposity in response to HFD
                                   feeding (Figure 4A,B). Of note, divergence between control and Nr1d1Flox2-6:AdipoqCre mice
                                   became clear only after long-term HFD feeding (beyond 13 weeks), a time at which body weight
                                   gain plateaus in control mice. This contrasts substantially with Nr1d1-/- mice, which show rapid and
                                   profound weight gain from the start of HFD feeding (Hand et al., 2015). The stark difference in pro-
                                   gression and severity of diet-induced obesity is likely due (at least in part) to the HFD-induced hyper-
                                   phagia, which is observed in Nr1d1-/- mice (WT food intake 2.92±0.10 g HFD/day/mouse; KO
                                   3.74±0.21 g, p=0.0014, Student’s t-test, n=21/genotype), but not in Nr1d1Flox2-6:AdipoqCre mice
                                   (Cre-ve 2.99±0.61 g HFD/day/mouse; Cre+ve 3.01±0.60 g, p>0.05, n=8/genotype). Nevertheless,
                                   both models highlight that loss of NR1D1 increases capacity for increased lipid storage and adipose
                                   tissue expansion under obesogenic conditions. Despite the enhanced diet-induced obesity, HFD-fed
                                   Nr1d1Flox2-6:AdipoqCre mice showed little evidence of typical obesity-related pathology. Histological
                                   assessment of gWAT after 16 weeks of HFD feeding revealed widespread adipose tissue fibrosis
                                   (Picrosirius Red staining of collagen deposition under normal and polarised light) and macrophage
                                   infiltration (F4/80 immunohistochemistry) in obese control mice, but these features were not seen in
                                   Nr1d1Flox2-6:AdipoqCre mice (Figure 4C,D). Furthermore, we saw evidence of preserved insulin sensi-
                                   tivity in the HFD-fed Nr1d1Flox2-6:AdipoqCre mice, with neither circulating glucose nor insulin being
                                   higher than Nr1d1Flox2-6 littermate controls (Figure 4E), despite carrying significantly greater fat
                                   mass. Indeed, on insulin tolerance testing, HFD-fed Nr1d1Flox2-6:AdipoqCre mice demonstrated a sig-
                                   nificantly greater hypoglycaemic response than that observed in HFD-fed controls (Figure 4F). We
                                   saw no differences in adipocyte size between the two genotypes, indicating that our observations
                                   did not simply reflect greater adipocyte hypertrophy in the Nr1d1Flox2-6:AdipoqCre mice (Figure 4—
                                   figure supplement 1A). In line with a pronounced increase in fat mass, both gWAT and inguinal
                                   white adipose tissue depots (iWAT) were substantially larger in obese Nr1d1Flox2-6:AdipoqCre mice
                                   than in obese Nr1d1Flox2-6 controls (Figure 4—figure supplement 1B).
                                       Therefore, under long-term HFD-feeding conditions, adipose-targeted Nr1d1 deletion results in
                                   continued adipose tissue expansion accompanied by a healthier metabolic phenotype with reduced
                                   adipose inflammation and fibrosis, and preserved systemic insulin sensitivity. Importantly, these find-
                                   ings also suggest that the regulatory influence of NR1D1 is context-dependent, with the metabolic
                                   impact of adipose-targeted Nr1d1 deletion revealed by transition to an obese state.

                                   NR1D1-dependent gene regulation is reprogrammed by obesity
                                   We next performed RNA-seq on gWAT collected at ZT8 from Nr1d1Flox2-6:AdipoqCre and
                                   Nr1d1Flox2-6 littermate controls fed either NC or HFD for 16 weeks (NC, n=4/group; HFD, n=6/
                                   group). As expected, HFD feeding had a substantial impact on the gWAT transcriptome in both Cre-
                                   ve
                                      and Cre+ve animals (i.e. NC vs. HFD comparison within each genotype; Figure 5A). Under NC

Hunter, Pelekanou, et al. eLife 2021;10:e63324. DOI: https://doi.org/10.7554/eLife.63324                                            7 of 26
Research article Cell Biology Medicine
A c c
b b c
c B
b
b b a
a a
80
** 40
** 40
b a
60 b a a
Body weight (g)
Body weight (g)
Lean weight (g)
b 70 35 Nr1d1Flox2-6
Fat weight (g)
b a
b a
50 b a a
60 30
a
a 30 Nr1d1Flox2-6:
40 50
20 25 AdipoqCre
40
30 30 20
10
0 0 0 0
0 2 4 6 8 10 12 14 16 Cre-ve Cre+ve Cre-ve Cre+ve Cre-ve Cre+ve
Weeks on diet
normal chow (NC) high-fat diet (HFD)
C D
Cre-ve Cre+ve Cre-ve Cre+ve 4 **
Picros.Red % area
Picrosirius Red
3
brightfield
2
1
0
NC HFD
Red polarised
Picrosirius
4 **
F4/80 IHC %area
3
2
F4/80 IHC
1
0
NC HFD
(mmol/L)
E F Time (min)
ITT, area under curve
20 80 P=0.07 2 1500 *
Glucose (mmol/L)
60 120 180
Insulin (ng/mL)
60 0
15
-2 1000
Blood glucose
10 40
-4
500
5 20 -6
0 0 -8 0
NC HFD NC HFD Cre-ve Cre+ve
Figure 4. Diet-induced obesity unmasks a role for NR1D1 in the regulation of adipose expansion. (A, B) High-fat diet (HFD) leads to exaggerated
adiposity in Nr1d1Flox2-6:AdipoqCre mice. Body weight track of Cre-ve and Cre+ve male mice on HFD (solid line) or normal chow (NC) (dashed line) (A)
(ap
Research article                                                                                           Cell Biology Medicine

Figure 4 continued
The online version of this article includes the following source data and figure supplement(s) for figure 4:
Source data 1. Source data (Picrosirius Red images, one per animal) for Figure 4, panel C.
Figure supplement 1. Adipose characteristics in Nr1d1Flox2-6 and Nr1d1Flox2-6:AdipoqCre mice.

                                      feeding conditions, we again observed only a small genotype effect on the transcriptome, and as
                                      before, DE genes included core clock genes (Arntl, Nfil3, Npas2, Clock) and those of collagen syn-
                                      thesis pathways (Figure 5B). However, obesity revealed a substantial genotype effect, with 3061
                                      genes DE (1706 up, 1355 down) in HFD-fed Nr1d1Flox2-6:AdipoqCre mice vs. HFD-fed Nr1d1Flox2-6
                                      controls (Figure 5B), and 1704 genes showing a significant (a
Research article Cell Biology Medicine
A HFD vs Normal Chow B Cre+ve vs Cre-ve C Diet-Genotype Interaction
Nr1d1Flox2-6 Normal Chow Number of genes
Log2(FC Cre+ vs Cre-)
Log2(FC HFD vs NC)
8 8 Up-regulated in Cre+ve under HFD:
0 50 100 150
4 4 Metabolism
Protein localisation
0 0
TCA cycle
-4 -4 Peroxisomal protein import
Up: 4222 Up: 80
Down: 4380 Down: 58 Phase II conjugation
-8 -8
0 5 10 15 0 5 10 15 0 5 10 15
Nr1d1Flox2-6:AdipoqCre HFD -Log10(Padj)
Log2(FC Cre+ vs Cre-)
Log2(FC HFD vs NC)
8 8 Number of genes
Down-regulated in Cre+ve under HFD:
4 4 0 5 10 15 20
Extracellular matrix organisation
0 0
Nonsense mediated decay
-4 -4 SRP-dependent targeting
Up: 3389 Up: 1706
-8 Down: 2949 -8 Down: 1355 40S subunit pool formation
0 5 10 15 0 5 10 15 GTP hydrolysis
Average Log2(CPM) Average Log2(CPM)
0 1 2 3 4
-Log10(Padj)
D Genes Up-Regulated by HFD Genes Down-Regulated by HFD
(within genotype comparison) (within genotype comparison)
Cre-ve Cre+ve Cre-ve Cre+ve
Immune System Metabolism
Innate Immune System TCA cycle and respiratory e- transport
Neutrophil degranulation Respiratory electron transport, ATP synthesis
Adaptive Immune System Respiratory electron transport
Cytokine Signalling in immune system Pyruvate metabolism and the TCA cycle
Cell Cycle Mitochondrial translation
Cell Cycle, Mitotic Mitochondrial translation termination
Cell Cycle Checkpoints Mitochonidral translation elongation
rRNA processing Mitochondrial Fatty Acid Beta-Oxidation
Major pathway of rRNA processing Complex I biogenesis
Metabolism of RNA Citric acid cycle (TCA cycle)
rRNA processing in nucleus and cytosol Metabolism of amino acids and derivatives
-Log10(Padj)
-Log10(Padj)
Haemostasis Fatty acid metabolism
Platelet activation, signalling, aggregation Metabolism of vitamins and cofactors
Vesicle-mediated transport Phase II – Conjugation of compounds
Membrane Trafficking Glutathione conjugation
Signalling by Receptor Tyrosine Kinases Metabolism of water-soluble vitamins
Signalling by RHO GTPases Protein localisation
RHO GTPase effectors Peroxisomal protein import
Extracellular matrix organisation Integration of energy metabolism
Figure 5. Under conditions of obesity, a broader programme of NR1D1 repression is seen. (A) High-fat diet (HFD) dramatically remodels the white
adipose tissue (WAT) transcriptome. RNA-seq (n=4–6/group) was performed in gonadal WAT (gWAT) from Cre-ve and Cre+ve male mice fed normal
chow (NC) or HFD for 16 weeks. Mean difference (MD) plots show genes significantly (FDRResearch article Cell Biology Medicine
Figure 5 continued
The online version of this article includes the following source data for figure 5:
Source data 1. Source data (lists of differentially expressed genes, pathway lists) for Figure 5, panels A–D, plus IPA.
strongly suggests that this gene cluster (clock and collagen genes) represents direct targets of
NR1D1 repression in WAT under NC conditions. In contrast, no enrichment of genes with decreased
expression in Nr1d1Flox2-6:AdipoqCre or Nr1d1-/- WAT was evident at any distance from NR1D1
peaks (Figure 6B). Thus, NR1D1 activation of transcription involves a different mechanism of regula-
tion, likely involving secondary or indirect mechanisms (e.g. de-repression of another repressor), as
previously proposed to explain NR1D1 transactivation (Le Martelot et al., 2009).
HFD -feeding of Nr1d1Flox2-6:AdipoqCre mice greatly increased the overlap of DE genes with
those DE in Nr1d1-/- WAT (Figure 6C). Critically, we observed a highly significant proximity enrich-
ment of these commonly up-regulated genes (863) to sites of NR1D1 chromatin binding (Figure 6C,
D), but again, saw no enrichment of the commonly down-regulated genes (Figure 6C). Thus, this
integration of transcriptome and cistrome profiling suggests that these commonly up-regulated
genes represent direct NR1D1 targets unmasked by the abnormal environment of obese adipose,
and that NR1D1’s exertion of direct repressive control is dependent on metabolic state.
Consistent with the healthier metabolic phenotype observed in obese Nr1d1Flox2-6:AdipoqCre
mice, we found that the large majority of the 863 NR1D1 gene targets unmasked by HFD feeding
are normally repressed in obesity (Figure 6E), with 551 (63.8%) showing a significant down-regula-
tion in obese control (Cre-ve) animals (chronic HFD compared to NC-fed state). Furthermore, 495 of
these genes were found to lie within 100 kbp of a NR1D1 binding site (Figure 6E). These genes
include important regulators of lipid and mitochondrial metabolism (Figure 6F) – including Fasn,
Scd1, Acsl1, Cs – and FGF-21 co-receptor Klb, a previously identified NR1D1 target gene
(Jager et al., 2016). Importantly, obesity-dependent de-repression of these genes was also
observed in isolated mature adipocytes (MA) collected from NC or HFD-fed mice (Figure 6—figure
supplement 1C,D). This provides further evidence that they are regulated by adipocyte NR1D1, and
that this regulation is direct.
Considered together, these findings suggest that the healthy adiposity phenotype in HFD-fed
Nr1d1Flox2-6:AdipoqCre mice results from de-repression of NR1D1-controlled adipocyte pathways
which allow continued and efficient lipid synthesis and storage, thus permitting greater expansion of
the adipose bed, and attenuation of obesity-related dysfunction.
Discussion
We set out to define the role of NR1D1 in the regulation of WAT metabolism and subsequently
reveal a new understanding of NR1D1 function. Together, our data show NR1D1 to be a state-
dependent regulator of WAT metabolism, with its widespread repressive action only unmasked by
diet-induced obesity. Surprisingly, Nr1d1 expression in WAT appears to limit the energy-buffering
function of the tissue. This finding parallels our recent work in the liver (Hunter et al., 2020).
Hepatic-selective loss of NR1D1 carries no metabolic consequence, with NR1D1-dependent control
over hepatic energy metabolism revealed only upon altered feeding conditions. Contrary to current
understanding, our findings therefore suggest that NR1D1 (and potentially other components of the
peripheral clock) does not impose rhythmic repression of metabolic circuits under basal conditions
but rather determines tissue responses to altered metabolic state. As reported previously by us and
others (Delezie et al., 2012; Hand et al., 2015), global deletion of Nr1d1 leads to an increase in
lipogenesis, adipose tissue expansion, and an exaggerated response to diet-induced obesity. How
the loss of NR1D1 specifically in WAT contributes to this phenotype has not previously been
addressed. Here, we use proteomic, transcriptomic, and lipid profiling studies to show a clear bias
towards fatty acid synthesis and triglyceride storage within Nr1d1-/- WAT. Adipocyte-targeted dele-
tion of Nr1d1 reveals only a modest phenotype, and a relatively selective set of gene targets, limited
to clock processes and collagen dynamics. These genes are concurrently de-regulated in Nr1d1-/-
adipose, and are found in proximity to NR1D1 binding sites, strongly implicating them as direct tar-
gets of NR1D1 repressive activity.
Hunter, Pelekanou, et al. eLife 2021;10:e63324. DOI: https://doi.org/10.7554/eLife.63324 11 of 26Research article Cell Biology Medicine
A ZT8 Halo ZT8 WT ZT20 Halo
B Up-regulated genes Down-regulated genes
Normal
6 Enrichment of gene TSSs
chow
4 4 7 4 h i g h c o n fi d e n c e p e a k s
within expansion of
HaloNR1D1 signal intensity
24 34 1552 NR1D1 peaks by λ.
23 57 2520
λ λ
Nr1d1Flox2-6: Nr1d1-/-
AdipoqCre
enrichment)
-Log10 (P
57 up
34 down Klb
0
-2.5kbp peak peak peak +2.5kbp
centre centre centre
Peak-TSS distance (λ) (bp)
C Up-regulated genes Down-regulated genes D chr15 chr 8 chr11
105 114 75
HFD HaloNr1d1 ZT8
263
1714 1323
863
105 114 75
843
1092 HaloNr1d1 ZT8
Nr1d1Flox2-6:
Nr1d1-/-
AdipoqCre
105 114 75
WT ZT8
enrichment)
-Log10 (P
863 up
105 114 75
263 down
HaloNr1d1 ZT20
Peak-TSS distance (λ) (bp) Pnpla5 Acsl1 Fasn
E HFD Cre-ve vs NC Cre-ve F
8
-Log10(FDR)
6
4
2
0
-5 0 5
Log2(FC HFD vs NC)
NR1D1-regulated genes
NR1D1-regulated genes within
100kbp of a NR1D1 peak
Figure 6. NR1D1 binding sites associate with genes of lipid and mitochondrial metabolism normally repressed in obese adipose. (A) Calling peaks
against both wild-type (WT) ZT8 (zeitgeber time, 8 hr after lights on) and HaloNr1d1 ZT20 samples detects 4474 high-confidence regions of HaloNR1D1
binding in gonadal white adipose tissue (gWAT). (B, C) Genes commonly up-regulated in normal chow (NC)-fed Nr1d1Flox2-6:AdipoqCre and Nr1d1-/-
gWAT (compared to littermate controls) are significantly enriched in proximity to HaloNR1D1 ChIP-seq peaks (B), as too are genes commonly up-
regulated in high-fat diet (HFD)-fed Nr1d1Flox2-6:AdipoqCre and Nr1d1-/- gWAT (C). Genes commonly down-regulated are not. Venn diagrams show
intersection of up- and down-regulated genes in the two models of Nr1d1 deletion. Plots shows enrichment (over all genes in the genome) of gene
clusters of interest at increasing distances (l) from HaloNR1D1 peaks. Up-regulated genes in blue, down-regulated in red. (D) Integrative Genomics
Viewer (IGV) visualisations show HaloNR1D1 peaks in proximity to exemplar genes only up-regulated by Nr1d1 deletion in obese adipose. Uniform
y-axes within each panel. (E) NR1D1 targets are also down-regulated in obesity. Volcano plot highlighting effect of HFD (in intact (Cre-ve) animals) of the
863 NR1D1 target genes from (C). NR1D1 target genes shown in purple; 495 NR1D1 target genes also within 100 kbp of a HaloNR1D1 peak outlined in
Figure 6 continued on next page
Hunter, Pelekanou, et al. eLife 2021;10:e63324. DOI: https://doi.org/10.7554/eLife.63324 12 of 26Research article Cell Biology Medicine
Figure 6 continued
black. (F) Metabolic map illustrating NR1D1 targets. Genes with a transcription start site (TSS) within 100 kbp of a HaloNR1D1 ChIP-seq peak are
starred*. Source data for panels A–C available in Figure 6—source data 1.
The online version of this article includes the following source data and figure supplement(s) for figure 6:
Source data 1. Source data (peak list, gene lists underlying Venn diagrams) for Figure 6, panels A–C.
Figure supplement 1. NR1D1 binding sites and gene expression changes in Nr1d1Flox2-6:AdipoqCre mature adipocytes.
The reduced inflammation seen in obese Nr1d1Flox2-6:AdipoqCre mice is likely multifactorial, but
may be secondary to a reduction in the pro-inflammatory free fatty acid pool, resulting from de-
repression of lipogenic and mitochondrial metabolism pathways, or the absence of signals from
dead/dying adipocytes. It is of note that improved metabolic flexibility is beneficial in other mouse
models of metabolic disease (Jonker et al., 2012; Kim et al., 2007; Virtue et al., 2018) and in
human obesity (Aucouturier et al., 2011; Begaye et al., 2020). Whilst the clock has been linked to
ECM remodelling in other tissues (Chang et al., 2020; Dudek et al., 2016; Sherratt et al., 2019),
where it is thought to coordinate ECM dynamics, collagen turnover, and secretory processes
(Chang et al., 2020), we now identify ECM as a direct target of adipose NR1D1 action; altered regu-
lation of WAT collagen production and modification likely contributing to the rapid and continued
adipose tissue expansion observed in Nr1d1-targeted adipose. The diminished adipose fibrosis seen
in Nr1d1Flox2-6:AdipoqCre mice may well reflect alteration in multiple processes, some of which may
be under direct/indirect NR1D1 control. Adipose-specific deletion of Nr1d1 thus provides a unique
model to explore the complex ECM responses which accompany obesity-related tissue hypertrophy
and development of fibrosis.
A role for the clock in the regulation of WAT function has been reported in the literature
(Barnea et al., 2015; Paschos et al., 2012; Shostak et al., 2013), perhaps implying that it is the
rhythmicity conferred by the clock which is important for WAT metabolism. However, despite robust
rhythms of clock genes persisting, rhythmic gene expression in gWAT is largely attenuated following
genetic disruption of SCN function (Kolbe et al., 2016). This supports the alternative notion that an
intact local clock is not the primary driver of rhythmic peripheral tissue metabolism. Indeed, meta-
bolic processes, including lipid biosynthesis, were highly enriched in the cohort of SCN-dependent
rhythmic genes from this study (Kolbe et al., 2016), implying that feeding behaviour and WAT
responses to energy flux are more important than locally generated rhythmicity for adipose function.
The modest impact of adipose-selective Nr1d1 deletion is both at odds with the large effect of
global Nr1d1 deletion, and with the extensive WAT cistrome we have identified for NR1D1. This
suggests that the tissue-specific actions of NR1D1 are necessary, but not sufficient, and require addi-
tional regulation from the metabolic state. Although not explored to the same extent, a lipogenic
phenotype of liver-specific RORa/g deletion has previously been shown to be unmasked by
HFD feeding (Zhang et al., 2017). By driving adipose tissue hypertrophy through HFD feeding of
the Nr1d1Flox2-6:AdipoqCre, we observed a stark difference in the adipose phenotype of targeted
mice and littermate controls. WAT tissue lacking Nr1d1 showed significantly increased tissue expan-
sion, but little evidence of normal obesity-related pathology (tissue fibrosis and immune cell infiltra-
tion/inflammation). Genes controlling mitochondrial activity, lipogenesis, and lipid storage were
relatively spared from the obesity-related down-regulation observed in control mouse tissue, and
were associated with the WAT NR1D1 cistrome. Thus, in response to HFD feeding, NR1D1 acts to
repress metabolic activity in the adipocyte and limit tissue expansion (albeit at the eventual cost of
tissue dysfunction, inflammation, and development of adipose fibrosis).
The broadening of NR1D1’s regulatory influence in response to obesity likely reflects a change to
the chromatin environment in which NR1D1 operates (Figure 6—figure supplement 1E). The major-
ity of emergent NR1D1 target genes are repressed in obese adipose when Nr1d1 expression is
intact (Figure 6E). As these genes are not de-repressed by Nr1d1 loss in normal adipose, NR1D1
activity must be redundant or ineffective in a ‘basal’ metabolic state. Subsequent emergence of
NR1D1’s transcriptional control may reflect alterations in chromatin accessibility or organisation,
and/or the presence of transcriptional repressors and accessory factors required for full activity. As
NR1D1 is itself proposed to regulate enhancer-promoter loop formation (Kim et al., 2018), modula-
tion of Nr1d1 expression would be a further important variable here. Such reshaping of the
Hunter, Pelekanou, et al. eLife 2021;10:e63324. DOI: https://doi.org/10.7554/eLife.63324 13 of 26Research article Cell Biology Medicine
regulatory landscape likely occurs across tissues, and may explain why, with metabolic challenge,
emergent circadian rhythmicity is observed in gene expression (Eckel-Mahan et al.,
2013; Kinouchi et al., 2018; Tognini et al., 2017), and in circulating and tissue metabolites
(Dyar et al., 2018; Eckel-Mahan et al., 2013).
Here, we now uncover a role for NR1D1 in limiting the energy-buffering role of WAT, a discovery
which may present therapeutic opportunity as we cope with an epidemic of human obesity. Despite
recent findings which have cast doubt on the utility of some of the small molecule NR1D1 ligands
(Dierickx et al., 2019), antagonising WAT NR1D1 now emerges as a potential target in metabolic
disease. Finally, our study suggests that a functioning circadian clock may be beneficial in coping
with acute mistimed metabolic cues but, that under chronic energy excess, may contribute to meta-
bolic dysfunction and obesity-related pathology.
Materials and methods
Animal experiments
All experiments described here were conducted in accordance with local requirements and licenced
under the UK Animals (Scientific Procedures) Act 1986, project licence number 70/8558 (DAB). Pro-
cedures were approved by the University of Manchester Animal Welfare and Ethical Review Body
(AWERB). Unless otherwise specified, all animals had ad libitum access to standard laboratory chow
and water, and were group-housed on 12 hr:12 hr light:dark cycles and ambient temperature of
22±1.5˚C. Unless otherwise stated, male mice (Mus musculus) were used for all experimental proce-
dures. All proteomics studies were carried out on 13-week-old weight-matched males. RNA-seq
studies for Figure 3 were carried out on 12- to 14-week-old weight-matched males; the RNA-seq
study for Figure 5 was carried out on 28-week-old males (following 16 weeks of HFD or NC feeding).
HaloChIP-seq was carried out on males aged 12–21 weeks.
For group allocation, we employed a timed breeding approach, so that cohorts of mice were pro-
duced within a narrow time window. All studies compared littermate control and transgenic mice,
which inherently confers group allocation and randomisation in cage housing (and thus diet regime).
The n numbers, and overall experimental design, were determined on the basis of extensive experi-
ence with the models, and power analyses incorporating previous results (based on achieving 80%
power with 5% type I error). Blinding was facilitated by animal numbering, numbered coding of sam-
ples at collection, and use of automated analyses where possible.
Nr1d1-/-
Nr1d1-/- mice were originally generated by Ueli Schibler (University of Geneva) (Preitner et al.,
2002). These mice were created by replacing exons 2–5 of the Nr1d1 gene by an in-frame LacZ
allele. Mice were then imported to the University of Manchester and backcrossed to C57BL/6J mice.
Nr1d1Flox2-6
A CRISPR-Cas9 approach was used to generate a conditional knock allele for Nr1d1 -, as described
(Hunter et al., 2020). LoxP sites were integrated, in a two-step process, at intron 2 and intron 6, tak-
ing care to avoid any previously described transcriptional regulatory sites (Yamamoto et al., 2004).
A founder animal with successful integration of both the 5’ and 3’ loxP sites, transmitting to the
germline, was identified and bred forward to establish a colony.
Nr1d1Flox2-6:AdipoqCre
Adiponectin-driven Cre-recombinase mice (Eguchi et al., 2011; Jeffery et al., 2014) were pur-
chased from the Jackson Laboratory and subsequently bred against the Nr1d1Flox2-6at the University
of Manchester.
HaloNr1d1
HaloNr1d1 mice were generated by the University of Manchester Genome Editing Unit, as described
(Hunter et al., 2020).
Hunter, Pelekanou, et al. eLife 2021;10:e63324. DOI: https://doi.org/10.7554/eLife.63324 14 of 26Research article Cell Biology Medicine
In vivo phenotyping
Body composition of mice was analysed prior to cull by quantitative magnetic resonance (EchoMRI
900). Energy expenditure was measured via indirect calorimetry using CLAMS (Columbus Instru-
ments) for 10- to 12-week-old male mice. Mice were allowed to acclimatise to the cages for 2 days,
prior to an average of 5 days of recordings being collected. Recording of body temperature and
activity was carried out via surgically implanted radiotelemetry devices (TA-F10, Data Sciences Inter-
national). Data is shown as a representative day average of single-housed age-matched males. For
the diet challenge, male mice were fed HFD (60% energy from fat; DIO Rodent Purified Diet, IPS
Ltd) for a period of 10–16 weeks from 12 weeks of age. Blood glucose was measured from tail blood
using the Aviva Accuchek meter (Roche). For the insulin tolerance test, mice were fasted from ZT0,
then injected with 0.75 IU/kg human recombinant insulin (I2643, Sigma-Aldrich) at ZT6 (time ‘0 min’).
Insulin ELISA
Insulin concentrations were measured by ELISA (EZRMI-13K Rat/Mouse insulin ELISA, Merck Milli-
pore) according to the manufacturer’s instructions. Samples were diluted in matrix solution to fall
within the range of the assay. Internal controls supplied with the kit were run alongside the samples
and were in the expected range.
Histology
gWAT was collected and immediately fixed in 4% paraformaldehyde for 24 hr, transferred into 70%
ethanol, and processed using a Leica ASP300 S tissue processor; 5 mm sections underwent H and E
staining (Alcoholic Eosin Y solution [HT110116] and Harris Haematoxylin solution [HHS16], Sigma-
Aldrich), Picrosirius Red staining (see below), or F4/80 immunohistochemistry (see below). Images
were collected on an Olympus BX63 upright microscope using 10/0.40 UPlan SAPo and 20/0.75
UApo/340 objectives. Percentage area stained was quantified using ImageJ (version 1.52a) as
detailed in the online ImageJ documentation, with 5–12 images quantified per animal. Adipocyte
area was quantified using the Adiposoft ImageJ plug-in (version 1.16).
For Picrosirius Red staining, sections were dewaxed and rehydrated using the Leica ST5010
Autostainer XL. Sections were washed in distilled water and then transferred to Picrosirius Red
(Direct Red 80, Sigma-Aldrich) (without the counterstain) for 1 hr. Sections were then washed briefly
in 1% acetic acid. Sections were then dehydrated, cleared, and mounted using the Leica ST5010
Autostainer XL.
For F4/80 immunohistochemistry, sections were dewaxed and rehydrated prior to enzymatic anti-
gen retrieval (trypsin from porcine pancreas [T7168, Sigma]). Sections were treated with 3% hydro-
gen peroxide to block endogenous peroxidase activity followed by further blocking with 5% goat
serum. Rat mAb to F4/80 (1:500) (ab6640, Abcam) was added and sections were incubated over-
night at 4˚C. Sections were washed before addition of the biotinylated anti-rat IgG (BA-9400, H and
L) secondary antibody (1:1500) for 1 hr. Sections were developed using VECTAstain Elite ABC kit
peroxidase, followed by DAB Peroxidase substrate (Vector Labs) and counterstained with haematox-
ylin. Slides were then dehydrated, cleared, and mounted.
Lipid extraction and gas chromatography
Total lipid was extracted from tissue lysates using chloroform-methanol (2:1; v/v) according to the
Folch method (Folch et al., 1957). An internal standard (tripentadecanoin glycerol [15:0]) of known
concentration was added to samples for quantification of total triacylglyceride. Lipid fractions were
separated by solid-phase extraction and fatty acid methyl esters (FAMEs) were prepared as previ-
ously described (Heath et al., 2003). Separation and detection of total triglyceride FAMEs was
achieved using a 6890N Network GC System (Agilent Technologies, Santa Clara, CA) with flame ion-
isation detection. FAMEs were identified by their retention times compared to a standard containing
31 known fatty acids and quantified in micromolar from the peak area based on their molecular
weight. The micromolar quantities were then totalled and each fatty acid was expressed as a per-
centage of this value (molar percentage, mol%).
Hunter, Pelekanou, et al. eLife 2021;10:e63324. DOI: https://doi.org/10.7554/eLife.63324 15 of 26Research article Cell Biology Medicine
Proteomics
Mice were culled by cervical dislocation and the gWAT was immediately removed and washed twice
in ice-cold PBS and then once in ice-cold 0.25 M sucrose, prior to samples being snap-frozen in liq-
uid nitrogen and stored at 80˚C. To extract the protein, the samples were briefly defrosted on ice
and then cut into 50 mg pieces and washed again in ice-cold PBS. The sample was then lysed in 200
ml of 1 M triethylammonium bicarbonate buffer (Sigma) with 0.1% (w/v) sodium dodecyl sulphate
with a Tissue Ruptor (Qiagen). Samples were centrifuged for 5 min, full speed, at 4˚C and the super-
natant collected into a clean tube. A Bio-Rad Protein Assay (Bio-Rad) was used to quantify the pro-
tein and Coomassie protein stain (InstantBlue Protein Stain Instant Blue, Expedeon) to check the
quality of extraction. Full methods of subsequent iTRAQ proteomic analysis including bioinformatic
analysis has been published previously (Kassab et al., 2019; Xu et al., 2019). Here, the raw data
was searched against the mouse Swissprot database (release October 2017) using the paragon algo-
rithm on Protein-Pilot (version 5.0.1, AB SCIEX). A total of 33,847 proteins were searched. As
described (Xu et al., 2019), Bayesian protein-level differential quantification was performed by
Andrew Dowsey (University of Bristol) using their own BayesProt (version 1.0.0), with default choice
of priors and MCMC settings. Expression fold change relative to the control groups was determined
and proteins with a global false discovery rate ofResearch article Cell Biology Medicine
RNA extraction (cells)
RNA was extracted from cells using the ReliaPrep RNA Cell Miniprep system (Promega UK), follow-
ing manufacturer’s instructions. RNA concentration and quality was determined with the use of a
NanoDrop spectrophotometer and then stored at 80˚C.
RNA extraction (tissue)
Frozen adipose tissue was homogenised in TRIzol Reagent (Invitrogen) using Lysing Matrix D tubes
(MP Biomedicals) and total RNA extracted according to the manufacturer’s TRIzol protocol. To
remove excess lipid, samples underwent an additional centrifugation (full speed, 5 min, room tem-
perature) prior to chloroform addition. For the RNA sequencing samples, the isopropanol phase of
TRIzol extraction was transferred to Reliaprep tissue Miniprep kit (Promega, Madison, WI) columns
to ensure high-quality RNA samples were used. The column was then washed, DNAse treated, and
RNA eluted as per protocol. RNA concentration and quality was determined with the use of a Nano-
Drop spectrophotometer and then stored at 80˚C. For RNA-seq, RNA was diluted to 1000 ng in
nuclease-free water to a final volume of 20 ml.
RNA extraction (adipose fractions)
MA and SVF were suspended in TRIzol Reagent (Invitrogen), and pipetted up and down to ensure
cells were fully lysed. To remove excess lipid from MA fractions, samples were centrifuged (full
speed, 5 min, room temperature) prior to chloroform addition. RNA extraction was then carried out
as per the manufacturer’s TRIzol protocol, up to the stage of removing the isopropranol phase,
which was transferred to Reliaprep columns (Promega) for on-column DNase treatment, clean-up,
and elution as per manufacturer’s protocol.
RT-qPCR
For RT-qPCR, samples were DNase-treated (RQ1 RNase-Free DNase, Promega, Madison, WI) prior
to cDNA conversion High Capacity RNA-to-cDNA kit (Applied Biosystems). qPCR was performed
using a GoTaq qPCR Master Mix (Promega, Madison, WI) and primers listed in Appendix Adipocyte
NR1D1 dictates adipose tissue expansion during obesity using a Step One Plus (Applied Biosystems)
qPCR machine. Relative quantities of gene expression were determined using the [delta][delta] Ct
method and normalised with the use of a geometric mean of the housekeeping genes Hprt, Ppib,
and Actb (housekeeping gene Ppia used for Figure 4—figure supplement 1B,D, Figure 6—figure
supplement 1D). The fold difference of expression was calculated relative to the values of control
groups.
RNA-seq
Adipose tissue was collected from adult male mice (n=6–8/group) at ZT8 and flash-frozen. Total
RNA was extracted and DNase-treated as described above. Biological replicates were taken forward
individually to library preparation and sequencing. For library preparation, total RNA was submitted
to the Genomic Technologies Core Facility (GTCF). Quality and integrity of the RNA samples were
assessed using a 2200 TapeStation (Agilent Technologies) and then libraries generated using the
TruSeq Stranded mRNA assay (Illumina, Inc) according to the manufacturer’s protocol. Briefly, total
RNA (0.1–4 mg) was used as input material from which polyadenylated mRNA was purified using
poly-T, oligo-attached, magnetic beads. The mRNA was then fragmented using divalent cations
under elevated temperature and then reverse-transcribed into first strand cDNA using random pri-
mers. Second strand cDNA was then synthesised using DNA Polymerase I and RNase H. Following a
single ‘A’ base addition, adapters were ligated to the cDNA fragments, and the products then puri-
fied and enriched by PCR to create the final cDNA library. Adapter indices were used to multiplex
libraries, which were pooled prior to cluster generation using a cBot instrument. The loaded flow cell
was then paired-end sequenced (76 + 76 cycles, plus indices) on an Illumina HiSeq4000 instrument.
Finally, the output data was demultiplexed (allowing one mismatch) and BCL-to-Fastq conversion
performed using Illumina’s bcl2fastq software, version 2.17.1.14.
Hunter, Pelekanou, et al. eLife 2021;10:e63324. DOI: https://doi.org/10.7554/eLife.63324 17 of 26Research article Cell Biology Medicine
RNA-seq data processing and differential gene expression analysis
Paired-end RNA-seq reads were quality-assessed using FastQC (version 0.11.3), FastQ Screen (ver-
sion 0.9.2) (Wingett and Andrews, 2018). Reads were processed with Trimmomatic (version 0.36)
(Bolger et al., 2014) to remove any remaining sequencing adapters and poor quality bases. RNA-
seq reads were then mapped against the reference genome (mm10) using STAR (version 2.5.3a)
(Dobin et al., 2013). Counts per gene (exons) were calculated by STAR using the genome annota-
tion from GENCODEM16. Differential expression analysis was then performed with edgeR
(Robinson et al., 2010) using QLF tests based on published code (Chen et al., 2016). Changes
were considered significant if they reached an FDR cut-off ofYou can also read