Estimation of COVID-19 Impact in Virginia
←
→
Page content transcription
If your browser does not render page correctly, please read the page content below
Network Systems
  Science & Advanced
           Computing
                           Estimation of
Biocomplexity Institute
           & Initiative
                           COVID-19 Impact
  University of Virginia   in Virginia
                           March 30th , 2022
                           (data current to March 26th – March 29th)
                           Biocomplexity Institute Technical report: TR 2022-021

                              biocomplexity.virginia.edu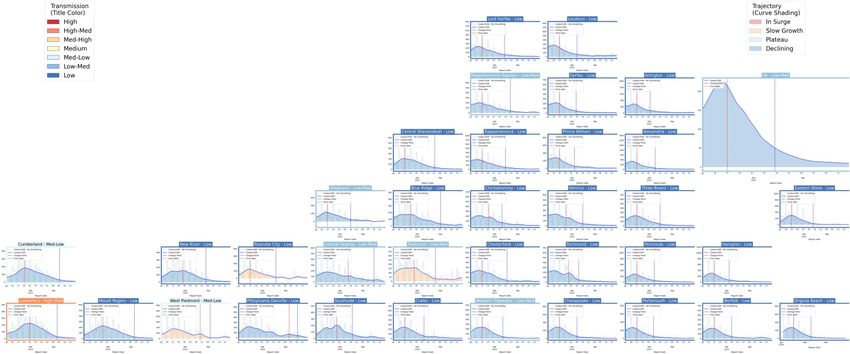
About Us
• Biocomplexity Institute at the University of Virginia
       • Using big data and simulations to understand massively
         interactive systems and solve societal problems
• Over 20 years of crafting and analyzing infectious
  disease models
       • Pandemic response for Influenza, Ebola, Zika, and others

Points of Contact

Bryan Lewis                             Model Development, Outbreak Analytics, and Delivery Team
brylew@virginia.edu                     Przemyslaw Porebski, Joseph Outten, Brian Klahn, Alex Telionis,
Srini Venkatramanan                               Srinivasan Venkatramanan, Bryan Lewis,
srini@virginia.edu              Aniruddha Adiga, Hannah Baek, Chris Barrett, Jiangzhuo Chen, Patrick Corbett,
Madhav Marathe                    Stephen Eubank, Galen Harrison, Ben Hurt, Dustin Machi, Achla Marathe,
marathe@virginia.edu        Madhav Marathe, Mark Orr, Akhil Peddireddy, Erin Raymond, James Schlitt, Anil Vullikanti,
Chris Barrett                      Lijing Wang, James Walke, Andrew Warren, Amanda Wilson, Dawen Xie
ChrisBarrett@virginia.edu

   31-Mar-22                                                                                                   2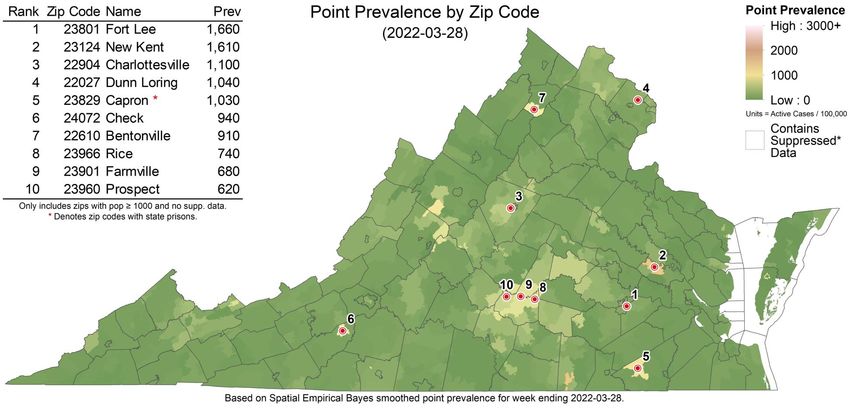
Overview
• Goal: Understand impact of COVID-19 mitigations in Virginia
• Approach:
    • Calibrate explanatory mechanistic model to observed cases
    • Project based on scenarios for next 4 months
    • Consider a range of possible mitigation effects in "what-if" scenarios
• Outcomes:
    • Ill, Confirmed, Hospitalized, ICU, Ventilated, Death
    • Geographic spread over time, case counts, healthcare burdens

 31-Mar-22                                                                     3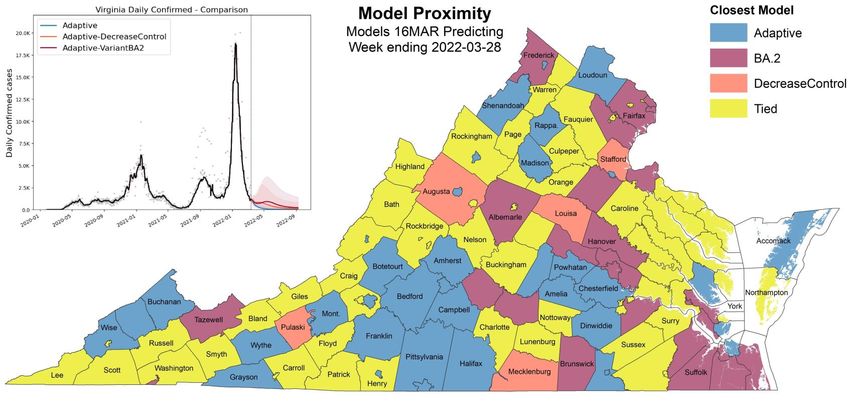
Key Takeaways
Projecting future cases precisely is impossible and unnecessary.
Even without perfect projections, we can confidently draw conclusions:
• Case rates and hospitalizations are starting to plateau

• VA 7-day mean daily case rate slowly decreased to 8/100K from 10/100K
     • US has plateaued to 9/100K (from 9/100K)

• BA.2 subvariant of Omicron approaches 50% prevalence and continues to grow
• Projections anticipate a plateau at moderate to low levels, though growth from BA.2 or other factors is possible:
     • Future levels and resilience to new variants and reduced infection control measures depend on the strength of immunity gained through infection
       with Omicron and its durability against waning

• Model updates:
     • Adjusted ascertainment levels during Omicron to better capture degraded case detection and reduced symptomatic fraction of Omicron
     • Further calibration of model parameters to match recent data on population immunity post-Omicron wave continue and will provide better long-
       term estimates of future disease dynamics

The situation continues to change. Models continue to be updated regularly.

  31-Mar-22                                                                                                                                4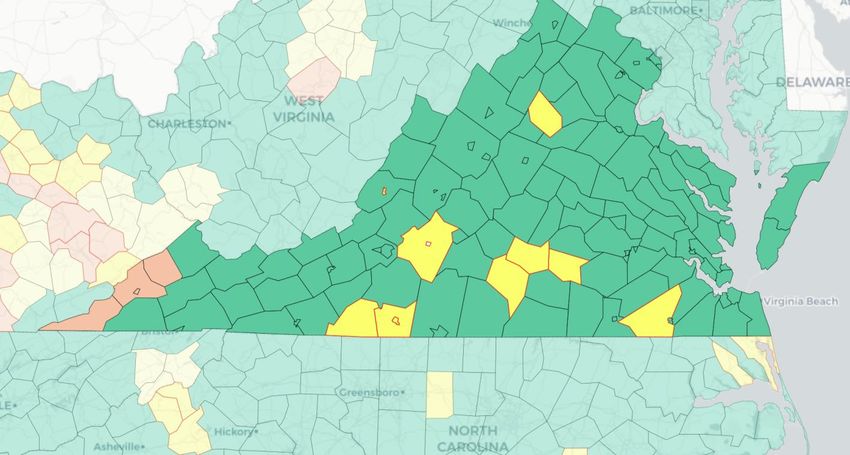
Situation Assessment

31-Mar-22                          5
Data source: https://data.cms.gov/covid-19/covid-19-nursing-home-data

Case Rates (per 100k) and Test Positivity

                                            County level RT-PCR test positivity
                                            Green: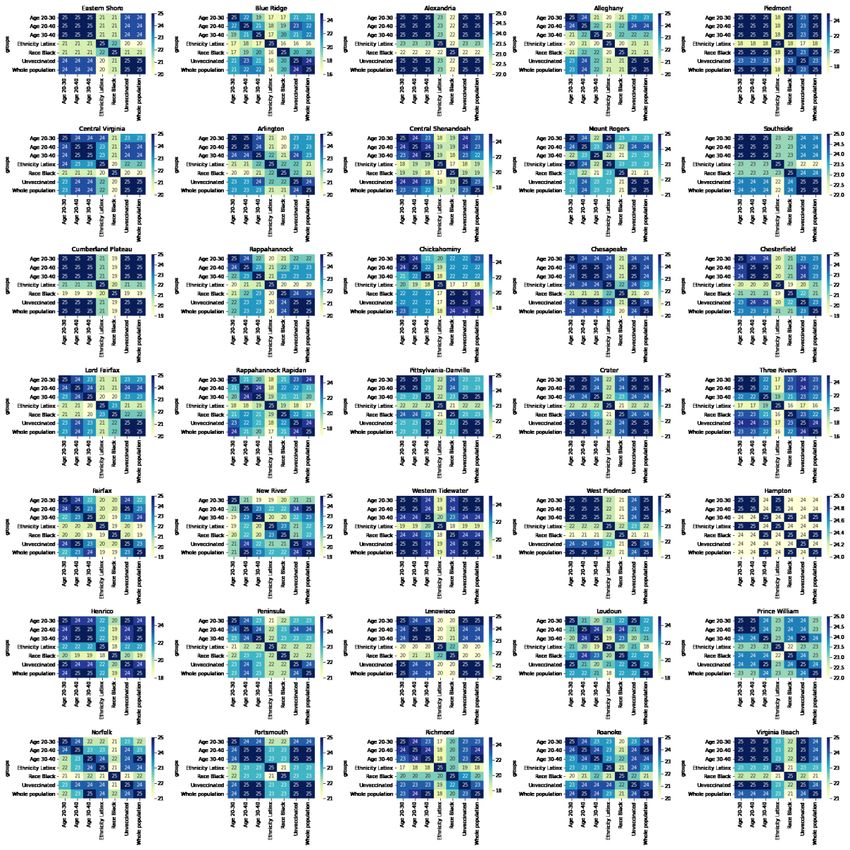
District Trajectories                                                               Hockey stick fit

 Goal: Define epochs of a Health District’s COVID-19 incidence
 to characterize the current trajectory
 Method: Find recent peak and use hockey stick fit to find
 inflection point afterwards, then use this period’s slope to
 define the trajectory

                                                                       Weekly Case Rate            # Districts
Trajectory      Description
                                                                       (per 100K) bounds          (prev week)
Declining       Sustained decreases following a recent peak                below -0.9                   32 (31)
Plateau         Steady level with minimal trend up or down           above -0.9 and below 0.5            0 (1)
                Sustained growth not rapid enough to be considered
Slow Growth     a Surge
                                                                     above 0.5 and below 2.5             3 (3)
                Currently experiencing sustained rapid and
In Surge        significant growth
                                                                          2.5 or greater                 0 (0)

   31-Mar-22                                                                                                     7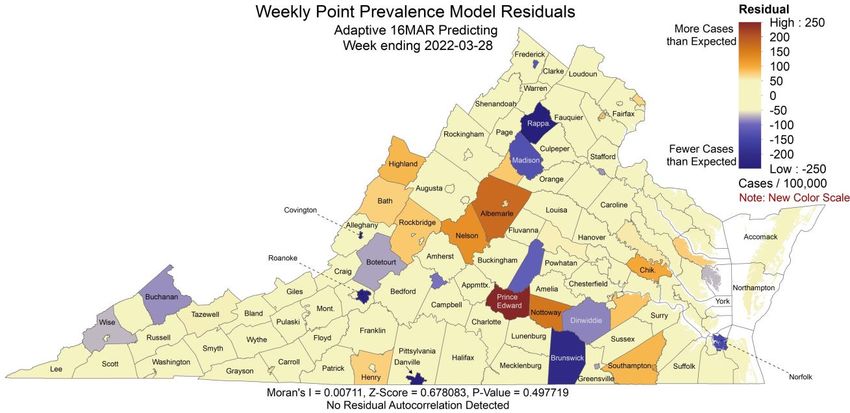
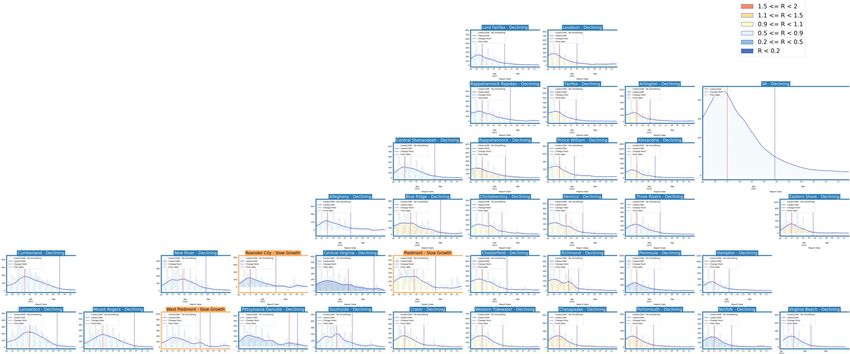
District Trajectories – last 10 weeks
                          # Districts
     Status
                         (prev week)
     Declining              32 (31)
     Plateau                 0 (1)
     Slow Growth             3 (3)
     In Surge                 0 (0)
Curve shows smoothed case rate (per 100K)
Trajectories of states in label & chart box
Case Rate curve colored by Reproductive
number

      31-Mar-22                               8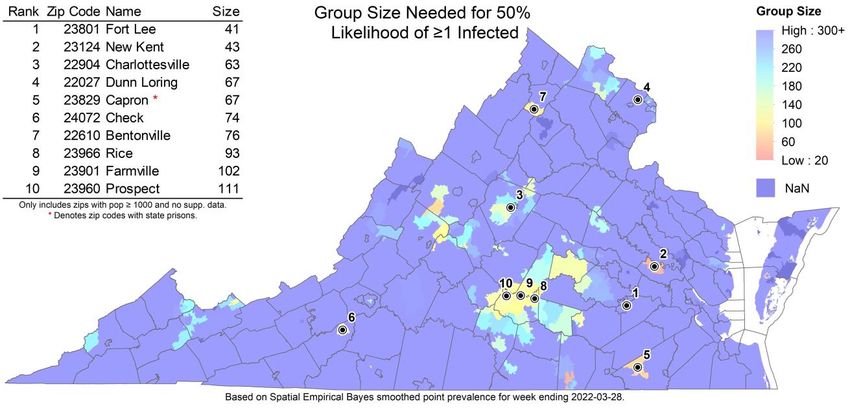
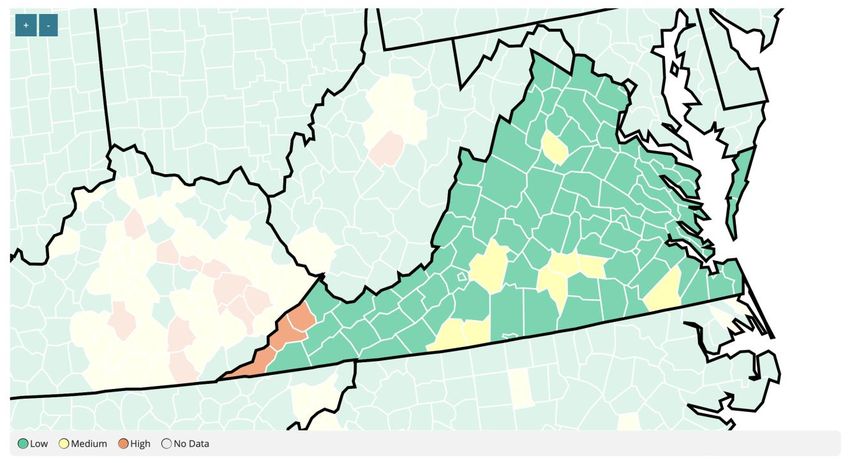
CDC’s new COVID-19 Community Levels

                        Last week

                                      CDC Data Tracker Portal
31-Mar-22                                               9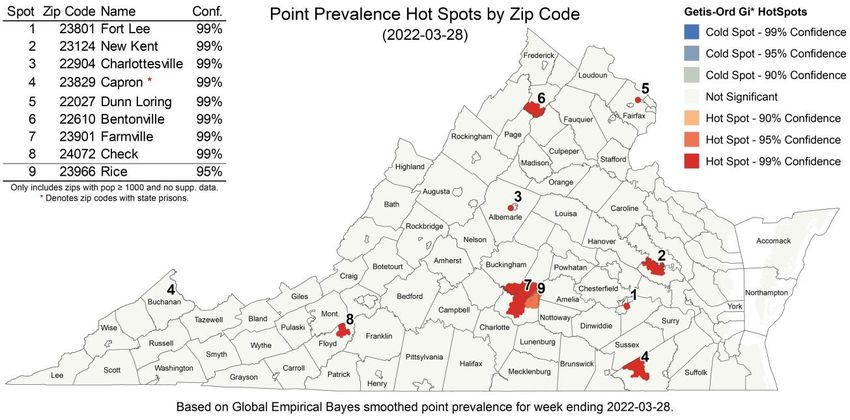
CDC’s new COVID-19 Community Levels
                                                           Red outline indicates county had 200 or
                                                           more cases per 100k in last week

                                                           Pale color indicates either beds or occupancy
                                                           set the level for this county
                                                           Dark color indicates both beds and
                                                           occupancy set the level for this county

                                               VA Levels

31-Mar-22 Data from: CDC Data Tracker Portal                                                         10
District Trajectories with Community Levels
Community Level
Curve shows smoothed case rate (per 100K) Last week
CDC’s new Community Level aggregated to district
level in label & chart box color
Case Rate curve colored by Trajectory
District’s Aggregate
Community Level
Aggregate level a simple mean
of all levels for counties in district
Case rate
Trajectory
31-Mar-22 11Estimating Daily Reproductive Number –
Redistributed gap
March 28th Estimates
Date Confirmed Date Confirmed
Region
Re Diff Last Week
State-wide 0.787 0.194
Central 0.982 0.585
Eastern 0.823 0.387
Far SW 0.527 0.071 Skipping Weekend Reports & holidays biases estimates
Near SW 0.132 -0.537 Redistributed “big” report day to fill in gaps, and then estimate R from
”smoothed” time series
Northern 0.912 0.095
Northwest 0.958 0.302
Methodology
• Wallinga-Teunis method (EpiEstim1) for cases by confirmation date
• Serial interval: updated to discrete distribution from observations (mean=4.3, Flaxman et al, Nature 2020)
• Using Confirmation date since due to increasingly unstable estimates from onset date due to backfill
1. Anne Cori, Neil M. Ferguson, Christophe Fraser, Simon Cauchemez. A New Framework and Software to Estimate
Time-Varying Reproduction Numbers During Epidemics. American Journal of Epidemiology, Volume 178, Issue 9, 1
November 2013, Pages 1505–1512, https://doi.org/10.1093/aje/kwt133
12
31-Mar-22Vaccination Administration in Virginia Vaccine Doses administered: • Doses administered rates continue to slow into a low-level plateau • Considerable reduction in vaccination rate experienced since mid-January • Third dose administration remains highest 31-Mar-22 13
Vaccination Acceptance by Region
Corrections to surveys:
• Facebook administered survey is timely and broad, but
  biased by who accesses Facebook and answers the survey
• Correction approach:
    • Calculate an over-reporting fraction based on reported
       vaccinations compared to VDH administration data
    • Cross-validate coarse corrections against HPS survey at
       the state level and corrected in same manner
               COVIDcast accepting VDH proportion
  Region
                   corrected       pop vaccinated
  Central             82%               76%
  Eastern             77%               74%
                                                                Grey Bar: Survey measured and corrected acceptance
  Far SW              64%               60%                     Green Bar: Proportion of eligible population
  Near SW             69%               66%                     administered a vaccine
  Northern            91%               88%                     Dots: Proportion administered at least one dose for
  Northwest           77%               74%                     each county
  Virginia            81%               78%

   31-Mar-22                                                                                              14
Mask Usage Slows and Continues Decline
Self-reported mask usage drops to nearly lowest level of pandemic in July 2021
• US and VA experienced similar decreases, though VA remains slightly higher
• Mask wearing remains lower amongst unvaccinated especially among least willing to be vaccinated
Data Source: https://covidcast.cmu.edu
31-Mar-22 15Wastewater Monitoring Wastewater provides a coarse early warning of COVID-19 levels in communities • Most sites in Northern and Eastern continue to detect COVID-19 in wastewater, Western part of state has no detection • General US trend in last couple weeks to have more increases in the level of virus detected Percent Change (15-day) Detection Proportion (15-day) Data Source: CDC Data Tracker 31-Mar-22 16
SARS-CoV2 Variants of Concern
Emerging new variants will alter the future trajectories
of pandemic and have implications for future control
• Emerging variants can:
    • Increase transmissibility
    • Increase severity (more hospitalizations and/or deaths)
    • Limit immunity provided by prior infection and vaccinations
• Genomic surveillance remains very limited
    • Challenges ability to estimate impact in US to date and
      estimation of arrival and potential impact in future    Omicron Prevalence
                                                              CDC now tracking
                                                              subvariant BA.2

                                                              CDC nowcast for week
                                                              ending March 26th
                                                              shows 48% BA.2 in
                                                              Region 3, up from 33%
                                                              previous week

                                                              Nationally BA.2 is now
                                                              the predominant sub-
                                                              variant (55%)
                              WHO

  31-Mar-22                                                                            CDC Variant Tracking   17
SARS-CoV2 Omicron and Sub-Variants
As detected in whole Genomes in public repositories VoC Polynomial Fit Projections
Note: Data lags
force projections
to start in past.
Everything from
dotted line
forward is a
projection.
31-Mar-22 18SARS-CoV2 BA.2 subvariant Tracking
BA.2 subvariant growing rapidly in some European countries SGTF proxy in US
• Both Delta and the Omicron BA.2 subvariant don’t have the SGTF
signal with PCR tests, so the reduction in SGTF from BA.1 can be Yale- New Haven
an imperfect signal for increased BA.2
• BA.2 is now majority subvariant in most northern European
countries and India and some neighbors
San Diego
SGTF in CT and CA indicate majority
CoVariants.org Are BA.2 subvariants now
31-Mar-22 191
Pandemic Pubs
1. Financial Times graphics nicely illustrate the impact of BA.2
on several European countries.
2. New analysis in UK HSA report illustrates that VE against
hospitalization remains high even for 65+ (85%) when
corrected for hospitalization likely due to COVID.
3. Researchers in Sweden find nasal swabs from BA.2 give
two-fold higher levels of RNA.
4. New research in MMWR shows significantly improved
protection for those who follow a primary J&J vaccine with an
mRNA booster. Financial Times Graphics based on JHU CSSE data
4 3 2
VE against COVID-19–associated emergency department/urgent care visits was
24% after 1 Jansen dose, 54% after 2 Jansen doses, and 79% after 1 Janssen/1
mRNA dose, compared to 83% after 3 mRNA doses. VE for the same strategies Analysis of 174,933 clinical nasopharyngeal swab samples using a custom variant-
against COVID-19–associated hospitalization was 31%, 67%, 78%, and 90% typing RT-PCR assay gives two-fold higher levels of viral RNA in cases with Omicron
BA.2. Researchers developed a modified RT-PCR test to assess BA.1 status (panel E) Using medical records analyzed population level
respectively. protection against hospitalization due to respiratory
https://www.cdc.gov/mmwr/volumes/71/wr/mm7113e2.htm?s_cid=mm7113e2_w#contrib and confirmed with sequencing (panel F)
https://www.medrxiv.org/content/10.1101/2022.03.26.22272984v1 illness for more than 2 days
Aff UK HAS report (24 March 2022)1
Pandemic Pubs (last week)
1. CDC Study Vaccine effectiveness against severe outcomes
higher after a 3rd dose than after the 2nd, though wanes with time
2. High immunogenicity of mRNA vaccines is achieved
after three doses with antibody levels restored by a fourth dose.
Fourth dose displayed reduced vaccine efficacy against infections
in young health care workers
3. Though Omicron BA.1 and BA.2 evade human plasma
neutralizing antibodies elicited by infection or primary vaccine
series, mRNA booster doses rescue neutralization potency across
many initial vaccine types.
3
Hong Kong Vaccination by age
“Vaccine effectiveness (VE) against COVID-19–associated emergency department/urgent care (ED/UC) visits and hospitalizations was higher after
the third dose than after the second dose but waned with time since vaccination. During the Omicron-predominant period, VE against COVID-19–
associated ED/UC visits and hospitalizations was 87% and 91%, respectively, during the 2 months after a third dose and decreased to 66% and 78%
by the fourth month after a third dose. Protection against hospitalizations exceeded that against ED/UC visits.”
https://www.cdc.gov/mmwr/volumes/71/wr/mm7107e2.htm?s_cid=mm7107e2_w
2
This nonrandomized clinical study,
assessed the immunoge-
nicity and safety of a fourth dose of either
BNT162b2 (Pfizer–BioNTech) or mRNA-
1273 (Moderna) administered 4 months
after the third dose in a series of three
BNT162b2 doses. Vaccine efficacy was
estimated to be higher for the prevention
of symptomatic disease (43% for
BNT162b2 and 31% for mRNA-1273)
https://www.nejm.org/doi/pdf/10.1056/
NEJMc2202542?articleTools=true
https://www.biorxiv.org/content/10.1101/2022.03.15.484542v1.full.pdfUnited States Case Rates
Trajectories of States
• All states have shifted to a
declining trajectory
Status # States
Declining 54 (54)
Plateau 0 (0)
Slow Growth 0 (0)
In Surge 0 (0)
31-Mar-22 22United States Hospitalizations
Trajectories of States
• Hospital admissions are
lagging case rates, and have
mainly entered plateaus
• Many states in growth
trajectories show signs of
slowing
Status # States
Declining 1 (3)
Plateau 52 (50)
Slow Growth 0 (1)
In Surge 0 (0)
31-Mar-22 23Virginia and Her Neighbors • All have dramatically dropped from peaks • Rates have moderated • All but Kentucky are below 10/100K 31-Mar-22 24
Other Countries
• Many, but not all, European countries are experiencing a rebound in cases
• Rebound in hospitalizations is a bit delayed but observed in some of these countries as well
• US per capita hospitalization rates lower than most European nations

                                                                                     Our World in Data
  31-Mar-22                                                                                              25
County-level comparison to previous highest peak
• Most counties in VA have had the highest case rate of the pandemic in the last week
• Nationally the number of counties at their highest rate has expanded considerably
Last week Last week
31-Mar-22 26County-level comparison to last Summer
• Most counties in VA have had the highest case rate of the pandemic in the last week
• Nationally the number of counties at their highest rate has expanded considerably
Last week Last week
31-Mar-22 27Zip code level weekly Case Rate (per 100K)
Case Rates in the last
week by zip code
• Clusters of high
prevalence in Southwest
• Some counts are low
and suppressed to
protect anonymity, those
are shown in white
31-Mar-22 28Risk of Exposure by Group Size and HCW prevalence
Case Prevalence in the last week by zip code used to calculate risk of encountering
someone infected in a gathering of randomly selected people (group size 25)
• Group Size: Assumes 2 undetected infections per confirmed case (ascertainment rate from recent
seroprevalence survey), and shows minimum size of a group with a 50% chance an individual is infected by
zip code (eg in a group of 41 in Fort Lee, there is a 50% chance someone will be infected)
• HCW ratio: Case rate among health care workers (HCW) in the last week using patient facing health care
workers as the denominator / general population’s case prevalence
31-Mar-22 29Current Hot-Spots
Case rates that are significantly different from neighboring areas or model projections
• Spatial: Getis-Ord Gi* based hot spots compare clusters of zip codes with weekly case prevalence higher
than nearby zip codes to identify larger areas with statistically significant deviations
• Temporal: The weekly case rate (per 100K) projected last week compared to observed by county, which
highlights temporal fluctuations that differ from the model’s projections
Spatial Hotspots Clustered Temporal Hotspots
31-Mar-22 30Scenario Trajectory Tracking
Which scenario from last projection did each county track closest?
• Minimal difference between
projections overall
• Mixed results reflective of similarity
of scenarios, most counties
tracking slower decline scenarios
(BA2 and DecreaseControl)
31-Mar-22 31Model Update – Adaptive Fitting 31-Mar-22 32
Model Structure Extended for Multiple Strains
Omicron escapes immunity from vaccinated and those infected with Delta
• Multiple strain support allows representation of differential protection based on
  immunological history
• Severity of Outcomes varies by strain and level of immunity, thus allowing model to better
  capture hospitalizations and deaths from Omicron
• Adaptive fitting approach continues to use simulation to generate the full distribution of
  immune states across the population

    31-Mar-22                                                                                  33
Adaptive Fitting Approach
Each county fit precisely, with recent trends used for Fairfax County
future projection
• Allows history to be precisely captured, and used to guide bounds
on projections
Model: An alternative use of the same meta-population
model, PatchSim with multiple tiers of immunity
• Allows for future “what-if” Scenarios to be layered on top of
calibrated model
• Allows for waning of immunity and for partial immunity
against different outcomes (eg lower protection for infection
than death)
External Seeding: Steady low-level importation
• Widespread pandemic eliminates sensitivity to initial
conditions, we use steady 1 case per 10M population per day
external seeding
31-Mar-22 34Using Ensemble Model to Guide Projections Ensemble methodology that combines the Adaptive with machine learning and statistical models such as: • Autoregressive (AR, ARIMA) • Neural networks (LSTM) • Kalman filtering (EnKF) Weekly forecasts done at county level. Models chosen because of their track record in disease forecasting and to increase diversity and robustness. Ensemble forecast provides additional ‘surveillance’ for making scenario-based projections. Also submitted to CDC Forecast Hub. 31-Mar-22 35
Seroprevalence updates to model design
Several seroprevalence studies provide better
picture of how many actual infections have occurred
• CDC Nationwide Commercial Laboratory Seroprevalence
  Survey

Pre-Omicron these findings were consistent with an
ascertainment ratio of ~2-3x
• Thus there were 2.5 total infections in the population for                 VA: 34% [31%-39%]
  every confirmed case recently
• Case ascertainment for Omicron infections are half of
  that for pre-Omicron, thus for every case there are ~5
  total infections
• During the peak of Omicron, the degradation of test
  seeking and capacity were modeled to have fallen by 3x
  with a rebound to pre-Omicron levels by mid-Feb.
                                                               https://covid.cdc.gov/covid-data-tracker/#national-lab

   31-Mar-22                                                                                                    36
Calibration Approach
• Data:
• County level case counts by date of onset (from VDH)
• Confirmed cases for model fitting
• Calibration: fit model to observed data and ensemble’s forecast
• Tune transmissibility across ranges of:
• Duration of incubation (5-9 days), infectiousness (3-7 days)
• Undocumented case rate (1x to 7x) guided by seroprevalence studies
• Detection delay: exposure to confirmation (4-12 days)
• Approach captures uncertainty, but allows model to precisely track the full trajectory of the outbreak
• Project: future cases and outcomes generated using the collection of fit models run into
the future
• Mean trend from last 7 days of observed cases and first week of ensemble’s forecast
used
• Outliers removed based on variances in the previous 3 weeks
• 2 week interpolation to smooth transitions in rapidly changing trajectories
• Outcomes: Data driven by shift and ratio that has least error in last month of
observations
• Hospitalizations: 3 days from confirmation, 6.8% of cases hospitalized
• Deaths: 11 days from confirmation, 1.45% of cases die
Accessed 10:30am March 30, 2022
https://www.vdh.virginia.gov/coronavirus/
31-Mar-22 37Scenarios – Transmission Conditions
• Variety of factors continue to drive transmission rates
• Seasonal impact of weather patterns, travel and gatherings, fatigue and premature
relaxation of infection control practices
• Waning Immunity: Mean of 6 months to a year protection (rate of 0.0027)
similar to Pfizer study, Omicron waning with a mean of 4 months
• Projection Scenarios:
• Adaptive: Control remains as is currently experienced into the future with
assumption that Omicron remains as the majority strain, and that infection with
Omicron provides protection against Omicron infection in the future
• Adaptive-VariantBA2: Same as Adaptive, but with BA.2 subvariant continuing
predominance and having a 30% transmission advantage over existing Omicron
• Adaptive-VariantBA2-IncreasedControl: Same as Adaptive-VariantBA2, but with a
25% reduction in transmission to increased mitigations starting on May 1st
31-Mar-22 38Scenarios – Omicron Description
Omicron shown ability to evade immunity and may be more transmissible
• Transmissibility: New evidence suggests that Omicron has similar transmissibility to Delta
• Immune Evasion: Strong evidence demonstrates that Omicron can cause infection in those
with some immunity (natural and vaccine induced). Consensus estimate of 80% immune
evasion allows Omicron to infect 80% of individuals that would have otherwise been
protected against Delta. Assume that recovery from Omicron provides protection to
infection with Omicron similar pre-Omicron variants
• Prevalence: Proportion of cases caused by Omicron variant
estimated from growth rates observed in other countries with Estimated Prevalence curve for US
similar levels of immunity (growth of 32%, doubling in ~3 days)
• Severity: Several reports suggest Omicron may not cause as
severe disease as Delta, we use a 50% reduction in severity for
hospitalizations and deaths
• Studies: South Africa, UK, Canada
Predominance occurs before Jan 1, 2022
31-Mar-22 39Scenarios – Omicron BA.2 Description Estimated BA2
prevalence projection
BA.2 shows signs of increased transmissibility
• Transmissibility: Analysis of household contacts in Denmark and the
UK suggests a 40% to 3x increase in transmission.
• Now use a 30% boost to transmissibility only
• Prevalence: Detection in US has been widespread but limited; given
growth observed elsewhere and US, and current estimated prevalence,
this would lead to BA.2 prevalence of 50% in early April
This projected prevalence is based on the
• Severity: Assumed to be same as for other Omicron subvariants increase experienced in Denmark the growth
rate in VA may be markedly different
Many countries
Tracking a 2x
Advantage for
Notes: This table shows odds ratio estimates for the effect of living in a household infected with BA.2 relative to BA.1. Column 1 and 4
shows the relative transmission of BA.2, conditional on being unvac- cinated. Column 2 and 5 shows the relative transmission of BA.2,
conditional on being fully vaccinated. Column 3 and 6 shows the relative transmission of BA.2, conditional on being booster
BA.2 vs. BA.1
vaccinated. Note, all estimates are from the same model, but with a different reference category across column 1-6. The estimates are
adjusted for age and sex of the primary case, age and sex of the potential secondary case, size of the household, and primary case
sample date. The estimates are furthermore adjusted for vacci- nation status of the potential secondary case and primary case
interacted with the household subvariant. 95% confidence intervals are shown in parentheses. Standard errors are clustered on the
household level. The odds ratio estimates for the full model are presented in Appendix Table 12, column I UK HAS report shows 2ndary Attack rates ~30% higher Barak Raveh
in households and out of households.
Danish Household Study - MedArxiv https://assets.publishing.service.gov.uk/government/up via Twitter
loads/system/uploads/attachment_data/file/1060337/T
echnical-Briefing-38-11March2022.pdf
31-Mar-22 40Projection Scenarios – Combined Conditions
Txm
Name Vax Description
Controls
Likely trajectory based on conditions remaining similar to the current experience,
Adaptive C SQ includes immune escape due to Omicron
Transmission rates for BA.2 infections are 30% more infectious, BA.2 prevalence
Adaptive-VariantBA2 C SQ reaches 50% on April 1st and rises to ~95% in next 4 weeks
Adaptive-VariantBA2- Same as Adaptive-VariantBA2 with increased mitigations reducing transmission
Increased SQ by 25% starting May 1st
IncreasedControl
Transmission Controls: C = Current levels persist into the future
Increased = Transmission rates are reduced by 25% over 2 weeks starting May 1st
Spring = Transmission rates from mid-Jan 2021 through mid-March 2021 are coarsely replayed,
representing a 60% reduction in transmission rate drivers, with Omicron remaining dominant
Vaccinations: SQ = Status quo acceptance leads to low rates of vaccination through the summer
VO = Vaccination acceptance optimistically expands with increased rates through the summer
31-Mar-22 41Model Results 31-Mar-22 42
Outcome Projections                            Estimated Hospital Occupancy

            Confirmed cases

                                      Daily Deaths                       Daily Hospitalized

                              Death ground truth from VDH “Event Date”
                              data, most recent dates are not complete

31-Mar-22                                                                               43
Outcome Projections – Closer Look
Daily Hospitalized
Confirmed cases
Daily Deaths
Death ground truth from VDH “Event Date”
31-Mar-22 data, most recent dates are not complete 44Detailed Projections: All Scenarios
Projections by Region Projections by District
Near SW Northwest Northern Daily confirmed cases)
by rate (per 100K)
District (grey with 7-day
average in black) with
simulation colored by
Far SW Central Eastern scenario
31-Mar-22 45Detailed Projections: All Scenarios - Closer Look
Projections by Region Projections by District
Near SW Northwest Northern Daily confirmed cases by
rate (per 100K) District
(grey with 7-day average
in black) with simulation
colored by scenario
Far SW Central Eastern
31-Mar-22 46Hospital Demand and Bed Capacity by Region
Capacities by Region
COVID-19 capacity ranges from 80% (dots) to 120% (dash) of total beds
Length of Stay Estimates
Adaptive
Central 8
Length of Stay more variable with Omicron, Eastern 7
occupancy projections may vary as a result, Far SW 10
Near SW 8
ad-hoc estimation performed per region Northern 6
Northwestern 8
Estimated LOS stable
Projections show continued declines and with expanded capacities
Adaptive – Variant BA2 and adjusted length of stay, no capacities exceeded
Interactive Dashboard
with regional
projections
https://nssac.bii.virginia.edu/covid-19/vmrddash/
31-Mar-22 47Unknown Future Variants Confirmed cases
Currently there no known Variants expected to
cause significant changes to current trajectories
• The risk remains, however, as Alpha, Delta, and
Omicron have demonstrated.
• To explore what impact a speculative future
variant might have we built a ”Variant X” scenario,
loosely based on the Alpha variant (eg Variant X is
to Omicron as Alpha was to ancestral)
• Adaptive-VariantX: Same as Adaptive, with a 60%
more transmissible variant arriving in mid-May
and predominating (50% prevalence) by July 1
31-Mar-22 48Unknown Future Variants – Closer Look
Estimated Hospital Occupancy
Confirmed cases
Daily Deaths Daily Hospitalized
Death ground truth from VDH “Event Date”
data, most recent dates are not complete
31-Mar-22 49Current Influenza Hospitalization Forecast
Statistical models for submitting to CDC FluSight forecasting challenge
• Hospitalizations nationwide are rising, VA still steady
Hospital Admissions for Influenza and Forecast
for next 4 weeks (UVA ensemble)
CDC FluSight
Ensemble Forecasts
(Mar 14th)
31-Mar-22 50Key Takeaways
Projecting future cases precisely is impossible and unnecessary.
Even without perfect projections, we can confidently draw conclusions:
• Case rates and hospitalizations are starting to plateau
• VA 7-day mean daily case rate slowly decreased to 8/100K from 10/100K
• US has plateaued to 9/100K (from 9/100K)
• BA.2 subvariant of Omicron approaches 50% prevalence and continues to grow
• Projections anticipate a plateau at moderate to low levels, though growth from BA.2 or other factors is possible:
• Future levels and resilience to new variants and reduced infection control measures depend on the strength of immunity gained through infection
with Omicron and its durability against waning
• Model updates:
• Adjusted ascertainment levels during Omicron to better capture degraded case detection and reduced symptomatic fraction of Omicron
• Further calibration of model parameters to match recent data on population immunity post-Omicron wave continue and will provide better long-
term estimates of future disease dynamics
The situation continues to change. Models continue to be updated regularly.
31-Mar-22 51Additional Analyses 31-Mar-22 52
Overview of relevant on-going studies
Other projects coordinated with CDC and VDH:
• Scenario Modeling Hub: Consortium of academic teams coordinated via MIDAS / CDC
  to that provides regular national projections based on timely scenarios
• Genomic Surveillance: Analyses of genomic sequencing data, VA surveillance data, and
  collaboration with VA DCLS to identify sample sizes needed to detect and track
  outbreaks driven by introduction of new variants etc.
• Mobility Data driven Mobile Vaccine Clinic Site Selection: Collaboration with VDH
  state and local, Stanford, and SafeGraph to leverage anonymized cell data to help
  identify

 31-Mar-22                                                                        53
COVID-19 Scenario Modeling Hub
Collaboration of multiple academic     https://covid19scenariomodelinghub.org/viz.html
teams to provide national and state-
by-state level projections for 4
aligned scenarios that vary vaccine
rates (high – low) and impact of the
Delta variant (high and low)
• Round 12 recently released to
  assist in federal response to
  Omicron wave
• Only national consortium tracking
  Omicron wave well
• Rounds 4-11 now available
Round 4 Results were published
May 5th, 2021 in MMWR
     31-Mar-22                                                                           54
Data Recommended Mobile Vax Clinic Sites
Detailed and Timely Locations Data Delivered and Disseminated to Locals
Provides a list of areas most visited by a given
demographic group based on SafeGraph mobility
data that links visits to specific sites and the home
Census Block Group of the anonymized visitors
Demographic Groups: Black, Lantinx, Young Adults
(20-40), Unvaccinated, and Whole Population
Data Included: Rank, Weight, most visited Day of
Week, Highly Visited Address, and Lat-Long of area
Goal: Provide frequently visited locations based on populations and vaccination levels one desires to reach
Example: List of location in the Southside frequented by 20-40 year olds
31-Mar-22 55Data Recommended Mobile Vax Clinic Sites
Overlap of locations between groups
Within VDH Health Districts
State Level
Different groups visit different areas
• Least overlap between Black and Latinx
• Overlap in ages highest, but drops with large gaps
• Districts have different overlap patterns
31-Mar-22 56References Venkatramanan, S., et al. "Optimizing spatial allocation of seasonal influenza vaccine under temporal constraints.” PLoS Computational Biology 15.9 (2019): e1007111. Arindam Fadikar, Dave Higdon, Jiangzhuo Chen, Bryan Lewis, Srinivasan Venkatramanan, and Madhav Marathe. Calibrating a stochastic, agent-based model using quantile-based emulation. SIAM/ASA Journal on Uncertainty Quantification, 6(4):1685– 1706, 2018. Adiga, Aniruddha, Srinivasan Venkatramanan, Akhil Peddireddy, et al. "Evaluating the impact of international airline suspensions on COVID-19 direct importation risk." medRxiv (2020) NSSAC. PatchSim: Code for simulating the metapopulation SEIR model. https://github.com/NSSAC/PatchSim Virginia Department of Health. COVID-19 in Virginia. http://www.vdh.virginia.gov/coronavirus/ Biocomplexity Institute. COVID-19 Surveillance Dashboard. https://nssac.bii.virginia.edu/covid-19/dashboard/ Google. COVID-19 community mobility reports. https://www.google.com/covid19/mobility/ Biocomplexity page for data and other resources related to COVID-19: https://covid19.biocomplexity.virginia.edu/ 31-Mar-22 57
Questions?
                                   Biocomplexity COVID-19 Response Team

                            Aniruddha Adiga, Abhijin Adiga, Hannah Baek, Chris Barrett,
                            Golda Barrow, Richard Beckman, Parantapa Bhattacharya,
Points of Contact
                            Jiangzhuo Chen, Clark Cucinell, Patrick Corbett, Allan
Bryan Lewis                 Dickerman, Stephen Eubank, Stefan Hoops, Ben Hurt, Ron
brylew@virginia.edu         Kenyon, Brian Klahn, Bryan Lewis, Dustin Machi, Chunhong
                            Mao, Achla Marathe, Madhav Marathe, Henning Mortveit,
Srini Venkatramanan         Mark Orr, Joseph Outten, Akhil Peddireddy, Przemyslaw
srini@virginia.edu          Porebski, Erin Raymond, Jose Bayoan Santiago Calderon,
                            James Schlitt, Samarth Swarup, Alex Telionis, Srinivasan
Madhav Marathe              Venkatramanan, Anil Vullikanti, James Walke, Andrew
marathe@virginia.edu
                            Warren, Amanda Wilson, Dawen Xie
Chris Barrett
ChrisBarrett@virginia.edu

31-Mar-22                                                                                 58
Supplemental Slides 31-Mar-22 59
Agent-based Model (ABM )
 EpiHiper: Distributed network-based stochastic disease transmission simulations
 • Assess the impact on transmission under different conditions
 • Assess the impacts of contact tracing

                                                 Detailed Disease Course of COVID-19
                                                 • Literature based probabilities of outcomes with
Synthetic Population
                                                   appropriate delays
• Census derived age and household structure
                                                 • Varying levels of infectiousness
• Time-Use survey driven activities at           • Hypothetical treatments for future developments
   appropriate locations

 31-Mar-22                                                                                           60
You can also read