ESRL/PSD's planned research in support of improved sub-seasonal precipitation forecasts for California DWR
←
→
Page content transcription
If your browser does not render page correctly, please read the page content below
ESRL/PSD’s planned research in support of
  improved sub-seasonal precipitation
      forecasts for California DWR
                                    Tom Hamill, on behalf of
      Michael Scheuerer, Lisa Bengtsson, and Juliana Dias
                    (also: Jian-Wen Bao, George Kiladis, Stefan Tulich)

  presentation to S2S precipitation forecasting workshop, Western States Water Council and Cali DWR, 15 May 2018   1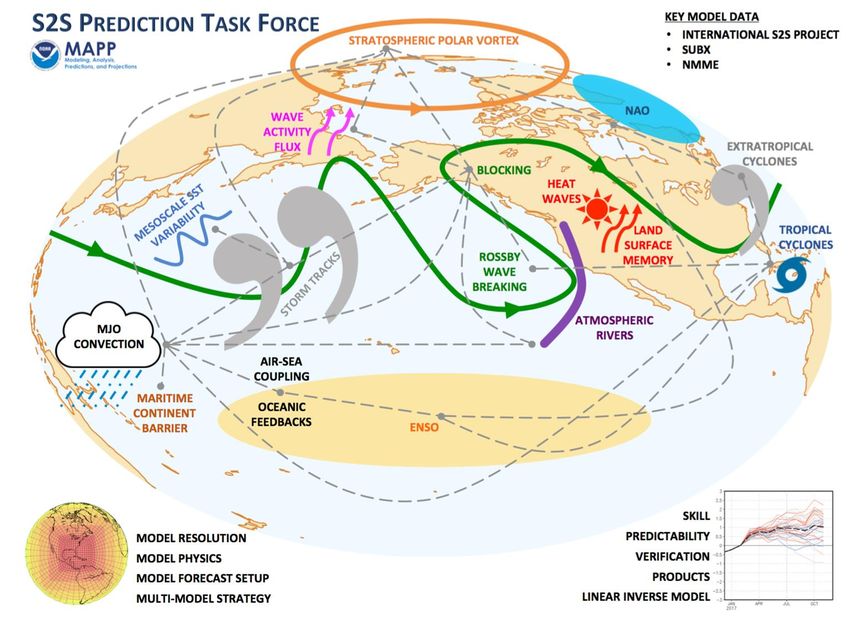
Chaos, one limiting factor in successful S2S predictions.

         __ day   +0   __day   +1   __day   +3   __   day +5

                                                               2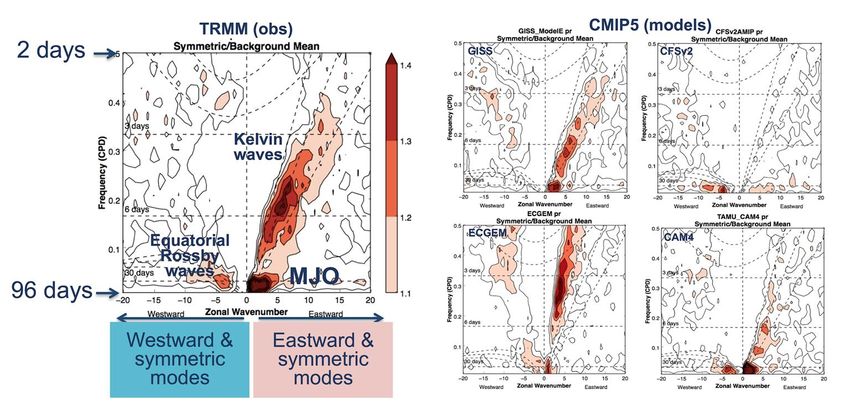
Weather, sub-seasonal, and seasonal variations.

                                                 The grand hope for S2S prediction: day-to-day
                                                 weather mean and variability at S2S time scales
                                                 may be modulated by more predictably low-
                                                 frequency variability in atmosphere (MJO) and
                                                 boundary forcings such as ocean surface
                                                 temperature and soil moisture.
from 2016 NAS report on S2S improvement, here.                                               3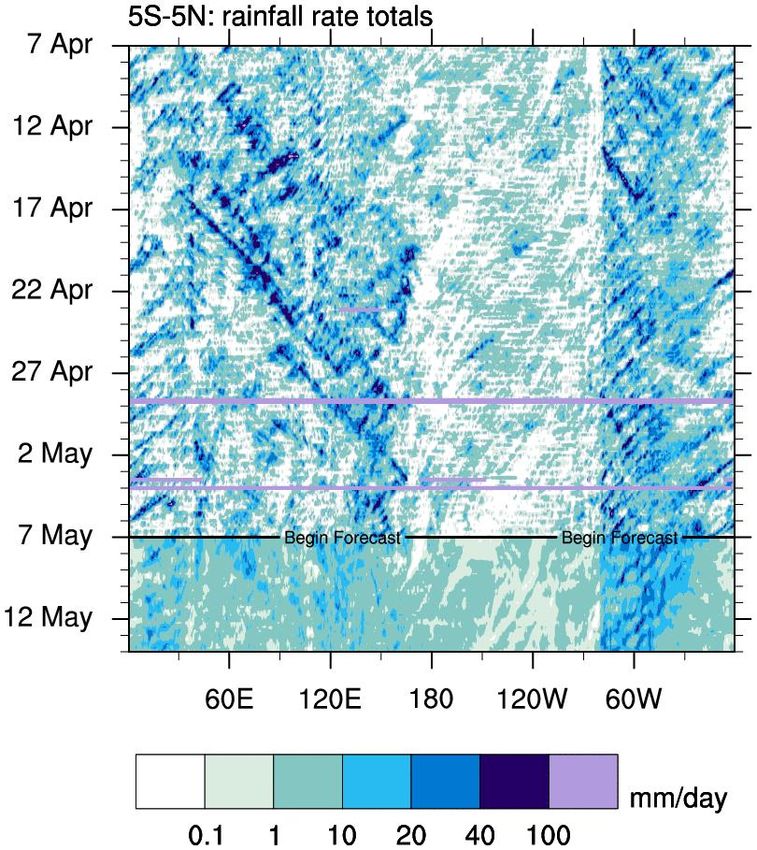
Inter-connected sources of skill for S2S forecasts, and
research challenges in modeling them correctly.
                                     • Madden-Julian Oscillation
                                     • Polar stratospheric
                                       anomalies & NAO
                                     • Blocking
                                     • Sea-surface temperature
                                       anomalies, especially El
                                       Nino/La Nina
                                     • Land-surface state
                                       anomalies
                                     • Snow anomalies
                                     • Sea-ice anomalies
                                     • and more
                                                             4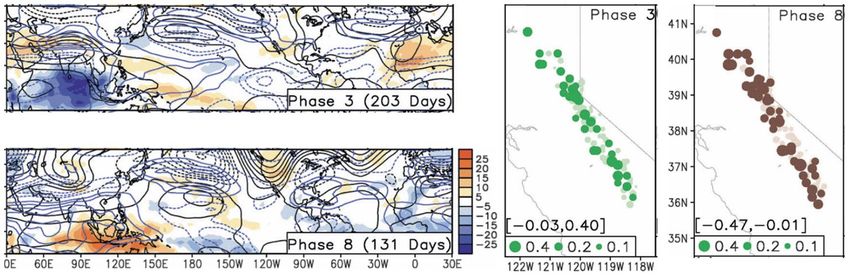
Systematic model error: the other S2S dragon to slay.

                          Comparing rainfall observations to GFS
                          forecasts, it is clear that the GFS produces
                          excessive light rain rates, a weak diurnal cycle,
                          and has trouble propagating disturbances (not
                          only the MJO, but also smaller-scale waves)

                          Figure: Time–longitude plots of rainfall rates (3 hourly, 0.5°x 0.5°) averaged over
                          5°S-5°N. Observations from TMPA/TRMM 3B42RT for the last 30 days and GFS
                          forecast for the next 7 days. From Michael Ventrice's Hovmollers Page.         5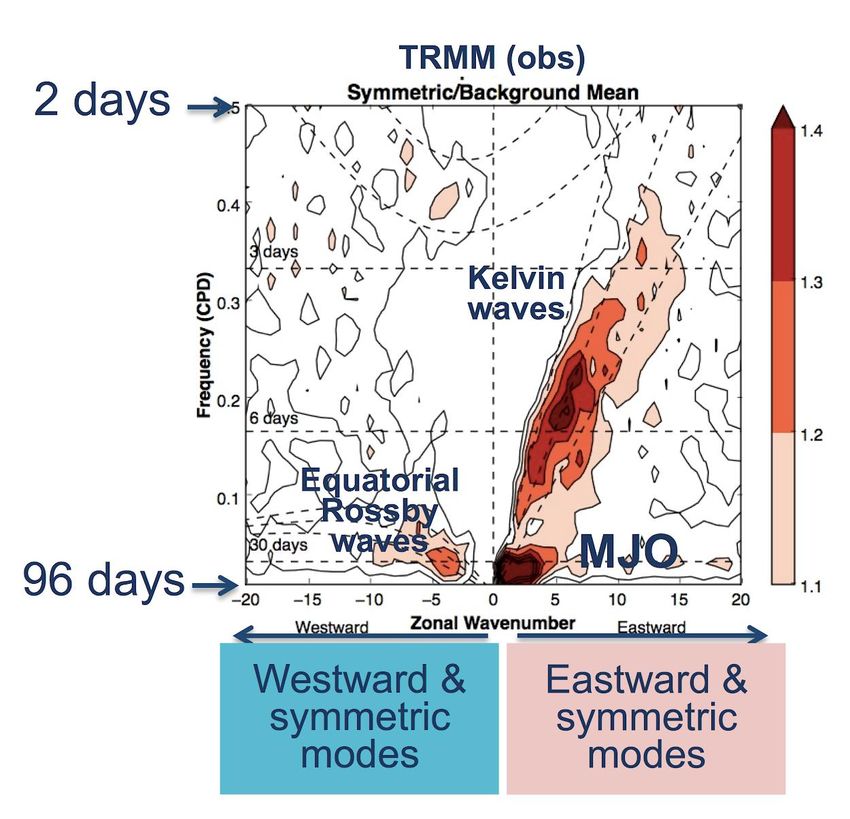
NGGPS and S2S programs
2014                                              2018                                     2022
                              Next-Generation Global Prediction System
  Atmospheric dycore selection (FV3)
                Coupling component systems via NEMS →
                Parameterization development & more →
                                     GEFS reanalysis, reforecast data sets
                                                                   Deploy community system
                                                                   Implement GFS to +10 days
                                                                            Implement GEFS to +35 days
                                                                                                         etc.
  • NOAA will expect   its funded S2S R&D development to
                   System
  leverage NGGPS community system and to improve
  NGGPS, not other systems.
  • Follow the ECMWF paradigm; concentrate
  resources to develop one great system. Multi-model
                                                                         Upcoming S2S project
  internationally, perhaps not nationally.                        Prediction system improvements related to S2S;
  • S2S: build out from week +3 to week +4 to month to            others will still be handled through NGGPS.
  season to inter-annual.
  • Still some areas under-resourced; we picked three
  that relate to S2S precipitation forecasts in California.                                                        6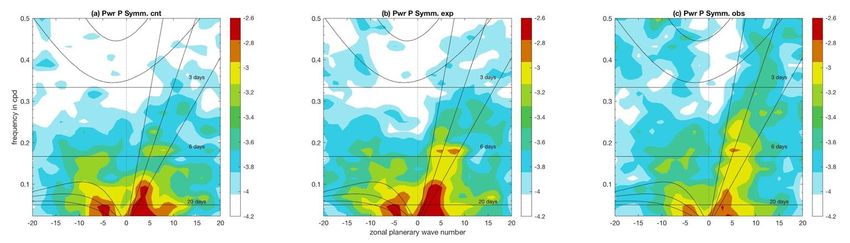
Three areas of S2S western US precipitation
improvement lacking in current NGGPS & S2S portfolios.

 • Statistical postprocessing: while a dramatically improved S2S
   prediction system is being developed, statistically adjust the real-time
   forecast guidance to correct for systematic errors, statistically
   downscale, filter out the noise.
 • Better diagnoses of what’s wrong with tropical thunderstorms and
   the Madden-Julian Oscillation that modulate land-falling storms on
   the US West Coast.
    • Must understand what needs fixing before targeting model improvements.
 • Improve the representation of those tropical thunderstorms.
                                                                               7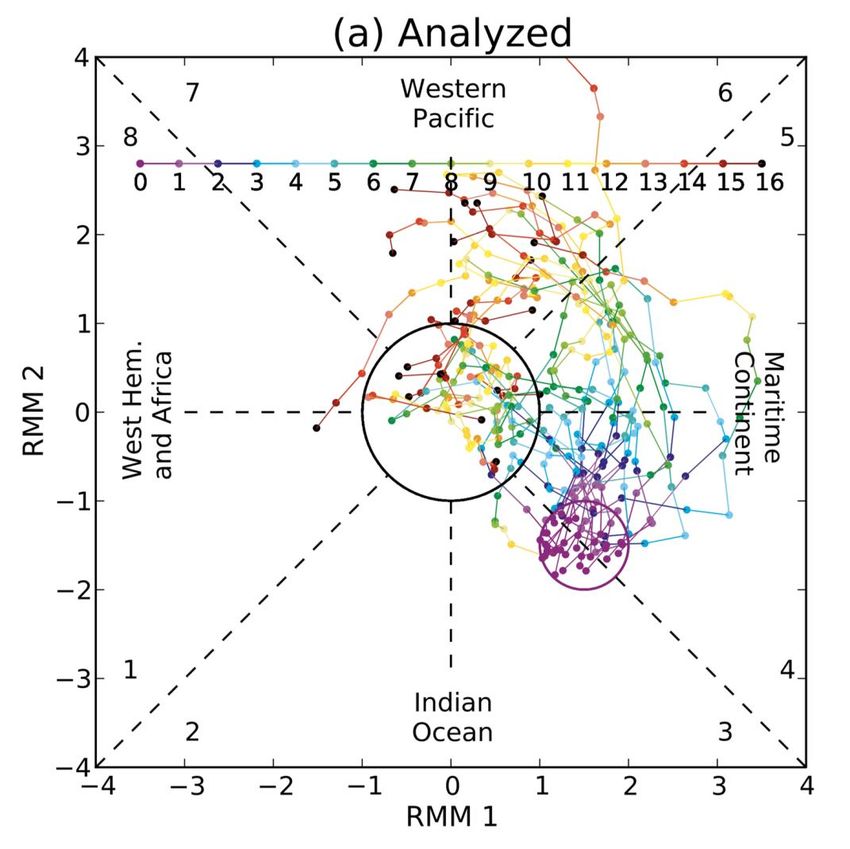
Leaders of the planned research for California DWR

 Michael Scheuerer                      Lisa Bengtsson                           Juliana Dias
 Statistical postprocessing             Improving the modeling                   Diagnosing problems with
 of sub-seasonal precipitation          of thunderstorms and                     thunderstorms in
 forecasts                              their variability in                     numerical weather and
                                        ensemble prediction                      climate prediction systems.
                                        systems.

        Each of these scientists are 5-10 years past the Ph.D. and emerging leaders in their disciplines.
        Expect to see them in future visits.                                                                   8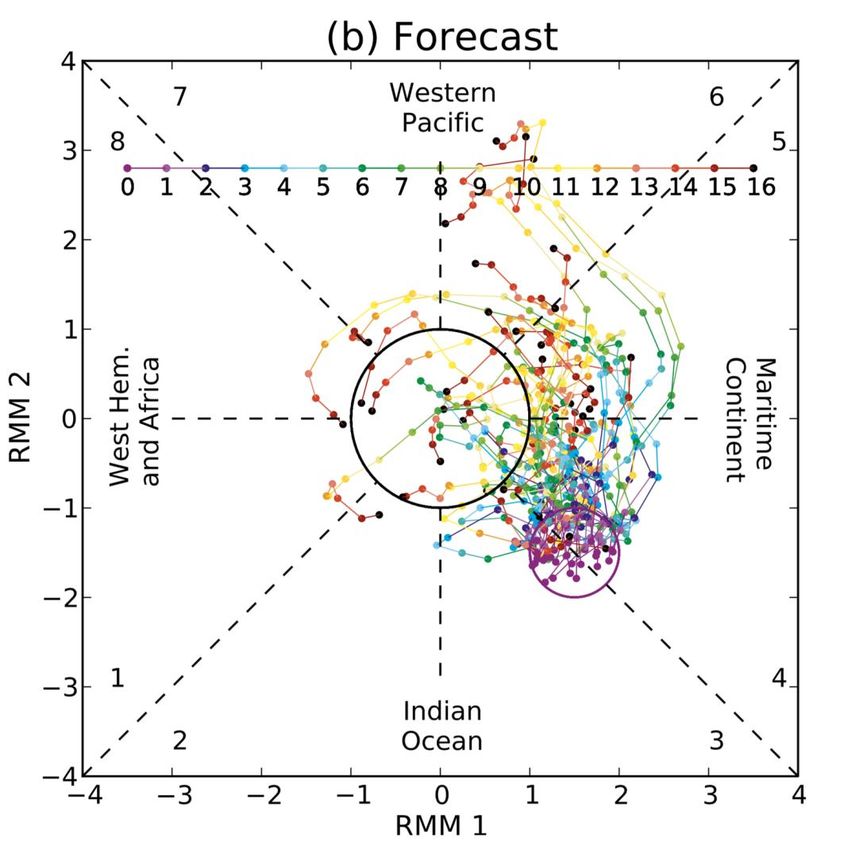
Statistical postprocessing
ESRL/PSD has extensive experience in the development
and evaluation of advanced statistical postprocessing
methodologies, especially for precipitation.
We are contributing to the development of NOAA’s National
Blend of Models (NBM), and we have developed several
experimental forecast web products including one that
provides medium-range probabilistic forecast guidance for
extreme precipitation over California based on the algorithm
proposed by Scheuerer and Hamill (2015).

                                        Heteroscedastic regression
                                        approach based on censored
                                        shifted gamma distributions
                                        proposed by Scheuerer and
                                        Hamill (2015).
                                                                      https://www.esrl.noaa.gov/psd/forecasts/reforecast2/calif-
                                                                      csgd/index.html                                            9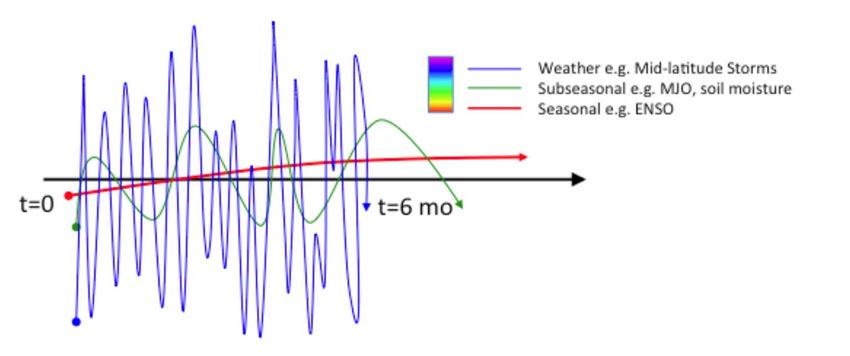
Statistical postprocessing
The postprocessing methods developed in our group have been successfully used to
provide probabilistic guidance for lead times up to 15 days. Ensemble precipitation
forecasts by the current version of the GEFS show little skill for lead times beyond that.

                                                           However, there might be some skill
                                                           in GEFS forecasts of geopotential
                                                           anomaly patters or large scale
                                                           moisture transport.
                                                           We will develop new postprocessing
                                                           methodology that links precipitation
                                                           over California to these large scale
                                                           predictors and thus generates
                                                           reliable probabilistic guidance for
                                                           precipitation accumulations with up
                                                           to 3/4 weeks of lead time.

                                                                                             10
Statistical postprocessing
The postprocessing methods mentioned above are optimized for good overall performance. For
water management in California, however, it is particularly important to not miss an event.
We will study alternative methods, including machine learning techniques, that are optimized to
predicting the non-occurrence of an event and identify predictors that might not necessarily be
useful for predicting the exact precipitation amount but allow one to rule out the possibility of heavy
precipitation with high confidence.
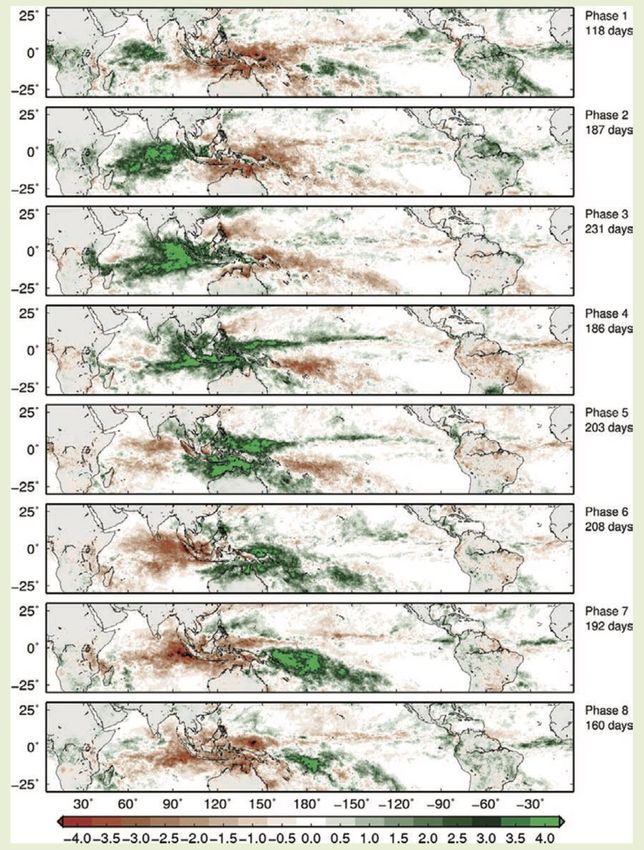
11The Madden-Julian Oscillation and improved diagnostics of
sources of tropical thunderstorm forecast error.
12RMM1 and RMM2, the leading EOFs of MJO variability.
tropical
precipitation
anomalies
associated
with MJO
phases.
13
from Zhang 2013 BAMS, here.More on the MJO
• It’s intermittently active (more in winter; left).
• Modulates weather even far from the tropical Pacific, as the organized tropical convection forces
mid-latitude Rossby wave train (right).
active
inactive
Illustration of the impact of the phase of the MJO and the rate of
snow accumulation in the Sierras, adapted from Guan et al.
(2012). The two left panels show outgoing longwave radiation
anomalies relative to average conditions for phases 3 and 8 of
the MJO. Blue colors indicate enhanced thunderstorm activity,
orange colors indicate suppressed activity. The two right-hand
panels show the contemporaneous changes in snow
accumulation associated with Phases 3 and 8, illustrating how the
from https://ds.data.jma.go.jp/tcc/tcc/products/clisys/mjo/rmm.html MJO can modulate precipitation in California. 14MJO intensity and propagation speed not well
modeled in recent NCEP GEFS system.
Circa 2012 version
of GEFS tends to
decrease amplitude
of MJO and propagate
too slowly.
Probably several causes,
including convective
parameterization, lack of
proper stochastic physics,
modeling of SST
response to MJO
thunderstorms, & more.
The current poor
prediction and its effect
on US S2S forecasts
make this a key area of
R&D.
Ref: Hamill and Kiladis MWR 2014, here. 15MJO performance depends on metric used
Circulation (RMM) versus Convection (ROMI) based MJO indices
MJO propagation and
amplitude depends on
whether its circulation or
convective signal is
tracked
Verification of MJO
inferred from convection
based indices is a harder
test for models.
Figure: MJO phase diagram from October-December 2011. Figure from Kiladis et al 2014, 16
MWR.Model performance deficiencies extend beyond the MJO to
higher-frequency tropical waves
• The greatest power is low-
frequency variability with a zonal
wavenumber of 1. This is the MJO,
the Madden-Julian Oscillation.
• Ref: Wheeler and Kiladis 1999 JAS,
here.
• Not modeled well in most current
prediction systems.
17Model performance deficiencies extend beyond the MJO to
higher-frequency tropical waves
18Model performance deficiencies extend beyond the MJO to
higher-frequency tropical waves
Space-time spectra are useful diagnostics tools to test
model development (see more in Dias et al. 2018, MWR)
19Time average of analysis increments
(analysis minus forecast) January 2010, ECMWF
• In data assimilation, background
forecasts should be unbiased, so
corrections should be random and
near zero.
• “YOTC” data set provides analysis,
forecast, time tendency data to
creatively explore potential sources of
forecast error.
• ECMWF’s Jan 2010 biases in tropical
upper troposphere are probably
representative of current NCEP
models.
• Errors in this area with thunderstorms
are ones we’d like to tamp down.
20Forecast tendency = large-scale dynamics + sub-gridscale parameterizations.
A general anti-correlation between dynamics and physics tendency.
Example: large-scale upward motion induces cooling. Parameterizations of cloud latent heating
introduce some compensating warming.
2122
Model tendencies are not regularly saved.

Simple diagnostics like this are not yet in widespread use.

                                                              23
Improvement of the deep convective
parameterization.
What can we learn from other state-of-the-art convection parameterizations?
FV3 GFS v0 FV3 GFS w IFS conv observed
Shallow
convective
heating
tendency.
SAS
scheme.
Shallow
convective Example with the ECMWF’s IFS convection scheme in
heating
tendency.
FV3GFS. More power in the Kelvin mode (too much in
IFS low frequencies).
scheme.
Better realism in diurnal cycle of shallow convection.
24
Forecast timeImprovement of the deep convective
parameterization.
Stochastic deep convection parameterization can help improve the
variability of convection and the frequency distribution of surface
precipitation, and yield more reliable uncertainty estimates in an
ensemble.
Use cellular automata to
model sub-grid scale
organization and stochastic 6 h avg surface precip rate frequency Ensemble spread/skill ratio of 6 h
25
plume-number distribution distribution. (Single forecast). avg surface precipitation.Improvement of the deep convective
parameterization.
Tasks include:
• Understand features of other successful (convective)
parameterizations to improve FV3GFS schemes.
• Introduce convective organization, stochasticity and memory
important for interaction with tropical wave dynamics through:
• Lateral communication by cellular automata
• Prognostic cloud life-cycle (memory from previous time-step, and ability to
represent several stages of the convection)
• Representation of sub-grid scale variability of cloud number modeled by
stochastic processes.
• Improve variability of precipitation by including process-level
physically based stochastic perturbations.
• Super-parameterization to inform sub-grid variability 26Conclusions
We appreciate the support of California DWR to improve aspects of
modeling related to medium-range and sub-seasonal precipitation
prediction.
We have chosen 3 subject areas: (a) statistical postprocessing; (b)
improved diagnostics to facilitate detection and correction of tropical
thunderstorm errors; and (c) improved modeling of those
thunderstorms.
We are at an early stage, and welcome constructive feedback, and
can modify plans if needed.
27You can also read