ESA Climate Change Initiative (CCI+) Essential Climate Variable (ECV) Antarctic_Ice_Sheet_cci+ (AIS_cci+)
←
→
Page content transcription
If your browser does not render page correctly, please read the page content below
Reference : ST-DTU-ESA-GISCCI+-PMP-001
                                 Greenland_Ice_Sheet_cci+
                                                                  Version   : 1.0               page
                                 Climate Assessment Report        Date      : 04 May 2022       1/30

               ESA Climate Change Initiative (CCI+)
                        Essential Climate Variable (ECV)
                     Antarctic_Ice_Sheet_cci+ (AIS_cci+)

                        Climate Assessment Report (CAR)

Prime & Science Lead:    Andrew Shepherd
                         University of Leeds, Leeds, United Kingdom
                         a.shepherd@leeds.ac.uk

Technical Officer:       Marcus Engdahl
                         ESA ESRIN, Frascati, Italy
                         Marcus.Engdahl@esa.int

Consortium:              DTU Microwaves and Remote Sensing Group (DTU-N)
                         DTU Geodynamics Group (DTU-S)
                         ENVironmental Earth Observation GmbH (ENVEO)
                         Deutsches Zentrum für Luft- und Raumfahrt (DLR) Remote Sensing Technology
                         Institute (IMF)
                         Science [&] Technology AS (ST)
                         Technische Universität Dresden (TUDr)
                         University College London (UCL/MSSL)
                         University of Leeds, School of Earth and Environment (UL)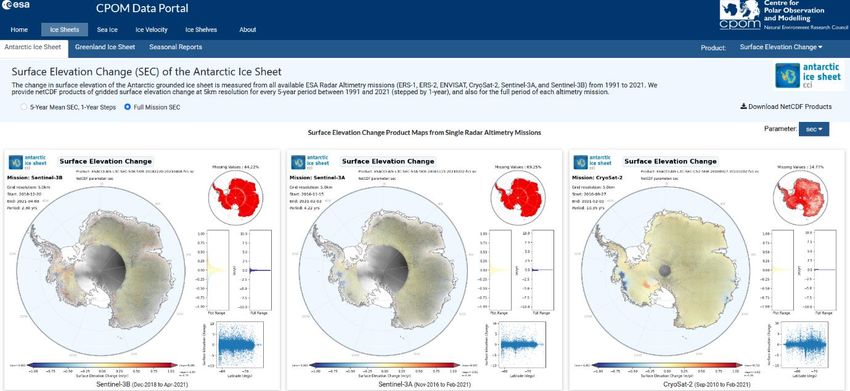
Reference : ST-DTU-ESA-GISCCI+-PMP-001
                                Greenland_Ice_Sheet_cci+
                                                                     Version   : 1.0               page
                                Climate Assessment Report            Date      : 04 May 2022       2/30

                                      Signatures page

              Antony Payne,                                                            Date:02 May
Prepared by
              University of Bristol                                                    2022

              Daniele Fantin,               Digitally signed by Daniele Fantin
Issued by                                                                              Date:
              Project Manager, S[&]T        Date: 2022.05.04 20:08:40 CEST

              Andrew Shepherd                                                          Date: 02 May
Checked by
              Science Leader, UL                                                       2022

              Marcus Engdahl
Approved by                                                                            Date:
              ESA Technical Officer
Reference : ST-DTU-ESA-GISCCI+-PMP-001
                                            Greenland_Ice_Sheet_cci+
                                                                                        Version   : 1.0               page
                                            Climate Assessment Report                   Date      : 04 May 2022       3/30

Table of Contents
Change Log ....................................................................................................... 4
Acronyms and Abbreviations ............................................................................. 5
1     Introduction................................................................................................ 6
1.1     Purpose and Scope ...................................................................................... 6
1.2     Document Structure .................................................................................... 6
1.3     Applicable and Reference Documents.............................................................. 6
2     Overview of the ECV data products produced by AIS-cci+ ............................. 7
2.1     AIS-cci+ Essential Climate Variables............................................................... 7
2.2     Use of ECVs by the community .................................................................... 10
3     Mass budget of the Antarctic ice sheet ....................................................... 12
3.1     Continental mass budget of AIS ................................................................... 12
3.2     Applications of AIS mass budget products ..................................................... 15
3.3     Summary of AIS mass budget ..................................................................... 16
4 Process studies related to the Antarctic ice sheet ....................................... 17
4.1 Dynamics of glaciers and ice streams ........................................................... 17
4.2     Ice shelves............................................................................................... 19
4.3     Grounding lines......................................................................................... 20
4.4     Summary of process studies ....................................................................... 22
5 Climate Assessment Report recommendations ........................................... 23
5.1 General recommendations .......................................................................... 23
5.2     Potential additional ECVs ............................................................................ 24
5.3     Outreach and communication ...................................................................... 25
6     References ................................................................................................ 27
Appendix - Data portals for the AIS_cci+ ......................................................... 29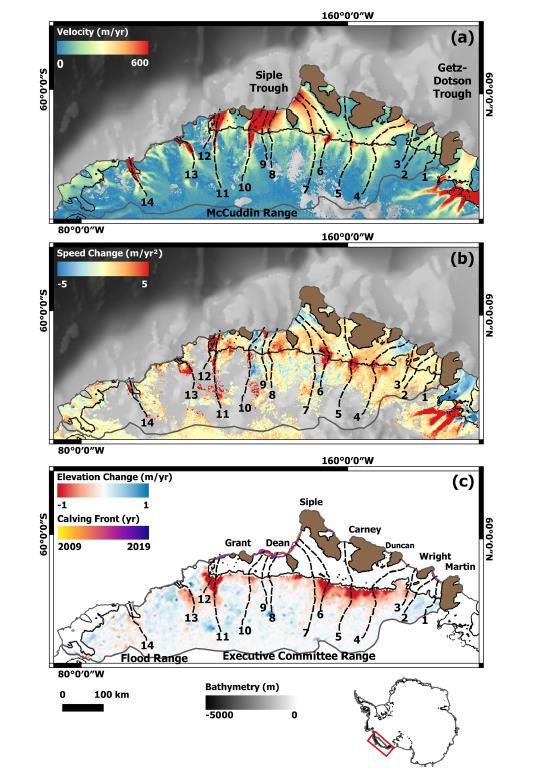
Reference : ST-DTU-ESA-GISCCI+-PMP-001
                                   Greenland_Ice_Sheet_cci+
                                                                Version   : 1.0               page
                                   Climate Assessment Report    Date      : 04 May 2022       4/30

                                            Change Log

Issue   Author      Affected Section                           Change                 Status
0.5     D. Fantin   All                                        Document Creation
1.0     A. Payne    All                                        Document preparation   Released to ESA
Reference : ST-DTU-ESA-GISCCI+-PMP-001
                       Greenland_Ice_Sheet_cci+
                                                                  Version   : 1.0               page
                       Climate Assessment Report                  Date      : 04 May 2022       5/30

Acronyms and Abbreviations

          Acronyms   Explanation
          AIS        Antarctic Ice Sheet
          ATBD       Algorithm Theoretical Basis Document
          CCI        Climate Change Initiative
          DEM        Digital Elevation Model
          DInSAR     Differential SAR Interferometry
          DLR        Deutsche Zentrum für Luft- und Raumfahrt
          DTU        Danmarks Tekniske Universitet
          ENVEO      Environmental Earth Observation
          ERS        European Remote Sensing satellite
          GG         Geolocation Grid
          GLL        Grounding Line Location
          GMB        Gravimetric Mass Balance
          GPS        Global Positioning System
          IBE        Inverted Barometric Effect
          InSAR      Interferometric synthetic-aperture radar
          IV         Ice Velocity
          IVonIS     Ice Velocity on Ice Shelves
          IW         Interferometric Wideswath
          LRM        Low Resolution Mode
          MIDAS      Impact of Melt on Ice Shelf Dynamics And Stability
          REAPER     Reprocessing of Altimeter Products for ERS
          REMA       Reference Elevation Model of Antarctica
          RMSE       Root-Mean-Square Error
          RR         Round Robin
          S&T        Science and Technology AS
          SAR        Synthetic Aperture Radar
          SARIn      Synthetic Aperture Radar Interferometry
          SEC        Surface Elevation Change
          SLC        Single Look Complex
          SNR        Signal to Noise Ratio
          SPD        Surface Pressure Difference
          TCOG       Threshold offset Centre Of Gravity
          TUDr       Technische Universität Dresden
          UCL        University College London
          UL         University of Leeds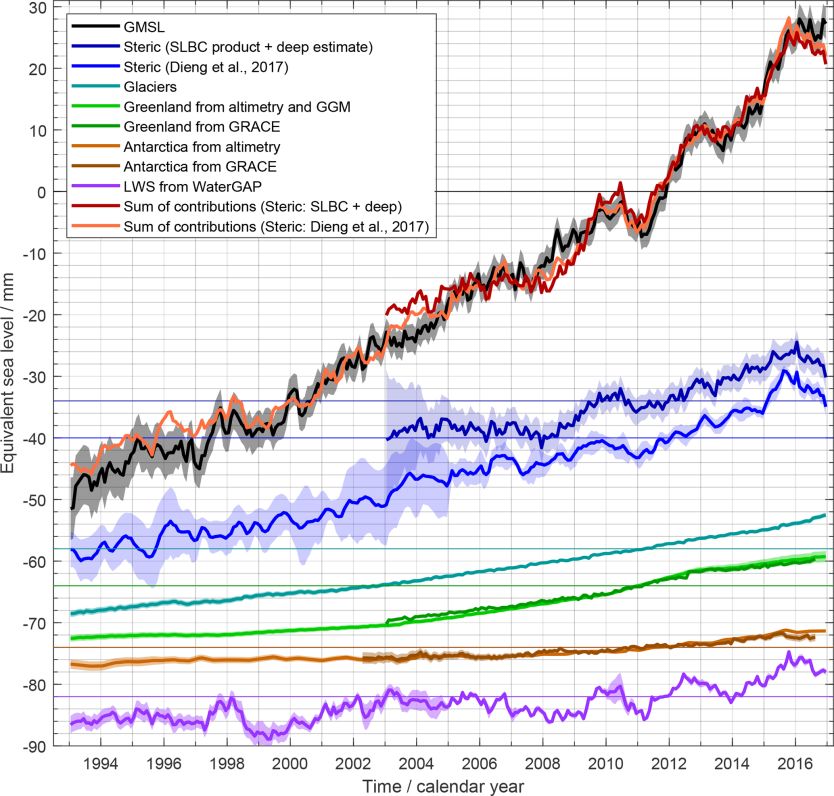
Reference : ST-DTU-ESA-GISCCI+-PMP-001
                                        Greenland_Ice_Sheet_cci+
                                                                                Version   : 1.0               page
                                        Climate Assessment Report               Date      : 04 May 2022       6/30

1 Introduction

1.1 Purpose and Scope
This document contains the Climate Assessment Report (CAR) for the Antarctica_Ice_Sheet_cci
(AIS_cci) project for CCI+ Phase 1, in accordance with contract and SoW [AD1 and AD2].

1.2       Document Structure
This document is structured into an introductory chapter followed by 5 chapters focussed on:

      •   Chapter 2: Overview of the ECV data products produced by the project
      •   Chapter 3: Mass budget of the Antarctic ice sheet
      •   Chapter 4: Process studies related to the Antarctic ice sheet
      •   Chapter 5: Climate Assessment Report recommendations
      •   Appendix Data portals for the AIS_cci+

1.3 Applicable and Reference Documents

                                        Table 1.1: List of Applicable Documents

                                                                                                        Issue/
No        Doc. Id                          Doc. Title                                      Date         Revision/
                                                                                                        Version
AD1       ESA/Contract No.                 CCI+ PHASE 1 - NEW R&D ON CCI ECVS, for         2019.09.30
          4000126813/19/I-NB, and its      Antarctica_Ice Sheet_cci
          Appendix 2
AD2       ESA-CCI-EOPS-PRGM-SOW-18-        Climate Change Initiative Extension (CCI+)      2018.05.31   Issue 1
          0118                             Phase 1, New R&D on CCI ECVs                                 Revision 6
          Appendix 2 to contract.          Statement of Work

Note: If not provided, the reference applies to the latest released Issue/Revision/Version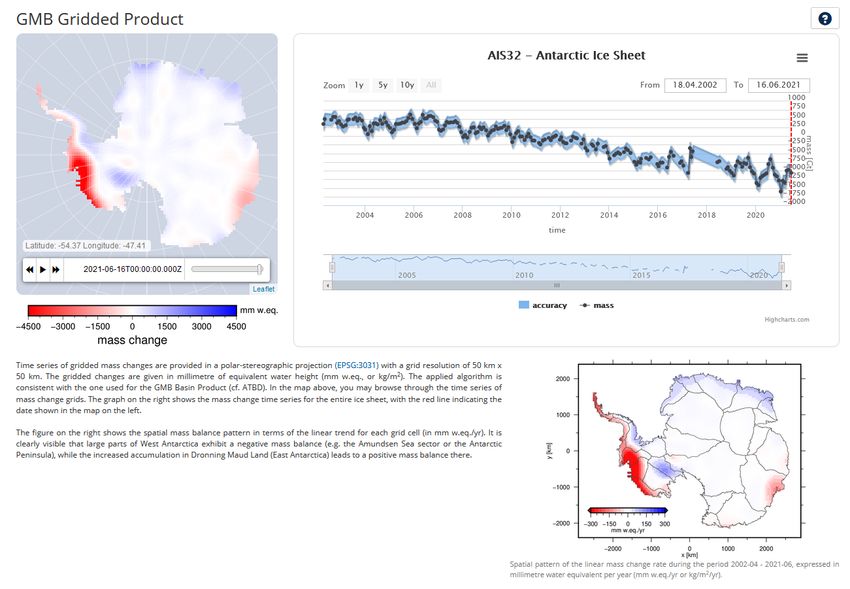
Reference : ST-DTU-ESA-GISCCI+-PMP-001
                                   Greenland_Ice_Sheet_cci+
                                                                       Version   : 1.0               page
                                   Climate Assessment Report           Date      : 04 May 2022       7/30

2 Overview of the ECV data products produced by AIS-cci+

The response of the Antarctic ice sheet (AIS) to on-going climate change and its future evolution are key
issues in research into the impacts of Global Warming. The future of the ice sheet is the key uncertainty in
projections of future sea level rise (Church et al. 2013) because of its potentially unstable retreat and
collapse. Indeed, the AIS is consistently cited as a crucial ‘tipping point’ in the climate system.
The response of the AIS is complicated and difficult to simulate because it responds to climate change in
two contrasting ways which have opposing effects on its mass budget and contribution to sea level. The
first way is by changes in snowfall and ice accumulation which dominate the ice sheet’s Surface Mass
Budget (SMB) because the Antarctic continent is too cold for substantial surface melt. A warming polar
atmosphere is thought to have greater moisture carrying capacity so that warming is expected to be
associated with increased snowfall, a more positive overall mass budget and sea level rise. In contrast, ice
loss to the ocean (either directly by melt from floating ice shelves or as calved icebergs that subsequently
melt) is thought likely to increase with global warming as polar oceans and atmosphere warm. This part of
AIS mass budget is referred to as the dynamic component and is intimately linked to the fate of
Antarctica’s floating ice shelves which currently buttress (i.e., restrain) outflow from the grounded ice
sheet. It is this latter set of processes that are of most concern with the potential for large-scale unstable
retreat of the ice sheet in the Marine Ice Sheet Instability (MISI, Schoof 2007).
The ESA CCi project is designed to provide readily accessible, standardized, easy-to-use datasets to the
climate modelling community. In the current case, the focus is on the sector of this community that
develops and applies glaciological models of the AIS either as standalone models or coupled to different
levels of the climate system ranging from ice sheet-ocean or regional atmospheric-ice sheet models
through to fully coupled Earth system models. For simplicity, we refer to this wide spectrum of users as
the climate modelling community. This service is clearly of very great value to the climate modelling
community because it shields that community from a huge amount of highly technical, time-consuming
work requiring a great deal of technical expertise and satellite-specific knowledge and experience. In this
way the “CCI aims to realise the full potential of the long-term global Earth Observation archives that ESA
has established over the past 30 years, as a significant and timely contribution to the ECV databases
required by UNFCCC” (ESA website).
It is important to note that shielding the modelling community from the challenges of satellite data
processing has huge logistical advantages, however it does mean that many of the assumptions and
uncertainties inherent in this processing are not available to the climate modelling community (i.e., the
data are taken at face value). This is a theme that this report will return to and implies that ECV data
should be accompanied by both realistic assessments of the uncertainty associated with the observations
and sufficient metadata to allow climate modellers to understand the issues associated with the
methodologies used to create the data.
A key part of the CCI mission is to focus effort around a relatively small number of Essential Climate
Variables (ECVs) chosen because they are particularly important in monitoring and understanding the
system under consideration, and crucially because they can be used to constrain models of that system.
The focus on a limited number of ECVs allows the available effort to be focussed and therefore accelerates
the progress that can be made; however it is important to review the selection of ECVs to ensure that they
remain the most useful ones for the climate modelling community.

2.1 AIS-cci+ Essential Climate Variables

The AIS_cci+ project is focussed around the following ECVs. The remainder of this report uses the
acronyms introduced below. We also outline the basic definition of the ECV and motivate its selection in
terms of importance within the AIS system and relevance to climate modelling, as well as giving a
summary of the ECV products available through the associated AIS_cci+ portal.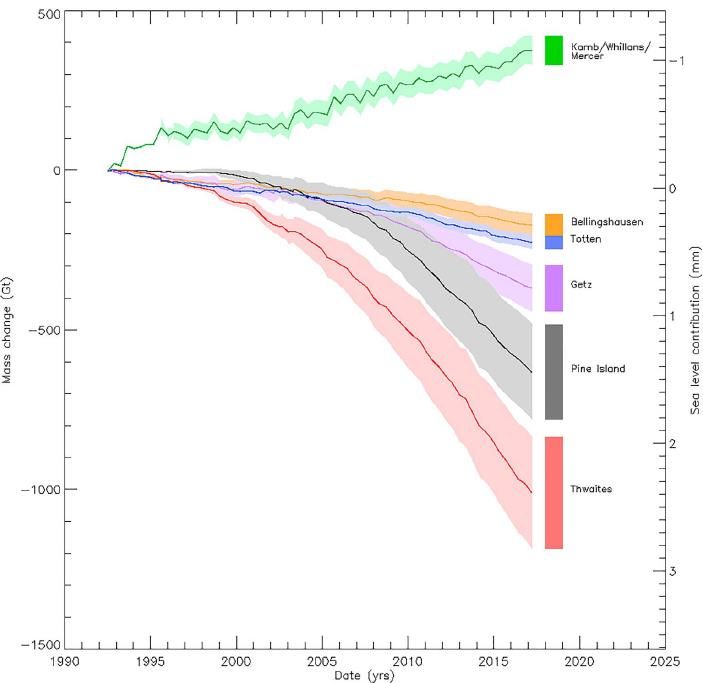
Reference : ST-DTU-ESA-GISCCI+-PMP-001
Greenland_Ice_Sheet_cci+
Version : 1.0 page
Climate Assessment Report Date : 04 May 2022 8/30
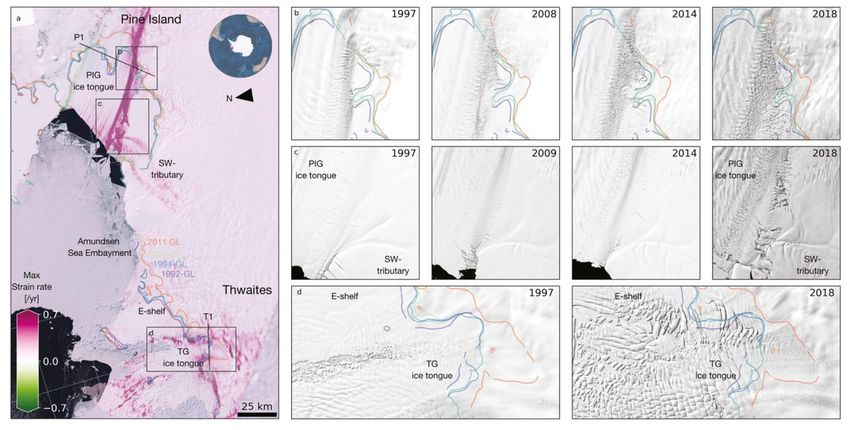
Surface Elevation Change (SEC)
The rate of surface elevation change (units m yr -1) is perhaps the key ECV for ice sheets. It is crucial in
determining their contribution to ongoing sea level change because mass loss from the ice sheet is
primarily associated with changes in ice thickness as opposed to other mechanisms such as a reduction in
ice sheet area. Observations of SEC have also played a fundamental role in the modern understanding of
the causes of change in the ice sheet’s mass budget (e.g., Wingham et al. 1998). Both spatial and
temporal variations in SEC are at the core of our understanding of changing ice-sheet dynamics and SMB.
As such, SEC is a very effective means of testing ice-sheet models.
The AIS_cci+ SEC portal provides SEC observations based on all available ESA Radar Altimetry missions
(ERS-1, ERS-2, ENVISAT, CryoSat-2, Sentinel-3A, and Sentinel-3B) from 1991 to 2021. Data have a
horizontal resolution of 5 km and are provided on a polar-stereographic projection. They are available
either as time-means for the duration of each of the six satellite missions, or as time-means using a
moving averaging window of five years and provided in one-year steps. The portal also provides
uncertainty estimates of SEC (at the same temporal and spatial resolution), as well as ancillary data such
as surface type (grounded or floating, open ocean etc) and catchment basins aiding in the use of the data.
This record extends from a time in the early 1990s when the ice sheet was close to steady state through a
period of dramatic change with first Pine Island Glacier and then Thwaites Glacier in the Amundsen Sea
sector undergoing dramatic mass loss followed by isolated East Antarctic glaciers in the 2000s (e.g.,
Totten Glacier). The availability of an extended time series covering contrasting periods of ice sheet mass
loss greatly enhances the use of SEC as a means of testing and constraining ice sheet models.
Gravimetric Mass Balance (GMB)
Provides a direct observation of ice-sheet mass (units Gt or 1 × 10¹² kg against a reference of 2011-01-
01) based on the satellite gravimetry missions such as the US-German missions GRACE (Gravity Recovery
and Climate Experiment, 2002 to 2017) and GRACE-FO (GRACE Follow-on, 2018 onwards). Direct
measurements of mass addresses one of the main issues in the SEC observations, which is the need to
convert volume to mass using an assumed snow/firn/ice density. The spatial resolution of GMD
observations is, however, limited to 200 to 500 km.
The AIS_cci+ SEC portal provides GMB observations with monthly temporal resolution from April 2002 to
the present day (with quarterly updates). Data are available for both catchment basins and as a gridded
product both with estimates of associated uncertainty. The former spatially integrates GMB over 15 basins.
The latter are provided on a polar-stereographic projection with grid resolution of 50 km and are provided
in units of equivalent water height (mm water equivalent or kg m-2).
Ice sheet Velocity (IV)
While SEC and GMB ECVs are sufficient to monitor the contribution of the Antarctic ice sheet to global sea
level change, they need to be supplemented by observations of additional variables in order to provide an
effective framework for testing models. As outlined above, the response of the AIS to climate change (and
its present and future contributions to sea level) is dominated by an increase in the flow of ice leaving the
ice sheet. This in turn leads to the SEC drawdown as described above. When testing models of the AIS, it
is important to determine that the models reproduce ECV observations for the correct reasons. In the
present case, models should be able to reproduce ice sheet mass budget change (as documented by the
SEC and GMB EVCs) because they are correctly simulating change in the ice sheet’s flow regime. It is for
this reason that Ice Velocity (IV) is included as an ECV. The same is true for Grounding Line location (see
below). Observations of IV also form an important component of the Input-Output Method of estimating
ice sheet mass budget and contribution to sea level change (e.g., Rignot et al. 2019).
The primary data products available within the IV ECV are gridded ice velocity data of the Antarctic Ice
Sheet derived from Sentinel-1 synthetic aperture radar (SAR) data acquired in the Interferometric Wide
(IW) swath mode using feature-tracking techniques. The data products include horizontal velocity
components (m d-1), vertical displacement relative to a digital elevation model, the magnitude of the
horizontal components, the valid pixel count and uncertainty. Data are available for the whole ice sheet at
200 m horizontal resolution for calendar years 2014 to 2022 at monthly temporal resolution (based on 6
and 12-day repeats). In addition, data from earlier phases of the AIS_cci project are available for
individual ice streams such as Evan/Rutford Glacier and Larsen/Fleming Glacier (1992 and 1994 based on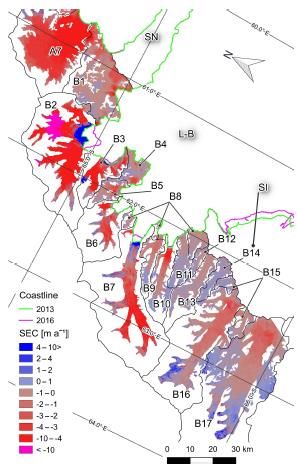
Reference : ST-DTU-ESA-GISCCI+-PMP-001
                                   Greenland_Ice_Sheet_cci+
                                                                      Version   : 1.0               page
                                   Climate Assessment Report          Date      : 04 May 2022       9/30

ERS data), Getz (1994, 1996 and 1998 based on ERS data), the Amundsen Sea Embayment ice streams
(1992, 1994 and 1995/6 based on ERS data) and Pine Island Glacier (2014 to 2019 based on Sentinel-1).
Finally, a useful tool is available to quickly visualise timeseries data for flowlines selected along AIS
glaciers and ice streams.
Grounding Line Location (GLL)
The grounding line of a marine ice sheet, such as WAIS and parts of EAIS, separates floating ice shelf
downstream from upstream ice that is thick enough to ground on the underlying bedrock. It occupies a
central role in modern theories of the response of AIS to climate change and is a key metric for the health
of the ice sheet, with the potential for becoming an early-warning indicator of ice sheet collapse. Mass loss
from coastal sectors of the ice sheet (identified via SEC and GMB) are thought to be linked to drawdown
and increased ice flow (IV), which are ultimately thought to be caused by the landward migration of the
grounding line (Schoof 2007; Payne et al. 2004). This process is seen as the primary response of the ice
sheet to contemporary climate change and continued retreat of the grounding line towards the interior of
the ice sheet is the hallmark of Marine Ice Sheet Instability (Schoof 2007). It is therefore crucial to test
the ice-sheet models used in climate projections using observations from each stage of this chain of

Figure 2.1 Map of the Antarctic ice sheet showing locations of the grounding lines included in the GLL
data product (red).
processes so that we can be confident that the models are simulating mass loss for the correct reasons.
The AIS_cci+ GLL data product provides grounding line locations for many key glaciers and ice streams
(Figure 2.1). Contemporary groundline line migration is focused on areas of fast flow so that it is sensible
to focus effort in these places as opposed to areas where the ground line is stationary. Areas of interest
include much of the WAIS coastline such as the Amundsen Sea Embayment, Marie Byrd Land and
Ellesworth Land, as well as areas adjoining the Larsen ice shelves in the API and significant glaciers in the
EAIS such as Lambert and Totten. Grounding lines are mapped from ERS-1/2, TerraSAR-X and Copernicus
Sentinel-1 data acquired between 1994 and 2021 and are made available as coordinate vectors in ESRI
shapefiles. During this period, much of the mapped groundline is stationary so that multiple locations exist
for only a relatively small number of glaciers, such as the glaciers of the Amundsen Sea Embayment and
Getz regions. A gridded data product (using the IV grid) would be more useful to modelling groups than
the current vector format, although less efficient in terms of storage.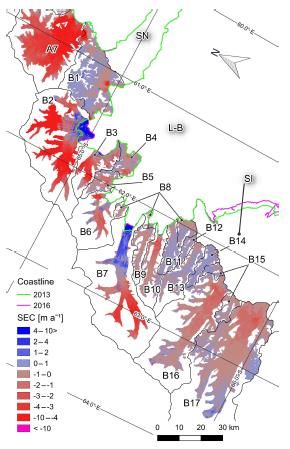
Reference : ST-DTU-ESA-GISCCI+-PMP-001
                                     Greenland_Ice_Sheet_cci+
                                                                      Version   : 1.0               page
                                     Climate Assessment Report        Date      : 04 May 2022      10/30

2.2 Use of ECVs by the community

AIS ECV data products are made available to the community via three portals.

•        SEC through the Centre for Polar Observation and Modelling (UK) [www.cpom.org/data];
•        GMB through the Technische Universität Dresden (Germany) [data1.geo.tu-dresden.de/ais_gmb]; and
•        IV and GLL through ENVEO - ENVironmental Earth Observation IT GmbH (Austria)
         [cryoportal.enveo.at].

    A.

    B.

Figure 2.2 A. Accumulated visitors to ECV data portals and B. ECV product downloads.
Reference : ST-DTU-ESA-GISCCI+-PMP-001
Greenland_Ice_Sheet_cci+
Version : 1.0 page
Climate Assessment Report Date : 04 May 2022 11/30
Figure 2.3 Accumulated visitors and data access to CCI portal.
In all cases, registration is required before the data can be accessed to facilitate the usage monitoring.
Screen captures from each of these portals can be found in the appendix of this report.
Data product usage on these portals shows a continuing positive trend (Figure 2.2). Up to September
2021, the portals had 28,008 visitors and provided 2,074 downloads. IV and GLL are the most visited and
downloaded ECVs (well over 50% in both cases). All ECVs have seen a substantial increase in use since
they were initially made available in Q3 2017. GMB has typically doubled in this period, while IV and GLL
have increased between three and fourfold. SEC downloads have increased by over a factor of ten for
downloads and roughly quadrupled for visitors. Figure 2.3 shows equivalent data for the CCI portal which
only contains samples of the ECV data products.Reference : ST-DTU-ESA-GISCCI+-PMP-001
Greenland_Ice_Sheet_cci+
Version : 1.0 page
Climate Assessment Report Date : 04 May 2022 12/30
3 Mass budget of the Antarctic ice sheet
Measurements of the mass budget of AIS are a key CCI output and are delivered by SEC and GMB ECVs.
The mass budget is of central importance to the modern study of ice sheets, because of its relevance in
understanding contemporary sea level rise. It is therefore the most important constraint (or test) for
models of the ice sheets. Successful testing of these models for the recent past is an essential step
towards generating credible projections of future sea level rise. Here we discuss results for the mass
budget of the entire AIS and how they have been used in both global sea level studies and projections of
the future sea level rise.
3.1 Continental mass budget of AIS
The updated IMBIE (Ice Sheet Mass Budget Intercomparison Exercise) analysis of AIS mass balance
(IMBIE 2018) provides a useful starting point for this summary. This paper employs a methodology
developed from Shepherd et al. (2012) that seeks to reconcile results from three contrasting and
independent methodologies for measuring mass budget (SEC and GMB plus a method based on accounting
the inputs and outputs for individual catchment basins referred to as the IOM). Over the period 1992 to
2017, AIS was found to have contributed 7.6 ± 3.9 mm to global mean sea level (Figure 3.1) with the
contribution from the West Antarctic ice sheet (WAIS) roughly trebling during this time while mass loss
from the small Antarctic Peninsula ice masses (API) increased by just under a factor of five. In contrast,
the East Antarctic ice sheet exhibited a small mass gain although the associated high uncertainty allows
both major mass gains and losses.
This study is crucial to the aims of the ESA CCI programme and exemplifies two features that are
Figure 3.1 Cumulative Antarctic Ice Sheet mass change. The estimated 1σ uncertainty of the
cumulative change is shaded. The dashed lines show the results of a previous assessment of
Shepherd et al. (2012). Source IMBIE (2018).Reference : ST-DTU-ESA-GISCCI+-PMP-001
Greenland_Ice_Sheet_cci+
Version : 1.0 page
Climate Assessment Report Date : 04 May 2022 13/30
important to the use of EO data by the climate modelling community. First, that experts in the relevant
fields have reconciled the methodologies used so that one data set is provided to the modelling
community, who therefore do not have to choose between competing products (most likely based on
incomplete information). Second, all measurements are provided with a coherent estimate of uncertainty
that reflects uncertainties generated throughout the processing chain of the EO data and is therefore
appropriate in judging the fit of models to these data.
Shepherd et al. (2019) extend this analysis by using SEC with the output of a Regional Climate Model
(RCM) of the AIS to disaggregate the two components of observed mass budget change for 1992 to 2017.
These are changes in snowfall distributed over the interior surface of the ice sheet and the dynamic
changes in ice thickness associated with the changing flow of the ice sheet. This reveals the contrasting
dynamics of several major AIS ice streams (Figure 3.2). Separating the contributing of Surface Mass
Balance (SMB, in this case snowfall) and ice dynamics is important for the modelling community because
the types of models used to simulate these processes are different and warrant testing independently.
Figure 3.2 Mass change and sea level contribution of areas in a state of ice dynamical and their
estimated 1σ uncertainty (shaded area). Source Shepherd et al (2019).
Groh et al. (2019) provide a detailed assessment of the impact of the various processing algorithms
available for GRACE gravimetry data in the form of an inter-comparison exercise engaging with the wider
community and using monthly GRACE solution and synthetic data sets. The results were provided by
groups at University of Bristol, TU Delft, DTU Space Copenhagen, TU Dresden and Ohio State University
using a range of filtering techniques, maximum spherical harmonic degree, corrections for Glacial Isostatic
Adjustment (GIA) and methods for relating mass change to basin. This represents an important step in the
development of the AIS_cci+ GMB product and formed the basis for selecting the set of algorithms that
were eventually employed in the creation of the GMB ECV.Reference : ST-DTU-ESA-GISCCI+-PMP-001
Greenland_Ice_Sheet_cci+
Version : 1.0 page
Climate Assessment Report Date : 04 May 2022 14/30
Groh & Horwarth (2021) report the rigorous derivation of the GMB products made available through AIS-
cci+ (see section 2.1) based on the use of tailored sensitivity kernels that minimize mission and leakage
errors and are tested using synthetic data. The analysis provides information on the relative contribution
Figure 3.3 Components (bars) contributing to the overall uncertainty of the mass balance (numbers) for
the final mass change basin products. The overall uncertainty accounts for formal errors from the least-
squares adjustment, for uncertainties of the degree l=1 addition, related to the C20 replacement, of the
glacial isostatic adjustment (GIA) model correction and for leakage errors. Bars indicate the components’
share of the total variance. Source Groh and Horwarth (2021).
of various sources of error (Figure 3.3) to the uncertainty associated with mass change in each basin.
Signal leakage across basin boundaries is particularly important for WAIS basins (01, 20–24, 27), while
GIA model correction is the dominant source of error in the basins of EAIS (02-17) and the Siple Coast
region of WAIS (18-19). Larger basins also suffer from uncertainties in auxiliary data sets (e.g., C20 the
Earth’s oblateness and l=1 spherical harmonic degree). Finally, mass changes are shown to be consistent
with estimates based on SEC, but not with estimates from IOM (e.g., Rignot et al. 2019).
The concept of combining SEC and GMB datasets into a single product is further developed by Sasgen et
al. (2019). Here GRACE and GRACE-FO data (GMB) are combined with CryoSat-2 measurements (SEC) for
2011 to 2017 (when both were operational) in a way that accounts for the differing spatial resolution and
signal and noise characteristics of each satellite. In the resultant data set for the whole AIS, GMB has the
dominant contribution at spatial scales greater than 100 km with SEC becoming increasingly important at
smaller scales between 100 and 4 km. This technique combines the strengths of the two observational
systems to provide the modelling community with a single product for which uncertainty is assessed
through the processing chain of both sensors.Reference : ST-DTU-ESA-GISCCI+-PMP-001
Greenland_Ice_Sheet_cci+
Version : 1.0 page
Climate Assessment Report Date : 04 May 2022 15/30
3.2 Applications of AIS mass budget products
The SEC and GMB products are a very valuable resource to the wider community, in particular for
researchers working on monitoring contemporary and projecting future sea levels. For example, they
underpin the Slater et al. (2021) assessment of the state of the global store of ice (including glacier, ice
sheets, floating ice shelves and sea ice) which concludes that a total of 28 trillion tonnes of ice has been
lost between 1994 and 2017 but that the energy required to melt this amount of ice only amounts to 3%
of the global energy imbalance during this time. Schuckmann et al. (2020) reach a similar conclusion.
Horwath et al. (2022) make use of several ESA CCI products (including SEC and GMB) in their
comprehensive assessment of the global sea-level and ocean-mass budgets. A very important advance in
this work is the improvement in uncertainty characterization for the individual components of the ocean
mass budget (i.e., glaciers, ice sheets and land water storage), the sea level budget (including steric
effects) and sea level observations themselves (via ESA Sea Level CCI+). Horwath et al. (2022) show that
these budgets can be closed within their assessed uncertainties for the periods 1993-2016 and 2003-2016
(Figure 3.4) with a mismatch of between only -6 and +6% of global mean sea rise.
Figure 3.4 Time series of sea level budget elements involving the individual contributions to ocean-
mass change. Each graph shows anomalies with respect to a mean value over 2006–2015. Graphs
are shifted arbitrarily along the ordinate axis. Standard uncertainties are shown by transparent
bands (except for the sum-of-contribution graphs). Source Horwath et al (2022).Reference : ST-DTU-ESA-GISCCI+-PMP-001
Greenland_Ice_Sheet_cci+
Version : 1.0 page
Climate Assessment Report Date : 04 May 2022 16/30
The impact of AIS mass loss on the orientation of the Earth’s spin axis (polar wander) is assessed by Göttl
et al. (2021) by combining GMB and SEC products to reduce systematic and random errors. They show
that changes in AIS mass can account for around 45% of the observed polar wander (excluding GIA) with
the various sectors of the AIS contributing differently to the interannual variability of polar wander.
Finally, SEC and GMB products (via the IMBIE exercise) played an important role in projections of the
contribution of the AIS to future sea level rise (Seroussi et al. 2020, Edwards et al. 2021, Payne et al.
2021) performed within the ISMIP6 model intercomparison project and subsequently used in the Sixth
Assessment Report of the IPCC (Fox-Kemper et al. 2021). This work highlighted issues in creating
appropriate initial conditions for ice sheet models and matching simulations of the recent historical period
to future projections. The latter is complicated by the very significant interannual variability in the forcing
experienced by ice sheets.
A particular aspect of the response of AIS to future climate change is that two competing processes are
involved (Edwards et al. 2021, Payne et al. 2021). The first is associated with increased moisture-carrying
capacity of a warmer polar atmosphere increasing snowfall; while the second is associated with the effects
of a warmer atmosphere and ocean on ice melt and the stability of AIS’ floating ice shelves. It is therefore
essential that models are tested rigorously using a range of data that discriminate between these two
competing effects. The disaggregation of SMB and ice dynamical effects discussed above (Shepherd et al.
2019) is an important step forward, as is the use of a wider range of AIS ECVs such as IV and GLL
discussed in Section 4. This is necessary to ensure that models reproduce the observed SEC and GMB
ECVs for the correct reasons. As an example, Slater et al. (2020) compare the trajectories of ice loss (for
both AIS and the Greenland ice sheet) from observations (IMBIE 2018) and the previous IPCC Fifth
Assessment Report (Stocker et al. 2013) for the period in which the two overlap (2007-2017) to show that
the observations are most consistent with the upper end of the IPCC projections. Disaggregation of both
observations and projections into SMB and ice dynamics suggests that this is primarily associated with an
overprediction of the impact of atmospheric warming on snowfall.
3.3 Summary of AIS mass budget
• SEC and GMB data products are readily available to the community through data portals managed
by AIS_cci+
• These products played an important role in international modelling efforts geared toward making
projections available to the IPCC
• They have also stimulated a range of studies geared to understanding contemporary sea level rise
and its impacts
• Two aspects of the AIS_cci+ approach are particularly welcome by the modelling community: the
focus on incorporating rigorously derived estimates of uncertainty and the move toward providing
single, reconciled data sets for an individual variable (as opposed to a range of competing
products).Reference : ST-DTU-ESA-GISCCI+-PMP-001
Greenland_Ice_Sheet_cci+
Version : 1.0 page
Climate Assessment Report Date : 04 May 2022 17/30
4 Process studies related to the Antarctic ice sheet
4.1 Dynamics of glaciers and ice streams
An exciting feature of the AIS_cci+ project is the incorporation of other ECVs that provide insight into the
processes that affect the mass budget of the ice sheet and its component parts. An excellent example of
this approach is Selley et al. (2021) who focus on the poorly studied Getz region of the WAIS.
Observations of IV, SEC and GLL using a range of satellites for 1994 and 2018 (Figure 4.1) are used
determine the mechanisms responsible for the growing rates of mass loss from this sector with the aim of
determining the forcing mechanisms at pay. The cause of mass loss from the region is determined as
primarily dynamical (roughly two thirds over the whole period) as opposed to SMB related, although
decreases in snowfall become important towards the end of period. Their results show a mean increase in
speed of 23.8 % between 1994 and 2018, with three glaciers accelerating by over 44 % with a
contribution of 0.9 ± 0.6 mm to global mean sea level. An interesting feature of this work is the use of an
ice sheet model operating in data assimilation mode to both fill in gaps within the IV data product and
determine the influence of changing ice rheology and lubrication at the ice sheet on ice flow in the area.
Changes in the long-term response to ocean temperature are determined to be the most likely driving
mechanism for dynamical change in this area, which increase melt from the underside of the area’s ice
shelves in turn thinning them and reducing their buttressing effect. The model inversion suggests that this
thinning is associated with a mechanical weakening of the ice shelves perhaps brought on by increased
damage through crevasse formation.
Rott et al. (2018) combine SEC and IV data product to assess changes in the glaciers draining into the
former Larsen A and B ice shelves between 2011 and 2016 (Figure 4.2). These glaciers are of interest
because they are still responding to the partial collapse of Larsen A in 1995 and Larsen B in 2002. They
therefore give insight into the longer-term response of glaciers to ice-shelf collapse which is a process
likely to affect the glaciers and ice streams of mainland Antarctica in the coming centuries. They find that
not all glaciers respond in the same way and that mass loss is focussed on just two glaciers in the area
(Drygalski Glacier and Hektoria/Green Glacier). In line with theory, mass loss is associated with increases
in ice velocity (drawdown) and is found to decrease through time to the extent that rates of loss in 2013-
2016 are rough half those of 2011-2013. Mass loss is also found to be closely linked the detailed extent of
ice-shelf collapse, with one ‘control’ region that did not experience collapse experiencing very much
reduced rates of mass loss. They find that recent mass loss via iceberg calving has slowed because of the
presence of sea ice and ice mélange in the area’s fjords. This latter finding is developed further by Rott et
al. (2020) using SEC and IV data products to show that marginal glacier and ice shelf velocities are
primarily controlled by frontal stress concentrations arising from sea ice and ice mélange motion.
Another important control on the flow of AIS is the influence of the subglacial hydrology and its impact on
traction at the ice sheet bed. Malczyk et al. (2020) use changes in SEC to monitor the drainage of
subglacial lakes under the Thwaites Glacier, WAIS. The area’s subglacial drainage system is shown to
comprise a system of interconnected lakes that drain as a cascade initiated by the most upstream lake.
This system appears to evolve rapidly so that the pattern of drainage in the study’s 2017 event is
markedly different from the preceding event in 2013.Reference : ST-DTU-ESA-GISCCI+-PMP-001
Greenland_Ice_Sheet_cci+
Version : 1.0 page
Climate Assessment Report Date : 04 May 2022 18/30
Figure 4.1 A. Ice speed in the Getz drainage basin of Marie Byrd Land, measured in 2018 using data
acquired by the Sentinel-1a/b satellites. The grounding line location (solid black line), inland limit of the
drainage basin (solid grey line) and the location of 14 flow line profiles (dashed black lines) are also
shown. B. A map of the observed rate of change in ice speed between 1994 and 2018. C. Ice sheet
elevation change from 1992 to 2017, measured using satellite radar altimetry data. The calving front
location is shown from 2009 in yellow to 2019 in purple. Source Selley et al. (2021).Reference : ST-DTU-ESA-GISCCI+-PMP-001
Greenland_Ice_Sheet_cci+
Version : 1.0 page
Climate Assessment Report Date : 04 May 2022 19/30
Figure 4.2 (a) Map of surface elevation change (SEC, m yr −1) from May–June 2011 to June–July 2013 on
glaciers of the Larsen B embayment. (b) as (a) for June–July 2013 to July–August 2016. Source Rott et al.
(2018)
4.2 Ice shelves
Changes in Antarctica’s floating ice shelves are believed to be a trigger for much of the recent mass loss
from the grounded ice sheet. Studying these changes is therefore of great relevance to both
understanding contemporary mass loss and predicting the future dynamics of the ice sheet. Two sets of
processes are of particular concern, which are reductions in their mechanical strength and iceberg calving
both of which affect the ability of an ice shelf to restrain (buttress) the flow of upstream grounded ice.
De Rydt et al. (2018) use IV to determine the effective strain rates around an active rift in the Brunt ice
shelf, EAIS. They then use a numerical model of ice flow to invert these observed velocities to find the ice
shelf’s underlying stress field by minimizing the mismatch between observed and modelled ice velocity.
The observed rift is shown to propagate along a trajectory defined by the maximum tensile stress. The
predicted future trajectory of the rift suggests that it may reduce buttressing with implications for future
dynamical mass loss from the ice sheet. De Rydt et al. (2019) extend this analysis back in time through
the last two decades. They show that rift formation and iceberg calving are in fact cyclic and driven by
changes in ice shelf geometry that set in place the stress regime leading to rift formation and calving.
These papers are important because of the abundant data available for the Brunt ice shelf and the
interaction between geometry and rifting provide a ‘natural laboratory’ to understand the controls on ice
fracture and iceberg formation and generate predictive models of these processes.
Wuite et al. (2019) map the evolution of the calving front location for the Filchner-Ronne ice shelf, WAIS,
between 2011 and 2018. They use Swath Mode CryoSat-2 altimetry and an edge-detection algorithm to
map the calving front and find that the Filchner-Ronne is gradually advancing at a rate of 800 km2 yr-1 withReference : ST-DTU-ESA-GISCCI+-PMP-001
Greenland_Ice_Sheet_cci+
Version : 1.0 page
Climate Assessment Report Date : 04 May 2022 20/30
the forward motion of ice exceeding calving rates of between 7±1 Gt yr -1 and 9±1 Gt yr-1. Interestingly,
these observed rates of calving are estimated to be of an order of magnitude less than their steady-state
calving fluxes.
Lhermitte et al. (2020) study damage to the Pine Island Glacier and Thwaites Glacier in the Amundsen Sea
Embayment, WAIS. Combining IV and SEC data products and numerical modelling (Figure 4.3), they show
that recent increases in the flow of these glaciers has led to increased damage focused on their shear
margins (highly crevassed areas separating the flanks of fast-flowing ice streams from the adjacent slow-
flowing ice). This introduces a potentially important positive feedback that may hasten the retreat of these
glaciers and their future contribution to sea level.
Figure 4.3 Elevation and thinning rates over Pine Island Glacier area. (A–E) ASTER satellite digital
elevation model from January and February 2018 showing the elevation of PIG (A, C, and D) and TG (B
and E) ice shelves and the damage areas in the thinner areas. Gray values are masked no data values.
Zoom boxes, transects [P1, T1], and grounding line evolution since 1992 (40) are illustrated in black and
spectral colours, respectively (see Fig. 1). (F–J) Elevation changes (2010 to 2017) derived from Cryosat-2
satellite altimetry data showing thinning over the glaciers and ice shelves in combination with the local
advection of patches of thicker ice. (H–J) Zoom areas corresponding to boxes in F and G. Source
Lhermitte et al. 2020.
4.3 Grounding lines
The location of the point separating ice grounded on bedrock and floating ice shelves (the grounding line)
is a crucial indicator of the stability of an ice sheet. Perhaps more so than any other AIS_cci+ ECV, GLL
can be determined using a variety of methodologies (Freidl et al 220) including techniques based around
the spatial extent the ice shelf deflection caused by the tides; identification of ice-surface features such as
breaks of slope or characteristic pattens in velocity; and the straight-forward hydrostatic balance of the
ice. Hogg et al. (2018) present a method based on mapping breaks in surface slope, which has the
advantages of being automatic and computational efficient allowing most of the AIS coastline to be
monitored regularly. The new method performs well when compared to more sophisticated measurements
based on mapping tidal deflection using the quadruple-differencing of synthetic-aperture radar
interferometry (Figure 4.4).Reference : ST-DTU-ESA-GISCCI+-PMP-001
Greenland_Ice_Sheet_cci+
Version : 1.0 page
Climate Assessment Report Date : 04 May 2022 21/30
Konrad et al. (2018) use a method based on the groundling line’s hydrostatic equilibrium to estimate rates
of grounding line motion from SEC combined with knowledge of ice-surface and bedrock slopes. When
applied to the whole AIS, the method shows an overall reduction in grounded area of 1463 ± 791 km 2.
Retreat is most prevalent for the WAIS (22% of all surveyed groundling lines) which is roughly double the
rates observed for API and seven times greater than EAIS rates.
Figure 4.4 CryoSat-2 break in surface slope in the Filchner-Ronne Ice Shelf (a), Amundsen Sea sector (b),
Larsen-C Ice Shelf (c) and Ekström Ice Shelf (d) study areas, colour scaled to show mean absolute
separation from mapping tidal deflection using interferometry. Source Hogg et al. (2020)Reference : ST-DTU-ESA-GISCCI+-PMP-001
Greenland_Ice_Sheet_cci+
Version : 1.0 page
Climate Assessment Report Date : 04 May 2022 22/30
4.4 Summary of process studies
• IV and GLL provide extremely useful additions to the SEC and GMB data products
• They have demonstrated their use in understanding on-going change in the mass budget of AIS
and attributing it to specific mechanisms, in particular related to the dynamics of fast-flowing ice
and floating ice shelves
• As such they have the potential for providing a tighter, more exacting set of constraints for ice-
sheet models than SEC/GMB aloneReference : ST-DTU-ESA-GISCCI+-PMP-001
Greenland_Ice_Sheet_cci+
Version : 1.0 page
Climate Assessment Report Date : 04 May 2022 23/30
5 Climate Assessment Report recommendations
5.1 General recommendations
First and foremost, the AIS_cci+ project has delivered essential data products to the scientific community
working on the impacts of climate change on the Antarctic ice sheet and its resultant contribution to global
sea level rise. Both visits to and downloads from the project’s various data portals have continually
increased over the duration of the project. The data products themselves have been used by the research
communities working on both modelling contemporary and future mass loss from the ice sheet, and those
seeking to understand the contributions to and impacts of contemporary sea level rise. On the whole, the
data products are well documented and easily available to the wider community.
Particularly innovative uses of the basic ECVs include the rigorous assessment of uncertainty in data
products and the combination of ECVs to develop higher-level data products such as reconciled mass
budget products and separation of the SMB and dynamic contributions to the mass budget. This may also
be an opportunity to work more closely with other ESA CCIs, for instance in monitoring contemporary sea
level rise and its contributing parts, and understanding the regional climate forcing responsible for ice
sheet change (as monitored by the four ECVs of the AIS_cci+).
Looking forward, three overlapping uses can be envisioned for the ECV data products. The first and
original use is to serve the needs of the community modelling the AIS either using standalone ice sheet
models or, increasingly, using such models as components of fully coupled Earth System Models. This
community benefits from a well-defined data products with associated robust uncertainty estimates for
testing and validating their models. In this context, it is very helpful to have a single data product for an
ice sheet variable and we return to this point below in the context of reconciling competing methodologies
attempting to quantity the same variable (e.g., mass budget).
The second use of ECVs is in monitoring and understanding the causes for contemporary SLR. For this
community, the focus is on data that integrates the mass budget of Antarctica as a whole rather than the
gridded data products that are of most use to the modelling community. In this context, the methodology
used to fill gaps in data coverage becomes important.
A potential third use is as an indicator providing early warning of rapid mass loss that would lead to high-
end rates of global sea level rise. GLL is clearly one such early warning indicator and rapid rates of
grounding line retreat would certainly be a cause of great concern, potentially presaging the collapse of
the ice sheet; however, the importance of GLL is very much linked to collapse by the Marine Ice Sheet
Instability and other mechanisms leading to rapid loss have recently been proposed. We return to this
theme below in proposing additional ECVs to provide earning warnings for these new mechanisms.
On the whole, the data products provided by AIS_cci+ are of very high quality and are widely used by the
target modelling communities. Here we discuss some technical issues related to the data products
themselves.
The focus on products that cover the whole ice sheet is particularly welcome and the resolution of the
gridded data products is adequate for their use in these communities. There might be a case for providing
IV at the same resolution as SEC (5 km) in addition to the current 200 m resolution. There may also be a
case for developing an algorithm for filling holes in the sometimes spatially incomplete IV data products
using data assimilation methods with an ice flow model. Having SEC/GMB, IV and GLL as ECVs potentially
allows for very detailed verification of models of the AIS, so that the modelling community can be assured
that their models are producing the right answer (in terms of sea level contribution) for the right reasons
(related to both SMB and ice dynamics). Clearly, this approach requires that the individual EVC data
products are consistent with one another.
The GLL data product is perhaps the least developed of the ECVs and is the hardest to acquire. Thought
should be given to providing this as a gridded data set (in the way of the other ECVs), rather than the
current vector format, which would be easier for the modelling community to use. More detailed
accompanying metadata would also be useful. The monthly temporal resolution of many of the ECVs is
welcome and will be particularly useful in understanding aspects of the ice sheet with strongly seasonal
components (primarily related to snowfall and melt). We discuss the need to extend the data products inReference : ST-DTU-ESA-GISCCI+-PMP-001
Greenland_Ice_Sheet_cci+
Version : 1.0 page
Climate Assessment Report Date : 04 May 2022 24/30
time below. Finally, given the wide range of methods that are used to map grounding-line location (Friedl
et al. 2020) which are based on characterising different features of the grounding line (e.g., hinge point,
break of surface slope, point of hydrostatic balance etc), an intercomparison of methods (of the sort
conducted by Groh et al. 2019 for GMB) might be a valuable step towards defining the GLL ECV
methodology.
Finally, thought should be given to the relationship between AIS_cci+ and other providers of satellite-
based data products most notably NASA’s Making Earth System Data Records for Use in Research
Environments (MEASURES) programme. While there is some virtue in competition between these two
enterprises, it does leave the modelling community with a difficult choice between two sets of data
products that, superficially, appear similar. This is unfortunate given that ESA and NASA researchers
typically collaborate very well. Potential ways forward include developing guidance documentation that
covers all of the available data products (ESA and NASA primarily but also others) and explains their
strengths, weaknesses and potential uses. This may lead to a high-profile summary paper. Another aspect
of viewing the CCI and MEASURES initiatives in a more integrative fashion would be the identification of
further data products that are complimentary rather than competitive. Examples here might be the higher-
level, integrative data products discussed above.
Summary
• The AIS_cci+ has delivered essential data products to the scientific community working on the impacts
of climate change on the Antarctic ice sheet
• The data products are well documented and easily available to the wider community
• Innovative uses of the basic ECVs include the rigorous assessment of uncertainty in data products and
the combination of ECVs to develop higher-level data products
• Consideration should be given to the interaction of CCIs with other similar international programmes
• The temporal and spatial resolution of the ECV data products is adequate for user needs however
thought should be given to ensure greater consistency between the products
• Consideration should be given to further developing the GLL data product, for instance by way of an
intercomparison of methodologies
5.2 Potential additional ECVs
The AIS_cci+ provides four ECVs currently: SEC, GMB, IV and GLL. As discussed in this report, all four
provide important insights into the response of the AIS to climate change and should be continued. There
is, however, scope for expanding the work of the AIS_cci+ in three main areas.
First, the importance to the modelling community of having a single data product available for a particular
variable has been stressed in this report. This is particularly important in cases where a number of
different methodologies can be used to estimate a particular quantity, such as the mass budget of the ice
sheet. Providing a single product that reconciles differences between methodologies and provides a robust
assessment of uncertainty (with accompanying metadata) is therefore of great value. The AIS_cci+ has
been particularly forward thinking and innovative in this respect (IMBIE 2018; Horwath et al. 2022).
Building on this AIS_cci+ expertise, we recommend adding a reconciled mass budget ECV to complement
the existing SEC and GMB ECVs. The existing ECVs have important uses (i.e., understanding and
attributing the causes of change) outside of their use in mass budget studies and should be continued in
addition to this new ECV. A possible further extension of this new ECV is the disaggregation of the
reconciled mass budget signal into its component SMB and dynamical parts, which again is a technique
that AIS_cci+ has pioneered (Shepherd et al. 2019) and will offer a more stringent test for climate and ice
sheet models.
Second, the strength of the climate model tests made possible through the use of ECVs increases with the
length of these records. Clearly, continuation of the ECVs into the future is one way of extending this
record, however consideration should also be given to extending this record backwards in time in as far as
this is possible. Many of the current ECV data products are available with monthly temporal resolution,Reference : ST-DTU-ESA-GISCCI+-PMP-001
Greenland_Ice_Sheet_cci+
Version : 1.0 page
Climate Assessment Report Date : 04 May 2022 25/30
which is represents a good compromise that allows potential important seasonal fluctuations in both SMB
and dynamics to be investigated.
Third, recent literature on high-end sea level rise scenarios focuses on the potential for rapid change in the
AIS. Three main mechanisms are discussed within this context. The first is well known and has been
researched over much of the last decade. This is the impact of warm water masses migrating into the
ocean cavities underneath the floating ice shelves and potentially causing dramatic increases in their melt.
While not directly measurable from satellite, this melt can be calculated with information on the velocity
(IV) and mass budget (SEC) of an ice shelf (in addition to information on surface snow accumulation and
melt available from RCMs). A data product for ice-shelf melt would be of great use to the modelling
community in incorporating these processes into models. Similarly, and given the importance of ice
shelves in modern theories of ice sheet response to climate change, it would be highly desirable to extend
the SEC data product to include ice shelves (currently grounded ice only) although it is accepted that there
are additional complications, such as tides, that make this technically challenging.
The second high-end mechanism is the onset of surface melt over the ice shelves of the AIS. Melt ponds
have been linked to the collapse of several ice shelves in the API and associated increases in the flow of
adjoining grounded glaciers. Their presence is likely to provide an early warning of similar processes
affecting the large ice shelves of WAIS and EAIS. Information on melt ponds is readily available from
satellite observations and should be considered as an additional ECV.
The final high-end mechanism is the mechanical weakening of ice leading to an acceleration of ice flow.
While not directly observable by satellite, ice rheology can be determined from IV by the use of data
inversion and assimilation techniques (e.g., Selley et al. 2021). Most of the mechanical weakening or ice
damage discussed in the literature is, however, linked to crevasse formation which can be observed by
satellite-borne sensors with the appropriate (high) spatial resolution.
In making these recommendations for additional ECV datasets, this report is conscious that most (with
exclusion of the melt pond and crevasse ECVs) are not traditional satellite products but rather would
require the extended analysis of existing products (SEC, GMB, IV etc) and closer links to modelling
community employing data assimilation and inversion methodologies.
Summary
• Consider development of compound data products such as reconciled mass budget and disaggregated
SMB and dynamics
• Consider extension of EVC time series both forwards and backwards in time where appropriate
satellite-bore sensors available
• Consider additional ECVs geared towards early-warning indicators such as sub-ice-shelf melt rates,
surface melt ponds and ice damage as exemplified by crevassing, as well as extending SEC to include
ice shelves
5.3 Outreach and communication
The excellent ECV data products created by AIS_cci+ could usefully be linked to the Earth System Model
Evaluation Tool (ESMValTool) initiative. ESMValTool has previously focused on more traditional global
climate data sets linked to the atmosphere, ocean and land surface, and includes CCI-related diagnostics
such as land-surface temperature, greenhouse gas concentrations, water vapour, sea surface salinity and
ocean colour. More recently, this remit has widened to include other aspects of the climate system and
there is increasing interest in the ice sheets. Working with ESMValTool to incorporate ice sheet diagnostics
based on AIS_cci+ ECVs would therefore be a logical next step and further strengthen the use of these
ECVs by the climate and ice-sheet modelling communities.
The AIS-cci+ teams are well integrated into the international glaciological research community and are
involved in a wide range of EU and national projects. The team should continue this high level of
engagement and activity seek collaborations in forthcoming funding opportunities. Research on ice sheetYou can also read