Environmental monitoring following the Grenfell Tower fire - Data update 9 June 2022
←
→
Page content transcription
If your browser does not render page correctly, please read the page content below
Environmental monitoring following
the Grenfell Tower fire
Data update
9 June 2022
Environmental monitoring following the Grenfell Tower fire: data update 9 June 2022

Contents
Overview ..................................................................................................................................... 3
Background to monitoring ........................................................................................................... 4
Monitoring locations .................................................................................................................... 4
Particulate matter monitoring and results .................................................................................... 5
Asbestos monitoring and results ............................................................................................... 12
Appendix 1. Monitoring locations summary............................................................................... 16
Appendix 2. Health information ................................................................................................. 20
   Particulate matter .................................................................................................................. 20
   Asbestos ................................................................................................................................ 20

                                                                       2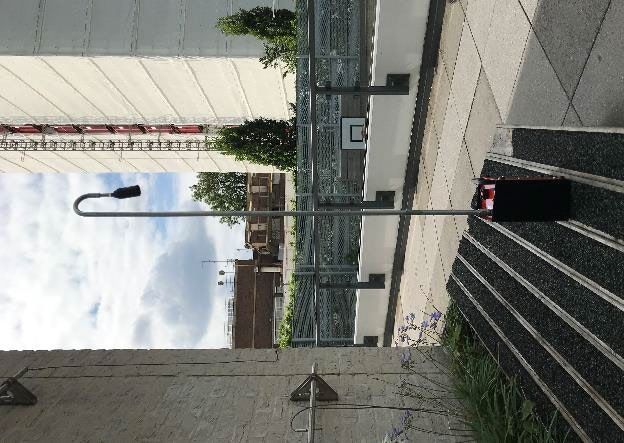
Environmental monitoring following the Grenfell Tower fire: data update 9 June 2022

Overview
UK Health Security Agency (UKHSA) (formerly Public Health England) has been assessing and
monitoring air quality in the area surrounding Grenfell Tower since the start of the fire on 14
June 2017. Initial risk assessments carried out in conjunction with partner agencies focussed
on the smoke plume which rose upwards rapidly and was carried in a northerly direction by the
wind. This meant that there was a low risk of impact on local air quality from the fire.
Assessment of data from The London Air Quality Monitoring network was used to confirm the
initial risk assessment that levels of particulate matter were low, and remained so over the next
10 days.

UKHSA started additional monitoring of air quality close to Grenfell Tower on 24 June 2017. A
range of pollutants have been monitored: particulate matter, asbestos, dioxins, furans, dioxin-
like polychlorinated biphenyls (PCBs) and polycyclic aromatic hydrocarbons (PAHs). These
have the potential for short and long term health effects and by measuring them we can
understand if there is a risk to health. Particulate matter monitoring runs continuously, whilst
other samples are collected over a period of time and need to be sent away for analysis.

The monitoring strategy has been agreed with partners within a multi-agency monitoring group.
The samples are collected and analysed by an independent environmental company and the
results are assessed by UKHSA specialist environmental public health scientists.

The air quality monitoring strategy is regularly reviewed based on activities around the site and
may be adapted. During summer 2018, following the covering of the tower, the strategy
changed and monitoring for dioxins, furans, PCBs and PAHs stopped as these chemicals were
no longer likely to be released.

Results to date have shown that levels of particulate matter remain low and asbestos
monitoring results indicate levels at or below the limit of detection in areas surrounding Grenfell
Tower. Average results, over the 13 months of monitoring, for dioxins, furans and dioxin-like
PCBs and PAHs showed levels comparable to background levels for London. Current
evidence, therefore, suggests the risk to public health from air pollution remains low.

Monitoring for particulate matter will continue to provide a baseline level, and ensure we are
able to assess any impacts on air quality as and when any further activity takes place on the
site. This report covers the last 4 weeks of results and environmental monitoring data is shown
alongside an explanation of the data in terms of potential impacts on health. For all monitoring
results between 24 June 2017 to 29 December 2021, see the Environmental monitoring
following the Grenfell tower fire report dated 29 December 2021.

                                                       3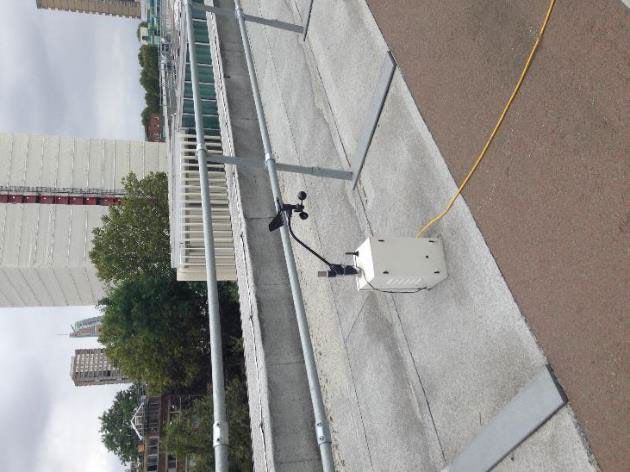
Environmental monitoring following the Grenfell Tower fire: data update 9 June 2022
Background to monitoring
UKHSA has been assessing and monitoring air quality in the area surrounding Grenfell Tower
since the fire started. During the initial stages of the fire the main focus for the assessment was
on the smoke plume, which rose upwards rapidly and was carried in a northerly direction by the
wind. The London Air Quality Monitoring network was used to assess impacts from particulate
matter (PM10) within the smoke plume on air quality in the surrounding area and further away.
Further details of this initial assessment is outlined in the Environmental monitoring following
the Grenfell tower fire report dated 29 December 2021.
UKHSA has reviewed the evidence on the contents of smoke plumes after fires. Although each
fire will have specific characteristics, there are common chemicals which are usually released
in smoke, such as particulate matter which can be used as a marker for other emissions.
UKHSA commissioned monitoring for particulate matter, asbestos, dioxins, furans. PCBs and
PAHs. Fires are not the only source of these contaminants; there are other sources in the
environment, for example traffic and industrial sources. However, it is important to ensure that
the fire had not resulted in significantly higher levels of these chemicals in the local area, and to
also ensure that as work is undertaken on the site, it does not result in notably elevated levels
of these contaminants.
During summer 2018, activity on the site was reduced following the covering of the tower.
Therefore, the monitoring strategy changed to stop monitoring for dioxins, furans, PCBs and
PAH as the risk assessment determined that these chemicals are no longer likely to be
released. However, monitoring for particulate matter and asbestos continues. Due to the
coronavirus pandemic, there was a temporary pause in asbestos monitoring between March
and August 2020, but this restarted on the 26 August 2020.
Monitoring for particulate matter will continue to provide a baseline level and ensure we are
able to assess any impacts on air quality as and when any further activity takes place on the
site.
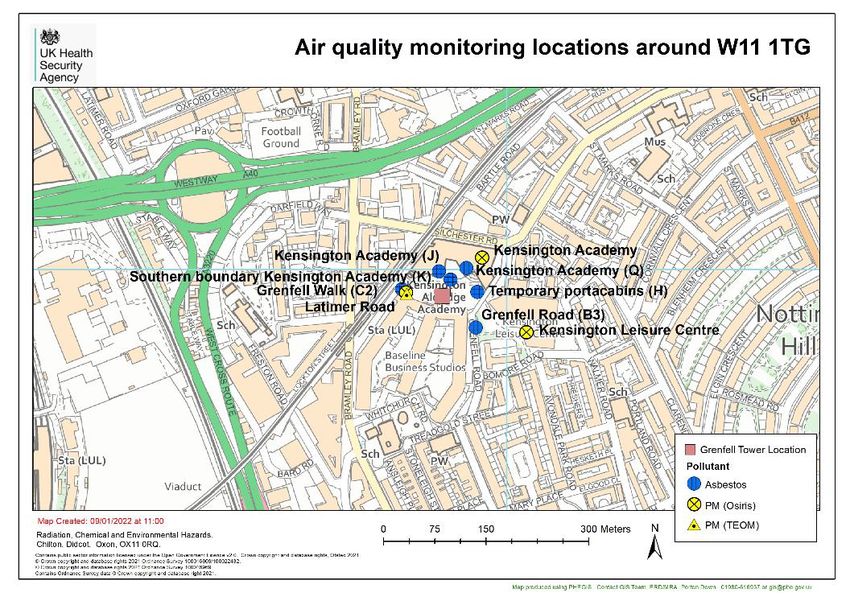
Monitoring locations
The monitoring locations have moved over time as the site cordon and activities on site have
changed. For example, for asbestos, monitoring points will be moved around the site to ensure
good coverage based on site activities. The map will be updated to show the current
monitoring locations. Further details and pictures showing the monitoring locations can be
found in Appendix 1.
4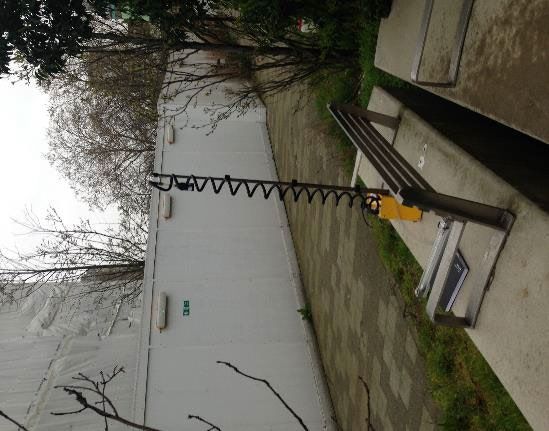
Environmental monitoring following the Grenfell Tower fire: data update 9 June 2022

Figure 1. Map showing the W11 1TG postcode area and the current UKHSA particulate
matter and asbestos monitoring locations

Particulate matter monitoring and results
UKHSA introduced continuous monitoring for particulate matter in close proximity to Grenfell
Tower on 24 June 2017 at 3 locations (Kensington Aldridge Academy; Kensington Leisure
Centre and Blechynden Street). A fourth monitoring site for particulate matter (Grenfell Road)
was set up on 3 July 2017.

Following a review of the monitoring locations, the particulate matter monitor at Blechynden
Street was moved on 17 August 2017 to a location close to the Latimer Road TMO office. In
Blechynden Street the monitor was located close to a motor garage and was occasionally
impacted by vehicle exhaust emissions. The monitoring at Grenfell Road ceased on the 20
August 2018 due to site boundary changes. Particulate matter monitoring is ongoing at 3
locations (Kensington Aldridge Academy; Kensington Leisure Centre and Latimer Road TMO
office).

                                                       5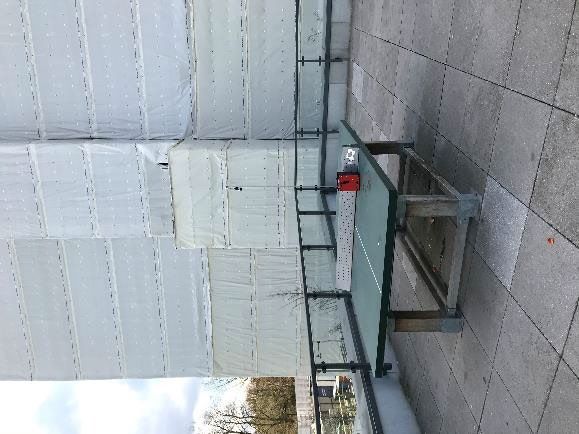
Environmental monitoring following the Grenfell Tower fire: data update 9 June 2022

An additional particulate matter monitor is co-located at Latimer Road TMO office, to allow a
comparison between different particulate monitoring methods and reference standards used
nationally.

Table 1 below shows the 24-hour average (and maximum 15-minute) levels of particulate
matter (PM10) measured each day over the last 4 weeks at the 3 UKHSA commissioned
monitoring sites close to Grenfell Tower. The table also presents levels measured at the North
Kensington London Air Quality Network site (which reports readings as hourly rather than 15-
minute averages) and the London Mean (produced by Imperial College London based on
monitoring data across the London Air Quality Network). We are advised by Imperial College
London that the London Mean PM10 data is typically very similar to the North Kensington levels
so it would be suitable to use the mean level as further comparator.

                                                       6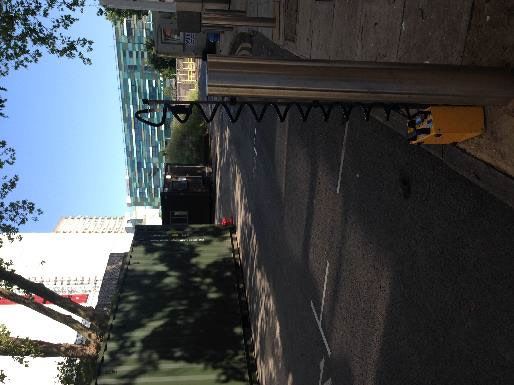
Environmental monitoring following the Grenfell Tower fire: data update 9 June 2022

Table 1. 24-hour average (and maximum 15-minute) levels of particulate matter (PM10) measured each day over the last 4 weeks at the 3 UKHSA commissioned monitoring sites close to
Grenfell Tower
The numbers in brackets indicate the daily air quality index banding for the measurement. This is also reflected in the colour displayed.

       Date            24 hour mean            24 hour mean           24 hour mean       24 hour mean           24 hour     15 minute       15 minute         15 minute        60 minute maximum
                                                                                                                 mean       maximum         maximum           maximum
                      Academy PM10            Leisure Centre        Station Wk/ TMO     North Kensington        London     Academy PM10   Leisure Centre   Station Wk/ TMO      North Kensington
                         µg/m3                  PM10 µg/m3          office PM10 µg/m3      PM10 µg/m3          mean PM10      µg/m3         PM10 µg/m3     office PM10 µg/m3       PM10 µg/m3
                                                                                                                 µg/m3
Tue 10/05/22                10 (1)                  14 (1)                 11 (1)            12 (1)              17 (2)         17             27                 16                  15
Wed 11/05/22                13 (1)                  19 (2)                 13 (1)            11 (1)              17 (2)         26             38                 24                  19
Thu 12/05/22                11 (1)                  16 (1)                 11 (1)            11 (1)              20 (2)         17             25                 20                  16
Fri 13/05/22                13 (1)                  18 (2)                 12 (1)            12(1)               18 (2)         21             32                 18                  17
Sat 14/05/22                19 (2)                  28 (2)                 16 (1)            18 (2)              23 (2)         36             53                 26                  27
Sun 15/05/22                25 (2)                  43 (3)                 19 (2)            26 (2)              33 (2)         34             60                 27                  37
Mon 16/05/22                19 (2)                  29 (2)                 17 (2)            20 (2)              24 (2)         35             56                 26                  37
Tue 17/05/22                12 (1)                  18 (2)                 23 (2)            11 (1)              17 (2)         20             30                231                  23
Wed 18/05/22                 8 (1)                  11 (1)                  8 (1)            12 (1)              13 (1)         14             20                 15                  49
Thu 19/05/22                 9 (1)                  12 (1)                  8 (1)             9 (1)              15 (1)         15             20                 19                  14
Fri 20/05/22                11 (1)                  12 (1)                  8 (1)             9 (1)              14 (1)         31             25                 21                  19
Sat 21/05/22                13 (1)                  15 (1)                 10 (1)            11 (1)              16 (1)         25             21                 14                  15
Sun 22/05/22                12 (1)                  15 (1)                  9 (1)            10 (1)              15 (1)         19             20                 37                  14
Mon 23/05/22                 8 (1)                  8 (1)                   6 (1)             9 (1)              14 (1)         14             16                 16                  15
Tue 24/05/22                 4 (1)                  3 (1)                   3 (1)             5 (1)              9 (1)          8               8                 8                    7
Wed 25/05/22                 9 (1)                  6 (1)                   5 (1)             7 (1)              13 (1)         16             12                 9                   12
Thu 26/05/22                13 (1)                  9 (1)                   7 (1)             9 (1)              16 (1)         23             14                 13                  11
Fri 27/05/22                12 (1)                  10 (1)                  7 (1)            12 (1)              20 (2)         19             18                 13                  20
Sat 28/05/22                 7 (1)                  5 (1)                   4 (1)             8 (1)              14 (1)         14              8                 10                  11
Sun 29/05/22                 5 (1)                  4 (1)                   3 (1)             6 (1)              12 (1)         12              6                 4                    8
Mon 30/05/22                 6 (1)                  4 (1)                   3 (1)             7 (1)              16 (1)         15              7                 24                  12
Tues 31/05/22                5 (1)                  3 (1)                   2 (1)             6 (1)              14 (1)         24             10                 7                   10
Wed 01/06/22                 6 (1)                  3 (1)                   2 (1)             8 (1)              15 (1)         12              7                 4                   12
Thu 02/06/22                 6 (1)                  4 (1)                   2 (1)            13 (1)              18 (2)         11              6                 3                   19
Fri 03/06/22                10 (1)                  5 (1)                   2 (1)            14 (1)              18 (2)         13              7                 3                   20
Sat 04/06/22                10 (1)                  5 (1)                   3 (1)            13 (1)              17 (2)         13              7                 3                   14
Sun 05/06/22                 8 (1)                  5 (1)                   2 (1)            12 (1)              15 (1)         17              8                 5                   16
                                                                                                           7
Environmental monitoring following the Grenfell Tower fire: data update 9 June 2022

        Date           24 hour mean              24 hour mean         24 hour mean                24 hour mean                24 hour             15 minute        15 minute         15 minute        60 minute maximum
                                                                                                                               mean               maximum          maximum           maximum
                      Academy PM10            Leisure Centre        Station Wk/ TMO              North Kensington          London             Academy PM10       Leisure Centre   Station Wk/ TMO      North Kensington
                         µg/m3                  PM10 µg/m3          office PM10 µg/m3               PM10 µg/m3            mean PM10              µg/m3             PM10 µg/m3     office PM10 µg/m3       PM10 µg/m3
                                                                                                                            µg/m3
Mon 06/06/22                 5 (1)                     3 (1)                 1 (1)                     7 (1)                  11 (1)                 11                6                 4                   11
Tues 07/06/22                6 (1)                     4 (1)                 2 (1)                     7 (1)                  13 (1)                 13                7                 4                   16

The mean or average results for each day (24 hour average) have been compared and displayed in the table with a colour coding used in the UK’s daily air quality index (DAQI), and all the results from the
commissioned monitoring are within the ‘low’ air pollution band (1 to 3).

The DAQI is a measure of the levels of air pollution. The index is numbered from 1 to 10 and is divided into 4 bands, low (1) to very high (10), to provide detail about air pollution levels in a clear way.

Index bands
    1          2        3             4            5            6            7          8         9            10
            Low                              Moderate                                 High              Very high

PM10 particles
This table is based on the daily mean concentration for historical data, latest 24 hour running mean for the current day.

                               1             2             3             4                   5            6               7               8                9         10
 Index band µg/m3            Low           Low            Low       Moderate           Moderate       Moderate       High               High              High    Very high
                            0 to 16       17 to 33      34 to 50     51 to 58          59 to 66       67 to 75      76 to 83           84 to 91      92 to 100   101 or more

                                                                                                                      8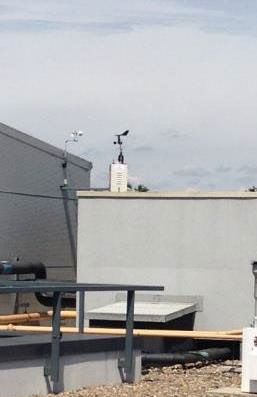
Environmental monitoring following the Grenfell Tower fire: data update 9 June 2022

In Figure 2 below, the 15 minute particulate matter (PM10) concentrations over the last week
are presented for each of the 3 UKHSA commissioned monitoring locations: Kensington
Aldridge Academy, Kensington Leisure Centre and Latimer Road TMO office location. Figure 3
shows the 24-hour average particulate matter (PM10) levels over the last 4 weeks of monitoring.
The figure also presents the UK national air quality objective for PM10 of 50 µg/m3, which aims
to protect health and the environment. The results can be seen to be below the UK national air
quality objective and in the ‘low’ DAQI banding.

For all particulate matter monitoring results from 24 June 2017 to 29 December 2021, see the
Environmental monitoring following the Grenfell tower fire report dated 29 December 2021.

A summary of the health impacts associated with particulate matter is provided in Appendix 2.

                                                       9
Environmental monitoring following the Grenfell Tower fire: data update 9 June 2022

Figure 2. 15 minute particulate matter (PM10) concentrations over the last week for each of the 3 UKHSA commissioned
monitoring locations: Kensington Aldridge Academy, Kensington Leisure Centre and Latimer Road TMO office location

                                                                                 10
Environmental monitoring following the Grenfell Tower fire: data update 9 June 2022
Figure 3. 24-hour average particulate matter (PM10) concentrations over the last 4 weeks for each of the 4 UKHSA commissioned
monitoring locations: Kensington Aldridge Academy, Kensington Leisure Centre and Latimer Road TMO office location
11Environmental monitoring following the Grenfell Tower fire: data update 9 June 2022
Asbestos monitoring and results
UKHSA monitoring for asbestos in areas around Grenfell Tower began on the 30 June 2017.
Sampling takes place over a 6 to 7 hour window between 7:30am and 4pm when the site is
most active. Monitoring locations have moved over time due to site boundary changes and
accessibility issues but monitoring locations are within close proximity to the tower (see the map
in Figure 1 and Appendix 1 for further details). The time between sampling periods has also
increased over time from every 4 days to around 10 to 14 days.
As of the end of December 2021 over 1300 environmental asbestos monitoring samples have
been taken and analysed. The most recent results are shown in the table below and are
consistent with the results found since July 2017. To date, environmental asbestos monitoring
results indicate levels at or below the limit of detection.
Since monitoring began there have been 4 occasions on which a single asbestos fibre was
identified by scanning electron microscopy. This is consistent with environmental background
levels of asbestos and does not pose an increased risk to health. Table 2 below, shows the
asbestos airborne monitoring results from sample location for the past 4 sampling dates.
12Environmental monitoring following the Grenfell Tower fire: data update 9 June 2022
Table 2. Asbestos airborne monitoring results from sample location points for the past 4 sampling dates
Phase contrast Scanning electron
Date Location Comments
microscopy (PCM) f/ml microscopy (SEM) f/ml
Grenfell Rd (B3)Environmental monitoring following the Grenfell Tower fire: data update 9 June 2022
Phase contrast Scanning electron
Date Location Comments
microscopy (PCM) f/ml microscopy (SEM) f/ml
Grenfell Rd (B3)Environmental monitoring following the Grenfell Tower fire: data update 9 June 2022
The asbestos air sampling is being carried out using some of the methods set out in the Health
and Safety Executive’s HSG 248. This involves drawing a volume of air across a filter using a
pump. The filters are then prepared and analysed in a laboratory.
In the method used by laboratories we have commissioned, the air sample filters are analysed
by 2 different methods: phase contrast microscopy and electron microscopy.
Phase contrast microscopy identifies fibres that meet the dimensions of a respirable fibre but
does not differentiate between asbestos and non-asbestos fibres. Therefore, we are also
analysing a proportion of the samples taken by electron microscopy.
The laboratory analysing the samples uses scanning electronic microscopy. Electron
microscopy does differentiate between fibre types, which is why we are able to say with
confidence that the fibres identified to date are not asbestos.
For all asbestos monitoring results from 24 June 2017 to 29 December 2021, see the
Environmental monitoring following the Grenfell tower fire report dated 29 December 2021.
A summary of the health impacts associated with asbestos fibres is provided in Appendix 2.
15Environmental monitoring following the Grenfell Tower fire: data update 9 June 2022
Appendix 1. Monitoring locations summary
The Kensington Aldridge Academy site is located to the north-northeast of the site. During the
reporting period, particulate matter and asbestos have been monitored within the grounds of the
Kensington Aldridge Academy. The picture shows the location particulate matter monitor on the
roof of the Academy. This monitoring location has been in use since 24 June 2017.
Kensington Academy Monitoring Location J
During the monitoring period, asbestos monitoring was completed in the Kensington Aldridge
Academy grounds (J) on the first floor outdoor area, as indicated in the picture.
16Environmental monitoring following the Grenfell Tower fire: data update 9 June 2022
Kensington Academy Monitoring Location Q
During the monitoring period, asbestos monitoring was completed in the Kensington Aldridge
Academy grounds (Q) on the mezzanine outdoor area.
Kensington Academy Monitoring Location K
During the monitoring period, asbestos monitoring was completed along the southern boundary
of the Kensington Aldridge Academy playground (K).
17Environmental monitoring following the Grenfell Tower fire: data update 9 June 2022
Kensington Leisure Centre has a particulate matter monitor on the main roof of the building.
The instrument is located as close to the edge of the building as possible. This monitoring
location has been in use since 24 June 2017.
Located within the site boundary, close the to Station Walk entrance there is a particulate
matter monitor. This monitoring location has been in use from 17 August 2017.
18Environmental monitoring following the Grenfell Tower fire: data update 9 June 2022
Grenfell Road Monitoring location B
The monitoring location is inside the site boundary and has moved as the boundary has
changed. During the monitoring period, a location on Grenfell Road (B) near the site entrance
was used for asbestos monitoring, as shown in the picture. This monitoring location has been in
use since 13 September 2018.
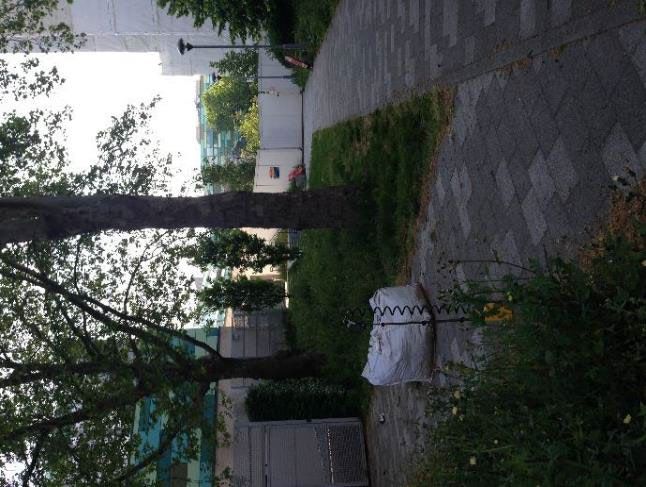
Latimer Road / Grenfell Walk monitoring location C
The Grenfell Walk (C) monitoring location was initially located on the western side of the
raised Grenfell Walk but within a month was moved to ground level near the Latimer
Road entrance to the site. The picture shows the monitoring location during the current
monitoring period. This monitoring location has been in use since 29 July 2017.
19Environmental monitoring following the Grenfell Tower fire: data update 9 June 2022
Appendix 2. Health information
Particulate matter
Particulate matter (PM) is a term used to describe the mixture of solid particles and liquid
droplets in the air. It can be either human-made or naturally occurring. Some examples include
dust, ash, and sea-spray. Particulate matter (including soot) is emitted during combustion, for
example from fires, or for power generation, domestic heating and in vehicle engines.
Particulate matter varies in size (that is, the diameter or width of the particle). PM10 means the
mass per cubic metre of air of particles with a size (diameter) generally less than 10
micrometres (μm). The size of these particles means that they are respirable and can be
inhaled into the lungs.
Respirable particulates are chosen as a measure of air pollution and can be compared to
background levels across London and against health standards and the Daily Air Quality Index
(DAQI). See the Air Information Resource web page.
Health effects of PM
Inhalation of particulate air pollution can have adverse health impacts. The biggest impact of
particulate air pollution on health is understood to be from long-term exposure. However, short-
term increases and exposures to high levels of PM can cause lung and heart problems,
resulting in increased hospital admissions or in some cases deaths such as heart attacks.
Children, the elderly, and those with pre-existing respiratory and cardiovascular disease are
known to be more susceptible to the health impacts from air pollution.
Asbestos
Asbestos is a general name given to several naturally occurring fibrous minerals that have
crystallised to form fibres. Asbestos fibres do not dissolve in water or evaporate, they are
resistant to heat, fire, chemical and biological degradation and are mechanically strong.
The properties of asbestos made it an ideal material for use in a number of products, including
insulation material for buildings, boilers and pipes, car brakes and floor tiles, asbestos cement
for roofing sheets and pipes.
Asbestos is widespread in the environment. It may enter the atmosphere due to the natural
weathering of asbestos-containing ores or damage and breakdown of asbestos-containing
products including insulation, car brakes and clutches, ceiling and floor tiles and cement.
20Environmental monitoring following the Grenfell Tower fire: data update 9 June 2022
The use of asbestos has been banned in the UK since 1999. However, asbestos may be
present in any house or building built before the year 2000 as it was widely used in a variety of
building materials.
Health effects of asbestos
The presence of asbestos in the environment does not always lead to exposure as you must
come into contact with the fibres. When damaged, asbestos can release smaller fibres that may
be breathed in or swallowed. Following exposure to asbestos, the possibility of adverse health
effects will depend on several factors, including the amount to which you are exposed (dose)
and the duration of exposure.
If fibres are inhaled, asbestos may cause cancer of the lung, voice box or ovary, or
mesothelioma (a type of cancer that forms on the protective tissue that covers the lungs or the
abdomen). The risk of these cancers will depend on how much asbestos you are exposed to
and for how long.
Breathing in high concentrations of asbestos for a long period of time mainly affects the lungs,
causing a disease called asbestosis where breathing becomes difficult and the heart enlarges.
Asbestosis may take decades to develop. Exposure to lower concentrations of asbestos over
time may result in a general (diffuse pleural thickening) or localised (pleural plaques) thickening
of the lung lining.
Further information
More detailed information on each of these chemicals is available via the following links:
• Particulates
• Asbestos
Other links:
• UK – daily air quality index (DAQI)
• World Health Organization air quality guidelines
• London Air
21Environmental monitoring following the Grenfell Tower fire: data update 9 June 2022
About the UK Health Security Agency
UKHSA is responsible for protecting every member of every community from the impact of
infectious diseases, chemical, biological, radiological and nuclear incidents and other health
threats. We provide intellectual, scientific and operational leadership at national and local level,
as well as on the global stage, to make the nation heath secure.
UKHSA is an executive agency, sponsored by the Department of Health and Social Care.
© Crown copyright 2022
Published: June 2022
Publishing reference: GOV-12476
You may re-use this information (excluding logos) free of charge in any format or medium,
under the terms of the Open Government Licence v3.0. To view this licence, visit OGL. Where
we have identified any third party copyright information you will need to obtain permission from
the copyright holders concerned.
22You can also read