Enhancement of Gas Flow Simulation of Internal Arc in Medium Voltage Switchgear
←
→
Page content transcription
If your browser does not render page correctly, please read the page content below
CIRED 2021 Conference                             Geneva, 20 – 23 September 2021

                                                                                                                             Paper 512

         Enhancement of Gas Flow Simulation of Internal Arc in
                    Medium Voltage Switchgear
                                Mainak Sinha Roy1, Jaroslav Snajdr2, Pavel Novak2
                                             1
                                              Schneider Electric R&D, Bangalore, India
                                        2
                                            Schneider Electric R&D, Regensburg, Germany

       Keywords: switchgear, internal arc, arc energy, heat flux, cotton indicator

Abstract
Internal arc in a switchgear is a rare phenomenon in its entire lifecycle. Though the mean time to failure is high, using
new materials, improved production technologies or sensors for predictive maintenance, the risk of an internal arc
persists. Unfortunately, the effects of internal arc are destructive and very harmful due to severe pressure rise and hot gas
expulsion, which can endanger an operator or damage a property. Architecture and design of medium voltage switchgear
is qualified upon the requirements of existing standards. General study across the labs indicates that a success rate of
about 70% is achieved during the initial stage of internal arc validation. Data from labs reveals that the most prominent
failure mode during internal arc testing is burning of indicators due to hot gas expulsion.

The physics of the internal arc phenomenon is studied and employed to build the model in simulation software package
using fluid dynamics numerical method. Qualitative as well as quantitative prediction is carried out, to estimate the gas
flow behaviour. Firstly, the volume of the hot gas cloud and secondly the energy incident on the indicators are
determined. Results are compared with data collected from series of internal arc tests with high-speed video and actual
measured parameters. Based on the findings, the simulation methodology is formulated which will provide input to
improve the design of switchgear.

The paper presents results of recent research activity, with the objective to increase robustness of the switchgear design
for internal arc performance. The prediction of burning of indicators remains a difficult task due to the complexity of all
involved physics, their coupling and correct representation in a simulation model. The enhanced method presented in this
paper can significantly increase the success rate during tests and ultimately safety of the switchgear and its variants.

1    Introduction                                                 boundary conditions imposed in the simulation model.
                                                                  Based on the pressure values, switchgear design is
Safety of personnel around Medium voltage switchgear              adapted. However, the burning of indicators and thus
during an internal arc phenomenon is one of the main              personnel safety from hot gas is still difficult to predict due
concerns for users. Switchgear manufacturers design the           to the complexity of the internal arc phenomenon. Since
cubicle and exhaust system to be strong enough to                 the major reason of failure during internal arc tests is
withhold the pressure and manage fire and gas emanating           indicator burning, such prediction can significantly
during internal arc.                                              increase the success rate during tests.
IEC 62271-200 [1] and IEEE C37.20.7 [2] specify testing           Moreover, the market is demanding more tailor-made
methodology to validate the design and provide required           products and it is impossible to carry out internal arc tests
robustness and safety to the switchgear. The internal arc         of every single design of switchgear variant. Simulation is
validation test makes allowance for effects acting on all         an excellent tool to predict the performance of such
parts of the enclosure, such as internal over- pressure,          variants if the impact of hot gas expulsion on personnel
thermal effects of the arc or its roots, the effects of ejected   safety can also be predicted along with pressure
hot gases. Internal Arc test is carried out by initiating short   estimation. The users are also looking for incident energy
circuit phase to phase or phase to earth in the compartment       around the switchgear as well as around the exhaust of
to be tested. The switchgear is placed surrounded by walls        switchgear room to design the personal protective
and ceiling to simulate the room installation. Cotton             equipment and also to demarcate safety zones for
indicators of approximate density of 150 g/m² and a size of       personnel.
150x150 mm are placed around the switchgear to simulate
the clothing of the authorized personnel operating the            2    Challenges of Simulation Technique
switchgear.
At present pressure induced in a compartment during               Cotton indicators are the primary tools for pass-fail
internal arc tests can be correctly predicted with proper         criterion of internal arc tests. They are positioned in a
                                                                  relative proximity of the switchgear equipment to assess

                                                                  1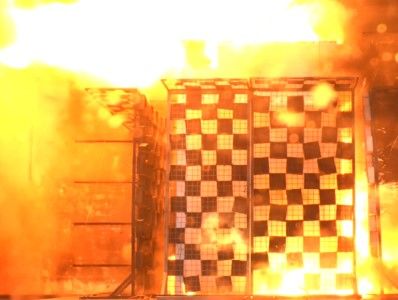
CIRED 2021 Conference Geneva, 20 – 23 September 2021
Paper 512
the degree of heat exposure during internal arcs that could of the thermocouple bead, the equivalent calorimeter
be harmful to personnel. The flammability of similar type constant (Kt) of the thermocouple bead is calculated [4].
A cotton indicators used during internal arc tests was Stoll limit defines energy density causing second degree
studied by the working group of CIGRE A3.24 [3]. The burn on humans. The threshold incident energy values
heat flux experimentally obtained to ignite a cotton obtained experimentally by CIGRE working group is used
indicator at 1.1 s to 2 s is 90 kW/m², corresponding to a to calculate an equivalent Stoll limit (Scotton) for cotton
threshold energy ranging from 100 kJ/m² to 180 kJ/m². indicators. The equivalent Stoll limit and the calorimeter
Whereas measured heat flux to ignite a cotton indicator in constant give the Stoll limit curve in the form of a
2.2 s to 3 s is 60 kW/m², corresponding to a threshold transformed temperature-time curve. The following
energy ranging from 132 kJ/m² to 180 kJ/m². It is clear relationship is used to evaluate the Stoll limit for cotton
from the laboratory testing that there is visible scatter of indicators:
results. Unfortunately, we do not have enough data from
actual internal arc tests to corroborate the above values of E = Incident Energy = Kt · dTmax= Scotton · tmax0.2901
threshold energy level for cotton indicators. In the absence where dTmax = Delta peak temperature
of data from actual tests, it is also difficult to calibrate a and tmax = time to delta peak temperature.
simulation model and estimate the accuracy of results. An
attempt has been made to estimate the energy levels using 3.1 Data Analysis at Exhaust (T1)
thermocouples and the same approach is discussed in next The temperatures recorded by the thermocouple for each
section. of the 4 tests are plotted in Fig. 2. The maximum
temperature recorded by the thermocouple is between
3 Data from Internal arc tests 740˚C to 630˚C. In the actual test the indicators are not
placed in this location since it is not required by the
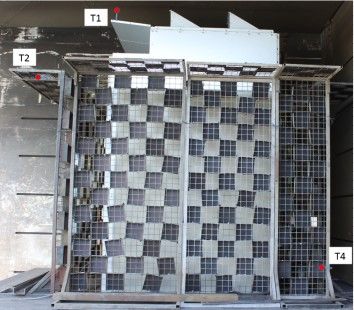
Thermocouples of K-type at specific locations were used standards and the location is inaccessible to the operator.
to indirectly measure energy incident in 4 different tests.
The arc energy for these 4 tests were varying from 40 MJ
to 47 MJ. Fig. 1 shows the arrangement of the indicators
during the test as well as the location of thermocouples.
Thermocouples were placed at three different locations to
capture the hot gas behaviour: T1 at exhaust, T2 near front
horizontal indicator and T4 near rear vertical indicator.
Fig. 2 Temperature at T1
Fig. 1 Thermocouple locations We can assume that the indicators placed at the exhaust
would have been burnt since it would be the hottest place
Temperature recorded by thermocouple is analysed at around the switchgear and would have not been able to
each of the three locations. K-type thermocouple was used withstand heat flux. From the above figure it is also
to measure temperature of the hot gas which has a range of evident that the temperature rise of the thermocouple
1300˚C. The specification of thermocouple is as follows: exceeds the Stoll limit for cotton indicators by a large
• Specific heat of thermocouple bead Cp = 523 J/(kg.K) margin.
• Radius of thermocouple bead r = 0.54 mm
• Surface area of thermocouple bead, A = 3.7x10⁻⁶ m2 3.2 Data Analysis at front horizontal and rear vertical
• Mass of the thermocouple bead, m = 5.7x10⁻⁶ kg. indicators (T2 and T4)
The temperatures recorded by the thermocouple placed
The thermocouple cannot be used to measure the gas near front horizontal indicator for 2 of the 4 tests are
temperature since its thermal time constant is 0.8 seconds. plotted in Fig. 3. The maximum temperature recorded by
Here, we will try to measure the energy incident on the the thermocouple is around 90˚C.
thermocouple with the thermocouple bead acting as a
calorimeter. Using the thermal and geometrical parameters
2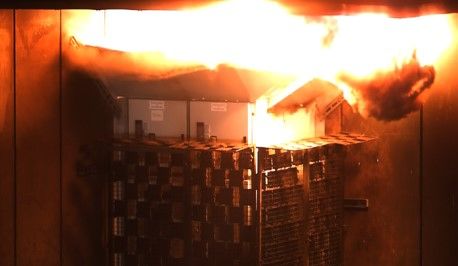
CIRED 2021 Conference                                 Geneva, 20 – 23 September 2021

                                                                                                                            Paper 512

                                                                         performance, measuring accuracy, irregular flow of hot gas
                                                                         in leakage areas etc.

                                                                         The comparison of the Stoll limit with the measured
                                                                         temperature gives a good estimation of the indicator
                                                                         safety. It also confirms that the calorimeter constant can be
                                                                         used to predict the incident heat flux using the temperature
                                                                         rise values measured with thermocouple during tests.

                                                                         4    Simulation of gas flow in switchgear
                                                                         Using the thermocouple’s thermal and geometric
                                                                         properties heat flux incident on the thermocouple at
                                                                         location T1 is calculated. The heat flux incident on the
                                                                         thermocouple is calculated using the following relation
Fig. 3 Temperature at T2                                                 and is plotted in Fig. 5:

The temperature measured at these locations does not go                  E = Incident Energy = K · dTmax
beyond the Stoll limit and the indicator should be safe in
this location. In the actual test the indicators are placed in
this location also and the indicators did not ignite during
both the tests.

The temperatures recorded by the thermocouple placed
near rear vertical indicator for all the 4 tests are plotted in
Fig. 4. The maximum temperature recorded by the
thermocouple ranges from 350˚C to 1050˚C. The large
variation in temperature represents the variation of the
extent of leakage of hot gas in that area.

                                                                         Fig. 5 Heat Flux at T1

                                                                         Heat flux curve is smoothened by moving average method.
                                                                         Heat flux reaches a value of about 1250 kW/m2 at T1. The
                                                                         energy incident at T1 is simulated and compared with the
                                                                         values obtained during test.

                                                                         The simulation was performed in a proprietary CFD
                                                                         software with the help of internal arc model. The model is
                                                                         based on arc radiation using user defined functions and a
                                                                         real gas model. This robust model was a company solution
                                                                         mainly for evaluating pressure rise within the switchgear
                                                                         compartments and substations. Energy incident on the
Fig. 4 Temperature at T4                                                 indicators was simulated by modelling the indicators and
                                                                         monitoring energy levels at those locations. Simulation
The temperature measured at these locations goes beyond                  with laminar model approach has been attempted earlier
the Stoll limit for all tests. For test 1, test 2, the Stoll limit       with moderately accurate result [5]. Simulation
is exceeded in about 0.35 second. Whereas the temperature                methodology is improved using turbulent regime to
goes beyond Stoll limit for test 3 and test 4 after 0.55                 accurately predict gas flow behaviour as well as the
second and 0.65 second respectively. In the actual test the              incident energy. Fig. 6 shows the difference in gas flow
indicators were placed in this location. The indicators were             behaviour is both the laminar and turbulent regimes as
found to be safe and did not ignite only for test 4 where the            well as real gas flow during test. The contour of incident
maximum temperature was recorded to be 300˚C. The                        energy flux on the horizontal indicators can also be
temperature of the thermocouple exceeds the Stoll limit by               visualised in Fig. 6. In the laminar flow regime, the gas
about 100 C in test 4 and still the indicators safe. This is an          does not propagate to the horizontal indicators and thus the
indication to the possible variation in the cotton indicator             incident energy on the horizontal plane is not precisely

                                                                     3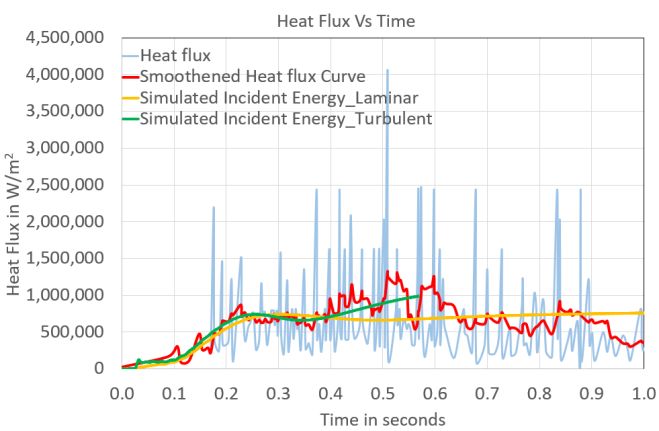
CIRED 2021 Conference Geneva, 20 – 23 September 2021
Paper 512
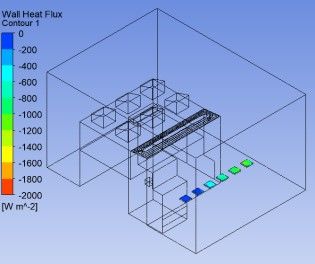
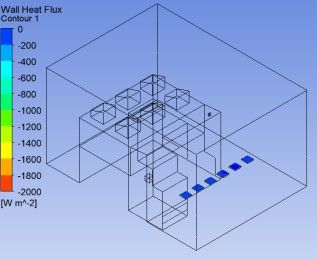
simulated. However, the turbulent regime shows a more cubicle is considered in simulation which is not a practical
realistic gas flow and shows the gas propagation also scenario during test. The simulated incident energy levels
towards the horizontal indicators. The simulated gas flow will thus be higher than the actual values and would thus
with turbulent regime bears a more accurate resemblance represent a worst-case scenario. Moreover, the accuracy
to real time video grab from test. and uncertainties in the measurement also would
contribute to the difference.
a
Fig. 7 Simulated heat flux at T1
The simulation methodology was implemented to validate
the internal arc performance in an air insulated switchgear
b of 50kA, 1sec fitted with deflectors. The switchgear was to
be installed in a room with limiting dimensions in terms of
ceiling height. Thus, its performance needed to be
validated with such limiting conditions. The gas flow was
accurately simulated, and design was adapted as per the
simulation inputs. The internal arc test got validated at the
first attempt thus reaffirming the need of simulation to
predict the performance of a product beforehand to cater
faster to the market with minimum cost and effort.
Fig. 8 compares the simulated gas flow and the actual gas
flow during the test.
c
Fig. 6 (a) Simulated Gas Flow and incident heat flux in
laminar regime, (b) Simulated Gas Flow and incident heat
flux in turbulent regime, (c) Video grab from test.
Thus, simulation gas flow is matching with the real gas
flow qualitatively as evident in Fig. 6. Further, we can
evaluate the values of incident energy at location T1 to
validate the simulation accuracy.
Monitor to measure the energy flux at T1 location was
placed in the model. Fig. 7 shows the simulated as well as a
the actual heat flux values from one of the tests. Simulated
incident energy for both laminar and turbulent regime is
plotted. Simulated incident heat flux is underestimated
with laminar flow. The turbulent regime predicts the
incident heat flux more accurately and the values are much
closer to the measured values during test. Simulation for
turbulent flow is continued up to 0.6 second till the flow
and heat flux is stabilised at location T1. Though there is
some variations in the absolute values of incident energy, b
the gas flow path and the trend of the heat energy incident Fig. 8 (a) Simulated gas flow - front view for better
as well as heat flux (during the time span) is in line with visualisation, (b) Video grab from test.
actual tests. This variation in absolute values can be
contributed to the fact that no additional leakage from the
4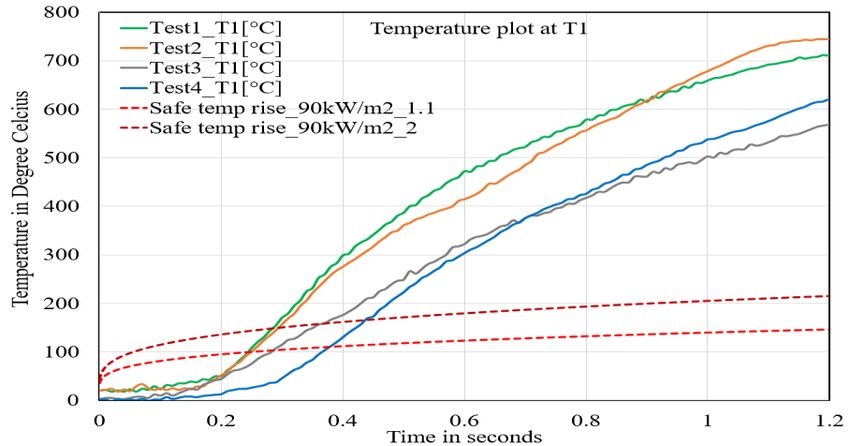
CIRED 2021 Conference                                 Geneva, 20 – 23 September 2021

                                                                                                                       Paper 512

5    Conclusion                                                     management based on digitisation, condition monitoring
                                                                    and digital twin.
The paper demonstrated the added value of simulation for
prediction of switchgear performance during internal arc            6     References
test. Specifically, the investigation of indicator ignition
due to hot gas was of the main concern. Temperature of              [1]   IEC Int. Standard 62271-200: AC metal-enclosed
                                                                          switchgear and control gear for rated voltages above 1
gas was measured using thermocouples for multiple tests.                  kV and upto and including 52 kV, 2011.
The temperature rise of thermocouples were then checked             [2]   IEEE C37.20.7: IEEE Guide for Testing Metal-
with the equivalent Stoll limit for cotton indicators. The                Enclosed Switchgear Rated Up to 38 kV for Internal
comparison along with indicator performance during the                    Arcing Faults ,2007.
tests confirmed that the thermocouple parameters can be             [3]   Working Group A3.24, “Tools For The Simulation Of
used to predict the incident heat flux using the temperature              Effects Of The Internal Arc In Transmission And
                                                                          Distribution Switchgear”, Cigre Publication, January
rise values measured with thermocouple during tests.                      26, 2014.
Simulation was then carried out to calibrate the model with         [4]   Holger Schau, Herbert Bessei,“ The influence of fuses
the measured value of incident heat flux. Simulation with                 on arcing fault energy and personal protective clothing
turbulence mode provided accurate gas flow as well as                     required,” ICEFA,2011.
incident energy values.                                             [5]   Mainak Sinha Roy,Jaroslav Snajdr,“Simulation of Hot
                                                                          Gas Behavior During Internal Arc in Medium Voltage
Thus, the safety of the switchgear in terms of cotton                     Switchgear”,Matpost 2019.
ignition can be checked with this method by accurately
predicting incident heat flux on the indicators. Simulation
of pressure induced in compartment as well as hot gas
would give higher confidence to designers before
performing expensive tests. This would also help to ensure
the safety of switchgear variants for which internal arc
tests are sometimes not possible to perform. Users can be
provided with much more accurate data about the incident
energy level around the switchgear and around the exhaust
of switchgear room for specific site conditions. This would
increase the reliability of the switchgear in terms of safety
not only in an ideal but also in real and practical
installation conditions.

With the enhancement of computing power and meshing
methodology, the computing time is steadily reducing.
Earlier, simulation with laminar regime would take about a
week in a standard high-end CPU. Whereas, simulation
with turbulence model cannot be performed due to
complexity and higher computing time. Now a days, the
mesh count can be halved with more advanced mesh
techniques and simulation with turbulent regime can be
completed even in 3 days. The assembly time and
preparation time for a switchgear during internal arc test
can take about 20 man-days and that too without a
guarantee in successful performance of the product.
However, effort in simulating the internal arc performance
of a switchgear in terms of pressure rise and gas flow will
be around 7 days. Simulation will give a confidence of
design as well as highlight the fragilities in the design for
which corrective design actions can be taken. Going
forward, this enhanced technique of simulation would
make our products safer, more reliable, more robust with
minimum effort and time.

Simulation along with test results can deliver an effective
and acceptable characterisation of switchgear behaviour
even in such complex phenomenon of internal arc. This
goes well in hand for the forthcoming philosophy of asset

                                                                5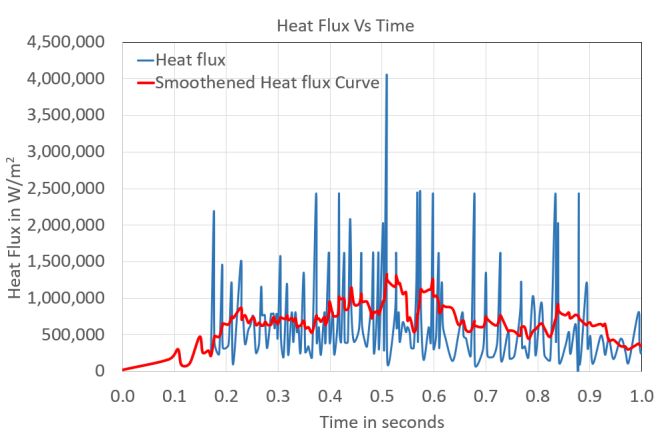


You can also read