Energy security in the spotlight - Commodity April 2022 - S&P Global
←
→
Page content transcription
If your browser does not render page correctly, please read the page content below

Commodity

April 2022

  Russia turns to energy   China’s modern energy   US states outline   War prompts power
     buyers in Asia            systems plan        emissions goals      market rethink

Energy security
in the spotlight
Insights
Contributors
The story of
ISSN 2153-1528 (print)
ISSN 2153-1536 (online)
Publisher
progress
Murray Fisher, +1 720 264 6644 Jared Henry
murray.fisher@spglobal.com Anderson James Edwardes-Evans
Editor Senior Writer, Burgess Associate Editorial
North America Senior Editor, Director,
Barbara Lorenzo Caluag, Power Energy Transition Power News
+65 6530 6497
barbara.caluag@spglobal.com
Copy Editors
110 years in the making, this is Aastha Agnihotri, Valarie Jackson,
Debiprasad Nayak, Shashwat Pradhan Rosemary Meghan Daryna
Griffin Gordon Kotenko
the story of next generation price Production Manager
David Sullivan, +44 (0)20 7176 0268
Managing Editor,
Russia News
Senior Editor,
Oil News
Analyst,
Power Pricing
assessments and benchmarks. david.sullivan@spglobal.com
Production Office
Commodity Insights Magazine
7400 S Alton Ct
Taylor
Kuykendall Kassia Brandon
Centennial, CO 80112
Senior Reporter, Micek Mulder
Advertising Sales – Americas Market Editor, Reporter,
Intelligence Coal Power News Energy Transition
Bob Botelho, +1 720 264 6618
robert.botelho@spglobal.com
Advertising Sales – EMEA,
Asia-Pacific Henrique
Ellie
Sheryl Tan, +65 6216 1191 Potter Ribeiro Mark
sheryl.tan@spglobal.com Editor, Watson
Editor,
Gas and Power Latin America Senior Editor,
Article Reprints & Permissions News Power News
News
The YGS Group,
+1 717 505 9701, ext 105
plattsreprints@theygsgroup.com
Subscribe free at:
spglobal.com/insight Eric
Kate Yep Ivy
S&P Global Commodity Insights Winston Team Lead, Yin
20 Canada Square, 9th Floor Senior Editor, Asia LNG & Specialist,
London, E14 5LH, UK Power News Energy Transition Energy Transition
President
Saugata Saha
Head of Gas, Power &
Climate Solutions
Philippe Frangules
Head of Market Reporting
& Trading Solutions
Dave Ernsberger
As custodians of today’s leading benchmarks and price
assessments, we work with the markets to publish
prices that are fair and underpinned by transparent
Platts | CERAWeek | Chemical Week methodologies. As the world evolves you need a partner
who can help you see what’s next.
See the whole story at
spglobal.com/commodityinsights
Contents April 2022

                                                                                                                       22

                                                                          08                                         38                                                                            56                                                     75
8 Eye on the goal(s)                                             32 Energy security vs climate policies                                 52 US renewables capture prices                                  75 Dropping off the generation mix
In the US, 23 states have aggressive clean energy plans          Surging energy prices and geopolitical tensions have pushed            Transmission and storage could help offset                       Coal-fired generation’s share in the US power mix
either signed into law, written in executive orders or set       the Biden administration to rethink its approach to domestic oil       renewables price cannibalization, reducing                       is expected to drop by more than half in 2027
by the governor                                                  and gas production                                                     revenue volatility                                               from 2021 levels

16 Lessons from a fatal winter storm                             38 Evolving climate ambitions                                          56 Offshore wind gathers steam                                   80 Clean energy capacity growth
More than a year since the Texas February freeze, regulators     Several electric utility companies in the US have started to           Capacity building in US offshore wind power has                  When it comes to building utility-scale clean energy
map out short- and long-term solutions to prevent another        include Scope 3 in their net-zero goals, paving the way for            momentum on its side, with the sector creating                   capacity in the US, Texas and California are taking
massive blackout                                                 others to follow                                                       jobs and economic opportunities                                  the lead

22 Experimental blends                                           42 Asia-bound Russian supplies                                         62 Looming lithium deficit                                       88 Delays in development

Power utilities in the US explore using hydrogen blending in     Russia is accelerating its drive to redirect export flows to           The lithium industry may be facing a structural                  Will the US hit net-zero targets amid expensive shipping and
natural gas turbines, with a goal of fully replacing gas with    customers in Asia and replace the US dollar in its energy              supply-demand imbalance following years of drought               logistical issues stemming from geopolitical tension and
hydrogen by midcentury                                           trading activities                                                     in investments                                                   pandemic-linked challenges?

26 Hydrogen’s import potential                                   46 Redesigning Europe’s energy market                                  68 China’s unconventional approach to transition
The high costs of hydrogen production in Europe have producers   Even before Russia’s invasion of Ukraine, EU Member States             After facing price and supply challenges, China’s policymakers
looking to other regions for imports                             were already looking to challenge the status quote in gas              place energy security at the core of the country’s
                                                                 and power market                                                       energy transition

4 Commodity Insights                                                                                                       April 2022   April 2022                                                                                                 Commodity Insights 5
Editor’s Note Explore Insights
Just as many parts of the world seemed to be learning to live with COVID-19, Our website spglobal.com/commodityinsights contains an extensive selection of free news, videos, podcasts
commodity markets got hit by another set of challenges early this year. and special reports about energy and commodities. Here’s a small selection of recent highlights
Energy prices were already on an uptrend, fired up by the brewing tensions between
Russia and Ukraine. The escalation to a full-blown war, with Russia’s invasion of
Ukraine on February 24, sent prices even higher.
Conflict and sanctions are now forcing stakeholders in the commodities space
to take a hard look at their prior assumptions about global energy supply. In a
world of growing risks and uncertainties, how do governments, industry majors
and policymakers strike a balance between ensuring energy security and
Barbara Lorenzo Caluag energy transition?
Editor
Meghan Gordon highlights this challenge, looking at how the US might adjust its
approach to energy transition as a result of the Russia-Ukraine crisis (page 32). Interactive Deep-dive
Periodic Table of Oil Oil Security Sentinel
Several US states have already drawn up plans to accelerate clean energy goals, the
Now on its fourth edition, the interactive Periodic Table
latest of which is Maryland, whose Climate Solutions Now Act of 2022 takes effect There were 13 attacks on Gulf oil and energy
of Oil features new crude grades, carbon intensity
on June 1. Kassia Micek outlines the key goals of US states as well as the challenges infrastructure in Q1 alone, up from nine in the same
values, a significant redesign and new functionality
in achieving such goals (page 8), while Brandon Mulder and Kate Winston focus on period last year. Energy security has also come into
to help customers plan and make more informed
efforts by key utilities and companies to hit net-zero targets (page 38). sharper focus following Russia’s invasion of Ukraine
decisions in rapidly changing volatile markets.
on February 24. We continue to explore the changing
Read more
The war has also driven up the cost of hydrogen production. James Burgess discusses relationship between risk and the price of crude in the
viable pathways and import potential (page 26), and you can find a snapshot of Platts hydrogen price wall
latest edition of the Oil Security Sentinel. Read more
S&P Global Commodity Insights’ global hydrogen pricing, leading to our interactive Larger panels represent higher prices. Prices in $/kg.
Below is a selection of S&P Global Platts hydrogen assessments showing regional price differences and month-on-month changes. Early trade potential is emerging as technologies and regions compete to produce the cheapest
low-carbon hydrogen through water electrolysis powered by renewables or from fossil fuels with carbon capture and storage.
hydrogen price wall. Gulf/ALK NoCal/PEM NoCal/SMR Ned/ALK Ned/PEM Ned/SMR+ NSW/ALK NSW/PEM QLD/ALK Jap/ALK Key
Mid/ALK
2.93 4.56 1.58 8.89 4.64 6.31 6.9 12.89
17.47 20.71
WA/ALK Area/pathway
2.67 Mar-22 avg price
Gulf/SMR
Gulf/PEM 1.23 Pathway symbol
Price watch
Price direction
Meanwhile, China is taking a different approach to energy transition by looking for
3.91
Mid/PEM NSW/COAL
3.92 QLD/COAL
2.98 Production pathway
Hydrogen Price Wall
4.1
solutions that do not necessarily mean avoiding fossil fuels altogether, to minimize Mid/SMR NE/PEM NoCal/ALK
Ned/ATR
10.03
Jap/PEM
15.68
PEM electrolysis
NE/SMR
Alkaline electrolysis
risks to the country’s energy security (page 68).
1.21 5.31 3.41 QLD/PEM VIC/ALK WA/ALK WA/PEM
7.01 3.04 2.67 4.03 ATR + CSS
NE/ALK
A selection of Platts hydrogen assessments by S&P Global Commodity Insights,
4.09
SMR + CSS
SMR without CSS
In this edition, we also carry several infographics to give a taste of our data
NW/ALK
2.6
WA/SMR+
showing regional price differences and month-on-month changes. Early
Coal gasification + CSS
trade potential is emerging as technologies and regions compete to produce
VIC/LIG VIC/PEM 6.79 Lignite gasification + CSS
visualization highlights, exploring topics from Russian crude flows (page 44), to the NW/PEM Rock/ALK SE/ALK UK/ALK UK/PEM 3.24 4.46
Jap/SMR
Rock/SMR
3.57 2.75 3.06 18.54 21.94 6.89 Producing region
looming deficit in lithium supply (page 65). the cheapest low-carbon hydrogen through water electrolysis powered by
←less change
United States
more change→
Rock/PEM
Om/ALK Om/PEM Qat/PEM SA/ALK SA/PEM
renewables or from fossil fuels with carbon capture and storage. Read more
UAE/ALK UAE/PEM Asia-Pacific
Qat/ALK
3.73 SE/PEM 3.58 4.66 3.55 3.23 4.26 4.51 5.74
4.08
Europe
NW/SMR
Finally, a warm welcome to those of you who are joining S&P Global as the Global 1.24 Middle East
SoCal/ALK UMW/ALK
Power Markets Conference returns as an in-person event. I hope this edition of
Scan here to explore and filter
SE/SMR
3.13 3.44 through production pathways
Qat/SMR+ and producing regions.
UK/SMR+ 6.89 SA/SMR+
Commodity Insights magazine will be a useful resource as you navigate the ever-
13.72 Om/SMR+
UK/ATR 6.93
UMW/PEM 6.97 UAE/SMR+
UMW/SMR
SoCal/PEM SoCal/SMR 4.55 8.46 7.03
4.23
changing energy markets. Big picture
Platts Infographics
Notes: Prices are month average cost-of-production assessments, including capex. European prices include carbon costs for SMR and ATR assessments. Prices for the Netherlands and UK are converted to $/kg from assessments in Eur/kg
and GBP/kg. Rank: 1 = lowest price. Darker shade means greater month-on-month price move.
Developed by James Burgess and Henry Edwardes-Evans. Designed by Reynaldo Dizon.
In a collection of visualization projects, S&P Global Commodity Insights’
wealth of data does the storytelling to illustrate some of the most significant
developments in commodity markets. Read more
6 Commodity Insights April 2022 April 2022 Commodity Insights 7
Advancing clean
                energy goals
                More than 20 states in the US have set aggressive clean energy
                plans, while 11 still have no state-wide goals. Kassia Micek
                writes about regional pushbacks and the lack of a federal plan

8 Commodity Insights                                                             April 2022   April 2022   Commodity Insights 9
Advancing clean energy goals
S
tate-level clean energy goals state aspire to at this point. Maryland is now the only
continued to evolve as seven state to have its ambitious target enshrined in law
when the act takes effect June 1.
states raised or set clean
energy targets in 2021, but so far After a similar bill failed in 2021, Maryland legislators
in 2022 Arizona regulators shot pared back a provision requiring all new buildings in
down stronger goals and a push by the state to be equipped with electric heating and
Virginia Republicans to repeal the appliances starting in 2023. Instead, the law directs
the state Building Code Administration to develop
state’s clean energy law failed.
recommendations on how to electrify buildings and
instructs state regulators to assess how such changes
Most of the 11 states with no statewide goal are in will affect the grid.
the Southeast, and it is unlikely these states will take
action on clean energy goals in the near term.
Virginia goal
“The political will isn’t there in any of these states,” said
Matt Williams, emissions and clean energy analyst A Virginia Senate committee February 28 stopped
at S&P Global Commodity Insights. legislation that would repeal the state’s clean energy generate electricity” by December 31, 2045, under the “I suspect some northeastern states will continue their
law. House Bill 118 was “passed by indefinitely” in Virginia Clean Economy Act. gradual push to hit their emissions reduction/clean
Nebraska’s three utilities have set goals to achieve a 12-3 vote by the state Senate Committee on energy targets,” Williams said.
net-zero emissions by 2050. The boards of Nebraska Commerce and Labor. Dominion must procure 100% of its electricity from
Public Power District, Omaha Public Power District renewable resources by 2045, with up to 5,200 MW of For instance, New York’s Scoping Plan could result
and Lincoln Electric System are elected by the public, The Virginia House of Delegates voted 52-48 on offshore wind in service by 2035. Appalachian Power in more complementary policies and perhaps even
essentially making Nebraska the first Republican-led February 15 to send House Bill 118 to the Democratic- must meet the renewables benchmark by 2050. new legislation, such as the Climate and Community
state to set decarbonization plans, despite any action controlled state Senate, where it encountered Investment Act, but Williams said he does not
from the legislature or governor. opposition. The bill was introduced in January by House-backed bills that will withdraw Virginia from see anything particularly new regarding changes
Republican Delegate Nicholas Freitas to essentially the Regional Greenhouse Gas Initiative carbon to overall goals.
Twenty-three states have aggressive clean energy repeal the Virginia Clean Economy Act and its cap-and-trade program and delay adoption of
plans either signed into law, written in executive order decarbonization goals. vehicle emissions standards also appear unlikely to A federal clean energy plan is unlikely, although a tax
or through aspirational goals set by the governor, advance in the Senate. credit extension is possible, Greenberg said.
according to a collection of data from S&P Global. The Democrats hold a 21-19 majority in the state Senate,
remaining states have some form of clean energy but are at risk of losing majority in the 2023 elections There is support in the US House of Representatives
plan on the books. when all 40 seats are on the ballot, Williams said.
Arizona actions and Senate for an electric industry clean energy tax
package that includes tax credits for a wide range of
The Virginia Clean Economy Act, signed into law by Ending years of discussion, the Arizona Corporation technologies. In November 2021, the US House passed
Maryland law former Democratic Governor Ralph Northam in April Commission voted 3-2 in late January to reject a the roughly $2 trillion Build Back Better Act along
2020, established that 16 GW of solar and onshore package of rules that would have required electric party lines. But the legislation has hit a wall in the
Maryland lawmakers recently approved the Climate wind, including 100 MW of rooftop solar, is in the utilities to get all of their power supply from carbon- evenly divided Senate, where all GOP lawmakers and
Solutions Now Act of 2022, which requires the state to public interest. The act replaced the state’s voluntary free resources by 2070. Senator Joe Manchin, Democrat-West Virginia, have
slash greenhouse gas emissions 60% by 2031 from renewable portfolio standard with mandatory annual opposed the bill.
2006 levels and to hit an economywide net-zero target benchmarks that would eventually require electricity In May, regulators also voted down a similar proposal
in 2045 after the state’s Republican governor declined suppliers to produce 100% of their electricity from that would have required utilities to receive all of their “It seems like tax credits are the only way forward
to veto the bill. renewable sources. power from carbon-free resources by 2050. in terms of legislation,” Williams said, adding the
Biden administration is developing rules of their own,
Governor Larry Hogan remains the only Republican Dominion Energy Inc. subsidiary Dominion Energy “The Republican majority on ACC believes that mandate particularly a new power sector emissions regulation
governor to join the US Climate Alliance, a group of Virginia – known legally as Virginia Electric and Power will raise rates and utility voluntary targets are is expected. However, there is a US Supreme Court
states committed to “real, impactful, on-the-ground Co. – and American Electric Power Co. Inc. utility sufficient,” said Morris Greenberg, senior manager of case – West Virginia versus EPA – that could really scale
action” to tackle climate change. Appalachian Power Co. must “retire all other electric North American power analytics at S&P Global. back Environmental Protection Agency’s authority to
generating units located in the Commonwealth that regulate CO2 emissions.
The new law puts Maryland on par with California in emit carbon as a byproduct of combusting fuel to It is unlikely there will be stronger clean energy
having a 2045 statewide net-zero goal, which no other goals in the state.
10 Commodity Insights April 2022 April 2022 Commodity Insights 11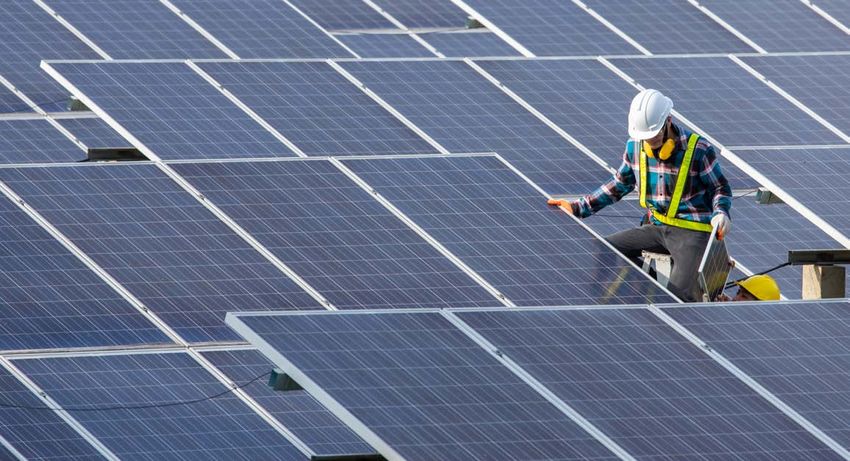
Advancing clean energy goals Advancing clean energy goals
Nearly half of US states have aggressive goals to cut GHG, add renewables
State renewable power and
greenhouse gas (GHG)
emissions reduction targets
Aggressive
ME
Moderate MT ND
WA
Minor
VT
No goal NY
SD NH
WY
OR ID MA
CA N MN CT
V
NE IA WI RI
UT MI PA
PACIFIC IL
IN OH NJ
OCEAN CO
DE
MO MD
KS
KY WV DC
AZ VA
NM NC
TX OK TN
AK AR
SC ATLANTIC
OCEAN
0 300 mi LA
AL GA
MS
FL P.R.
HI Gulf of Mexico
0 250 mi
Data as of April 2022
*Nebraskans elect the boards of state utilities and effectively set their GHG goals.
Source: S&P Commodity Insights, EIA, National Conference of State Legislatures, other associated sources for individual states and territories
12 Commodity Insights April 2022 April 2022 Commodity Insights 13
Advancing clean energy goals Advancing clean energy goals
State goals for greenhouse gas emissions reductions and renewable energy
Wind, solar Wind, solar
State Ultimate goal Status generation State Ultimate goal Status generation
market share market share
Alabama No goal 0% Surpassed (2007); governor discussed carbon neutrality by 2030
North Dakota 10% renewables by 2015 (voluntary) 34%
goal (voluntary)
Alaska 50% renewables by 2025 Established by House Bill 305 (2010) 2%
Ohio 8.5% renewables by 2026 RPS target lowered (2019) 3%
Arizona 15% renewables by 2025 REST (2006); ACC rejected 100% clean power plans (2021, 2022) 8%
Oklahoma 15% renewables by 2015 Legislature established goal (2010), goal exceeded 40%
Arkansas No goal 1%
Reduce GHG 100% by 2040 from
California 100% carbon-free power by 2045 Legislation last updated with SB 100 (2018) 25% Oregon Legislature passed HB 2021 (2021) 18%
1990 level
Colorado 100% clean energy by 2050 Governor signed SB 19-236 into law (May 2019) for Xcel Energy 29% Pennsylvania 18% renewables by 2021 Alternative energy portfolio standard (2004) 2%
100% carbon-free power by 2040 Governor signed executive order (2020); House passed net-zero
Connecticut Governor signed executive order (2020) 1% Rhode Island 100% renewables by 2030 6%
(aspirational) bill (2021)
Delaware 40% renewables by 2035 Governor signed legislation raising RPS (2021) 2% South Carolina 2% renewables by 2021 (voluntary) Legislature authorized (2014) 2%
Florida No goal 4% South Dakota 10% renewables by 2015 (voluntary) Legislation established (2008); some providers noted barriers 52%
Georgia No goal 4% Tennessee No goal 0%
Hawaii 100% renewables by 2045 RPS mandate (2015); first 100% renewable RPS in nation 13% Texas 10,000 MW by 2025 Mandate adopted (1999), Surpassed (2009) 23%
Idaho No goal 19% Utah 20% renewables by 2025 RPS adopted (2008) for electric utilities 10%
Illinois 100% clean energy by 2050 Legislation signed by governor (2021) 10% Vermont 80% below 2005 levels by 2050 RES adopted (2015); Global Warming Solutions Act (2020) 24%
Legislation (SB251) created Clean Energy Portfolio Standard Virginia 100% carbon-free power by 2045* Governor signed into law (2020); SB 851; HB 1526 3%
Indiana 10% renewables by 2025 (voluntary) 9%
(2011)
Washington state 100% carbon-free power by 2045 RPS updated (2019) 9%
Iowa No goal 55%
Washington, DC 100% renewables by 2032 RPS updated (2019) 12%
Legislation (SB91) changed RPS from a standard to voluntary
Kansas 20% renewables by 2020 (voluntary) 45% West Virginia No goal Repealed RPS in 2015 2%
(2015)
Kentucky No goal 0% Wisconsin 100% carbon-free power by 2050 Governor executive order set goal (2019) 3%
Louisiana Net-zero emissions by 2050 Governor signed executive order (2020) 0% Wyoming No goal 19%
Sources: S&P Global Commodity Insights, EIA, ACP, CESA, National Conference of State Legislatures, individual state agencies
Maine 100% renewables by 2050 Legislation signed by governor to increase RPS (2019) 25%
* for Dominion only; 2050 for Appalachian power
Maryland Net-zero emissions by 2045 Climate Solutions Now Act of 2022 takes effect June 1 3% **NPPD board approved commitment in December 2021; OPPD, LES approved net-zero goals in 2020. Nebraskans elect the boards of the state’s three utilities
Massachusetts Net-zero emissions by 2050 Governor signed climate change legislation into law (2021) 10%
Economy-wide carbon neutral by
Michigan Governor signed executive order to create plan (2020) 7%
2050
Definitions
100% carbon-free power by 2040
Minnesota Governor’s policy plan (2021) 24%
(aspirational) RPS Acronym for “Renewable Portfolio Standard,” which typically is a goal for renewable
Mississippi No goal 1% power generation
Missouri 15% renewables by 2021 (IOUs) Renewable Energy Standard approved by voters (2008) 8%
Net-zero emissions A balance between all emissions produced and the emissions removed from the
Montana 15% renewables by 2015 Goal enacted (2005) for investor-owned utility, retail supplier 12%
atmosphere; often interchangeable with “carbon neutral”
Nebraska Net-zero emissions by 2050** NPPD, OPPD, LES set net-zero goals (2021) 25%
Nevada 100% carbon-free power by 2050 Adopted in 1997, updated in SB 358 (2019) 16% Carbon neutral Some emissions are generated but are equally offset somewhere else to make
overall emissions zero
New Hampshire 25.2% renewables by 2021 RPS established (2007) 3%
New Jersey 100% carbon-neutral power by 2050 Governor unveiled Energy Master Plan (2020) 2% 100% clean energy Energy that produces no GHG emissions
New Mexico 100% carbon-free power by 2045 Last updated in Energy Transition Act (2019) 34%
100% carbon-free power by 2040 100% renewables All energy from renewable energy sources
New York Governor signed into law (2019) 4%
(aspirational)
100% carbon-free power Electricity generation that does not emit CO2
North Carolina Carbon-neutral power by 2050 Clean Energy Plan recommendations (2019) 8%
14 Commodity Insights April 2022 April 2022 Commodity Insights 15
Texas grid reliability in focus

                                     Texas grid reliability
                                     in focus
                                     Over a year since the deadly winter storm that crippled Texas’
                                     power system, regulators continue to work out solutions to prevent
                                     widespread power outages in the future. By Mark Watson

                                                                                                 ERCOT north hub summer and winter forwards

                                     E
                                           xperts differ regarding the summer                    120
                                                                                                       ($/MWh)
                                                                                                                                                                Jul-22
                                          2022 and winter 2022-23 pricing                                                                                       to Aug-22
                                           effects of Texas regulators’ work                     100
                                     with the Electric Reliability Council of
                                     Texas (ERCOT) to implement short-term                        80
                                                                                                                                                                Jan-23
                                                                                                                                                                to Feb-23
                                     market reforms for grid reliability.
                                                                                                  60

                                     The Public Utility Commission (PUC) of Texas approved
                                     in December 2021 a “blueprint” for market redesign           40
                                                                                                       Dec-21           Jan-22           Feb-22              Mar-22
                                     intended to satisfy mandates in Senate Bill 3, an omnibus
                                                                                                 Source: S&P Global Commodity Insights
                                     ERCOT market reform bill signed into law in June. The
                                     blueprint contained a Phase I covering reforms that could
                                     be implemented relatively quickly and a Phase II covering   systemwide offer cap (HCAP) from $9,000/MWh to
                                     more comprehensive, longer-term changes.                    $5,000/MWh – have already been implemented.

                                     The Texas Legislature enacted Senate Bill 3 and             Firm fuel product
                                     other changes in response to the widespread power
                                     outages that resulted from the deadly mid-February          The establishment of a type of ancillary service known
                                     2021 winter storm.                                          as a “firm fuel product” is considered a key effort which
                                                                                                 ERCOT plans to have in place for winter 2022-23, and
                                     Several of the Phase I efforts – e.g., allowing Emergency   which Giuliano Bordignon, a power market analyst at
                                     Response Service to be deployed before an Energy            S&P Global Commodity Insights, said is “the first real
                                     Emergency Alert is declared and lowering the high           milestone” of market reforms.

16 Commodity Insights   April 2022   April 2022                                                                                                    Commodity Insights 17
Texas grid reliability in focus Texas grid reliability in focus
ERCOT March 10 released an updated survey of the ERCOT’s existing firm fuel generation capacity by category ERCOT Phase I market redesign proposals’ tentative implementation timeline
existing generation fleet that shows about 4.4 GW
(GW)
of capacity with on-site alternative fuel storage that 10 Proposal What it is Implementation period Abbreviations
Generation with
could operate for about 24 hours, and another 3.7 GW firm nearby storage
8 and pipeline capacity AS: Ancillary Service
of resources that have facilities on-site, which are not Deploy ERS before EEA Allows ERS to be deployed before November 2021
currently operational. 6 Generation with consumers are urged to curtail demand BTM: Behind-The-Matter
inoperable on-site
alternative fuel
4 storage
“Depending on how it will be implemented, and how it HCAP at $5,000/MWh, MCL at 3 GW Adjusts ORDC price adder so higher January 1, 2022 DR: Demand Response
will interact with the weather-reliability standards … Generation with prices occur more frequently
2 operational
ECRS: ERCOT
we can expect the current momentum around market on-site alternative
0 fuel storage Contingency
changes to continue or slow down,” Bordignon said. 24 48 72 96 120 Load resource participation in NSRS Allows load resources to Summer 2022 Reserve Service
(hours)
“Both [the firm fuel product and weather reliability participate in NSRS
Source: Electric Reliability Council of Texas
standards] are bearish drivers for wholesale prices EEA: Energy
– in the winter as well as summer – as they address Biannual ORDC report to PUC Updates on ORDC scarcity Q4 2022 Emergency Alert
potential scarcity at times of high demand, but together Alison Silverstein, an independent consultant working pricing effectiveness
ERS: Emergency
they might end up being too aggressive for market in the power sector who has worked at the PUC, the Response Service
participants accustomed to high scarcity prices.” Federal Energy Regulatory Commission and a major FFRS Pays for primary frequency response Q4 2022
public utility, said the impact on power prices this separately from RRS FERC: Federal Energy
Others, however, see market rule changes and summer “will be higher and more unpredictable, since Regulatory Commission
potential increases in spending related to new and we will likely remain in drought and see even … higher ECRS Creates a new AS to back up RRS Early 2023
FFRS: Fast Frequency
more frequent use of ancillary services as increasing [than] normal temperatures.” or frequency regulation service to Response Service
“costs to the market.” mitigate EEA risk
HCAP: High Systemwide
ERS procurement practices Changes how ERS is bought, whether by Six months after NPRR change Offer Cap
quantity, price or expenditure limit
IRR: Intermittent
Renewable Resource
ERS seasonal apportionment Adjusts ERS quantities to account for Six months after NPRR change
increased risk in non-summer periods ISO: Independent System
Operator
Decouple VOLL from HCAP Could result in ORDC price adders being Six to 12 months after PUC rule change
LMP: Locational
higher more frequently Marginal Price
Firm fuel product Creates a new AS ensuring enough Winter of 2022-23 MCL: Minimum
fuel is on-site to for a specific period Contingency Level
NPRR: Nodal Protocol
Backstop Reliability Service* Creates a new seasonal or annual AS to After firm fuel product implementation Revision Request
back up potential loss of IRRs
NSRS: Non-Spinning
LMPs for load resources Switches load-managed resources Controllable resources to get LMPs 24 Reserve Service
(DR or BTM generation) from zonal months after NPRR change
ORDC: Operating Reserve
to nodal pricing Demand Curve
Study customer aggregation in DR Allows aggregated power demand to After completion of study of other ISOs’ PUC: Public Utility
participate in wholesale power markets implementation of FERC Order 2022 Commission of Texas
RRS: Responsive
Voltage support service Creates a new AS to safeguard against Unknown — competes with ECRS, FFRS, Reserve Service
wide voltage level deviations firm fuel product
VOLL: Value of
*Considered part of Phase II, but prioritized to be implemented alongside Phase I. Lost Load
Source: ERCOT
18 Commodity Insights April 2022 April 2022 Commodity Insights 19“Wholesale prices winter 2022-23?” Silverstein said. than they did in December, when the PUC adopted its trying to tell ERCOT and others to reserve a substantial The PUC and ERCOT are failing to analyze and
“Again, higher, because none of the measures that market redesign blueprint. amount of non-spin for generation, so [I’m] not sure if it understand the grid’s operational reliability problems
the PUC and ERCOT are undertaking consider cost- will be a huge savings compared to present day.” “with current and growing energy resources and
competitiveness, cost-effectiveness or affordability.” ERCOT North Hub on-peak July-August power demand,” Silverstein said.
averaged about $106/MWh in March, up from $84.10/
MWh in December, while on-peak January-February ‘Spending ... like drunken sailors’ “They are doing even less to accurately recognize
Winterization 2023 power averaged about $74.75/MWh in March, up and account for the cost consequences of their
from about $57/MWh in December. Silverstein said the PUC and ERCOT’s plans indicate current and proposed reliability-improving policies
Mandatory winterization of generation was “Texas’ that they “are chasing the wrong reliability problem.” and practices,” Silverstien said. “They’re spending
single most important reliability improving measure,” “Despite the reduction in the cap to $5,000, there is customers’ money like drunken sailors under the flag
Silverstein said. little doubt that the more conservative approach to “On the operational level, … the PUC’s market changes of improving reliability, while hoping that the PUC’s
acquiring ancillary services, the increase in services are addressing resource adequacy by trying to unwillingness to demand an accounting will continue to
“Unfortunately, since the gas supply has not similarly like ERS, [Non-Spinning Reserve Service], and Firm increase the amount and availability of mostly thermal obscure whether these measures are working and how
been winterized, and gas contracting, delivery Fuel will increase costs to the market, particularly in generation and industrial-scale load resources,” much they cost.”
and pricing have not received similar scrutiny the winter,” said Cyrus Reed, conservation director at Silverstein said. “But paying lots more money to
and correction, the other measures now under the Lone Star Chapter of the Sierra Club. large, old fossil generators won’t solve the ramping
consideration may have limited reliability impact in a problem, and the industrial customers who are willing
future arctic event,” Silverstein said. Phase I reforms also included a provision that demand to take ERS payments won’t want to deliver regular
response participate in the NSRS ancillary service, DR for ramping.”
Judging by summer and winter forward markets, which Reed noted March 23 “could actually lower
traders foresee greater risk of higher prices currently prices for that service, but certain generators are
20 Commodity Insights April 2022 April 2022 Commodity Insights 21Blending for decarbonization Utilities across the US are experimenting with combining power generation capabilities, including next-generation gas turbines that offer hydrogen capabilities. By Brandon Mulder
Blending for decarbonization
S
everal US power utilities are Manufacturer Turbine model Blending rate
moving in the hydrogen direction
GE 7Ha.002 15%-20%
as they experiment with hydrogen
blending in natural gas turbines and GE 7Ha.003 50%
announce goals of replacing gas with
100% hydrogen by midcentury. Siemens SGT industrial gas turbines 15%-60%
Siemens SGT heavy-duty turbines 30%
One of the latest hydrogen commitments from the
power sector came earlier this year when Duke Energy Mitsubishi Power Americas M501JAC 30%
announced a $4 billion investment in hydrogen-
enabled natural gas generation as the utility winds Wärtsilä 34SG 25%
down its coal assets. During the company’s latest
quarterly earnings call, CFO Steve Young said “we INNIO Type 4 gas engines up to 100%
believe our natural gas units are well-positioned to
take advantage of hydrogen technology as it evolves.” Rolls-Royce Series 500, Series 4000 25%
Duke’s announcement builds on hydrogen’s momentum Existing gas ~5%
in the power sector. In 2020, the Long Ridge Energy combined cycle turbines
Terminal in Ohio announced plans to transition a
485-MW gas-fired power plant to run on General Source: Turbine manufacturers
Electric’s new hydrogen-capable turbine, which is able
to burn a gas stream blended with 15%-20% hydrogen.
On the Gulf Coast, Entergy Texas is developing the investments, like advanced nuclear plants, utilities can
Orange County Advanced Power Station, a 1,215-MW leverage existing facilities to begin blending hydrogen
power facility along the Texas-Louisiana border that at low levels in the near term, then ramp up to higher
will be capable of using 30% hydrogen by 2026 using levels over time.
turbines developed by Mitsubishi Power.
A Duke Energy pilot project, for instance, has an initial flame further away and don’t melt themselves,” said and a variety of companies have brought a range of
Experimentation with hydrogen blending in turbines goal of co-firing hydrogen in gas plants at a 30% rate Joshua Rhodes, a research associate at the University hydrogen-capable turbines to market in recent years.
is happening elsewhere around the US as well, by 2024 and a midterm goal of 100% hydrogen by 2030. of Texas Energy Institute. “If you were to try to run high
including in Siemens Energy’s Intermountain Power blends of hydrogen in an older vintage facility, you General Electric, for instance, has its 7Ha models
Project in Utah and Mitsubishi’s proposed $1 billion “I think investors really like that it can do that smoothing would essentially get what they call blowback, and it that are capable of blending up to 50%. And the gas
facility slated to produce green hydrogen for gas-fired of the transition – I think that’s very compelling,” Kizer would melt itself from the inside.” technology company INNIO claims its converted
turbines in Montana. said. “There’s scalability in your financial commitment.” gas turbine can run on a variable fuel mix with up
Yet there are some older vintage turbines capable to 100% hydrogen.
“Hydrogen does a lot of things that we really need done,” of burning gas streams with low levels of hydrogen,
said Alex Kizer, senior vice president of research and The right blend and there are a variety of factors that determine But the full impacts of incorporating hydrogen
analysis at Energy Futures Initiative. “We need clean, blending capability – turbine age, the speed of turbine into the gas system remain to be seen. Policy
flexible, load-following resources for the grid, and There are unique challenges to blending hydrogen in rotation, and, among others, the size of the hydrogen support to usher hydrogen into the power sector
these are things that gas generally does today, where gas streams at all points along the value chain. Within versus gas molecules. will be critical, Kizer said, but it’s not yet clear what
you can call on it at any time. Many people are thinking turbines, gas and hydrogen respond differently to policy mix will be necessary or how it could impact
that that’s maybe something hydrogen can do, too.” combustion. Hydrogen ignites faster than gas, which “These are tuned instruments, and you really got to consumer-level prices.
brings the flame closer to the nozzle through which the understand how this different product will impact your
The move toward hydrogen in the power sector is also gas stream comes. expensive assets,” Kizer said. “It’s vitally important that we figure this out, and I think
attractive to investors, Kizer said, because hydrogen utilities are spending time experimenting right now,”
allows utilities to start small. In contrast with other “Because hydrogen combusts so much faster, you have Raising blending levels up to the 30% range and beyond Kizer said. “There [are] unique challenges to actually
clean technologies with high upfront capital spending to design the nozzles differently so that they keep the typically requires a whole new category of technologies, generate electrons from hydrogen.”
24 Commodity Insights April 2022 April 2022 Commodity Insights 25Of pathways
and prices
James Burgess explains how high costs of
hydrogen production in Europe opens the doors
to imports from the US and the Middle East
26 Commodity Insights April 2022 April 2022 Commodity Insights 27Of pathways and prices Of pathways and prices
H2GLOBAL AUCTION MODEL FOR GERMAN HYDROGEN IMPORTS
S
oaring feedstock gas and power prices H2Global auction model for German hydrogen imports
following Russia’s invasion of Ukraine
February 24 have sent hydrogen cost
Price (demand, supply)
of production assessments sharply higher HPA, eg. 10 years
in Europe, underlining the region’s potential Compensating
the price
for imports of the renewable energy carrier. difference Effect of market
regulation
HSA, eg. 1 year
The UK remained the highest priced region globally for
Time
low-carbon hydrogen production, with the Netherlands
Note: actual HSA values depend on annual tenders
close behind, the S&P Global Commodity Insights Source: H2Global
Hydrogen Price Wall showed.
UK electrolysis production prices averaged around production costs in Australia and the Middle East are
$20/kg in March, more than six times the cheapest lower than fossil-based production with CCS in the
locations in Western Australia and the US Midcontinent. same locations.
UK prices were more than 40% higher than in Japan,
another potential importer. Low production costs Prices also rose sharply in Japan, with knock-on
in Australia, meanwhile, highlighted the country’s effects from global surging LNG prices following the
credentials to supply Japan and South Korea. Russian invasion and an earthquake that hit northern
Japan March 16, temporarily shutting down several
“Understanding how differences in regional power thermal power plants in the region.
markets impact hydrogen production costs around
the world will be an increasingly important factor in The data showed the comparative cost advantage CCS-
determining future trade flows,” S&P Global Head based low-carbon hydrogen pathways have in Europe
of Energy Transition Pricing Alan Hayes said. “These versus electrolysis.
regional differences will also be important for decision
makers who want to compare options to achieve the “While most European countries are focused on Key to achieving this target will be imports, The agency is developing a World Trade Organization-
most cost-effective routes to decarbonization.” expanding hydrogen produced from electrolysis, with Germany in particular signing a series of compliant catalogue of standards, focused on ensuring
the UK government has provided a ‘twin-track’ agreements with major potential global producers of project additionality and trustworthy certification
“As well as regional comparisons, understanding the hydrogen strategy recognizing the role of fossil green hydrogen. of renewable hydrogen. Westphal said certification
different options across different production pathways plus CCUS [carbon capture, utilization and storage] across the supply chain was challenging for
is also vital when considering the most appropriate hydrogen as a pathway to achieve carbon emissions Europe’s leading economy has signed bilateral many countries.
option in each region,” Hayes added. reduction,” said S&P Global Future Energy Signposts alliances on hydrogen production with countries
Manager Anne Robba. including Chile, Australia, Canada, Morocco, Namibia, The focus on existing liquid markets for ammonia,
The US is emerging as a low-cost steam methane Saudi Arabia and Ukraine. methanol, and jet fuel ensured there was ready
reforming hydrogen production center, with that demand for green versions of the products, Westphal
production pathway shown as the cheapest globally. Security of supply Germany’s H2Global import initiative plans to open a said, allowing new applications in transport or power
The Hydrogen Price Wall shows the lowest cost region first auction window for a 10-year contract for green generation to emerge.
for hydrogen production (via conventional steam The energy security of supply crisis in Europe triggered ammonia imports in the second quarter of 2022, with
methane reforming without carbon capture and by Russia’s aggression in Ukraine has prompted an a first cargo expected in 2024, a senior adviser for the With interest in hydrogen imports to Europe coming
storage, or CCS) was the US Midcontinent at just acceleration of energy transition policies across the government-funded agency said April 4. thick and fast, several companies have been outlining
$1.21/kg. Prices slipped below other US regions, with continent, including specific measures for hydrogen. plans for hydrogen and ammonia terminals, as
power and gas input prices falling steeply on mild The first sale is planned for 2023, Kirsten Westphal, well as agreements to ship the energy carrier to
weather and reduced demand. The European Commission has brought forward executive director analysis at the H2Global Foundation, European ports.
increased hydrogen production capacity targets told S&P Global in an interview.
The price wall also shows, however, that in locations by 2030 in response, aiming for 20 million mt/year,
where power feedstock is cheap, electrolysis double the initial target set out in the EU’s hydrogen “We are hearing from the industry that H2Global with
production is already under $3/kg. Electrolysis strategy from 2020. its criteria will set the gold standard for a lot of other
deals,” Westphal said.
28 Commodity Insights April 2022 April 2022 Commodity Insights 29Of pathways and prices Of pathways and prices
Platts hydrogen price wall
Larger panels represent higher prices. Prices in $/kg as of end-March.
Below is a selection of S&P Global Commodity Insights hydrogen assessments showing regional price differences and
month-on-month changes. Early trade potential is emerging as technologies and regions compete to produce the cheapest
low-carbon hydrogen through water electrolysis powered by renewables or from fossil fuels with carbon capture and storage.
Gulf/ALK NoCal/PEM NoCal/SMR Ned/ALK Ned/PEM Ned/SMR+ NSW/ALK NSW/PEM QLD/ALK Jap/ALK Key
Mid/ALK
2.93 4.56 1.58 8.89 4.64 6.31 6.9 12.89
17.47 20.71
WA/ALK Area/pathway
2.67 Mar-22 avg price
Gulf/SMR
Gulf/PEM 1.23 Pathway symbol
3.91 Price direction
Mid/PEM NSW/COAL
3.92 QLD/COAL
2.98 Production pathway
4.1
PEM electrolysis
Ned/ATR Jap/PEM
Mid/SMR NE/PEM NoCal/ALK 10.03 15.68
NE/SMR
Alkaline electrolysis
1.21 5.31 3.41 QLD/PEM VIC/ALK WA/ALK WA/PEM
7.01 3.04 2.67 4.03 ATR + CSS
NE/ALK
4.09
SMR + CSS
SMR without CSS
NW/ALK
2.6 Coal gasification + CSS
WA/SMR+
VIC/LIG VIC/PEM 6.79 Lignite gasification + CSS
NW/PEM Rock/ALK SE/ALK UK/ALK UK/PEM 3.24 4.46
Jap/SMR
Rock/SMR
3.57 2.75 3.06 18.54 21.94 6.89 Producing region
←less change more change→
United States
Rock/PEM
Om/ALK Om/PEM Qat/PEM SA/ALK SA/PEM UAE/ALK UAE/PEM Asia-Pacific
Qat/ALK
3.73 SE/PEM 3.58 4.66 3.55 3.23 4.26 4.51 5.74
4.08
Europe
NW/SMR
1.24 Middle East
SoCal/ALK UMW/ALK Interactive
SE/SMR
3.13 3.44 Scan here for the latest
updates on the Hydrogen
Qat/SMR+
UK/SMR+ 6.89 SA/SMR+
Price Wall.
13.72 Om/SMR+
UK/ATR 6.93
UMW/PEM 6.97 UAE/SMR+
UMW/SMR
SoCal/PEM 8.46
SoCal/SMR
4.55 7.03
4.23
Notes: Prices are month average cost-of-production assessments, including capex. European prices include carbon costs for SMR and ATR assessments.
Prices for the Netherlands and UK are converted to $/kg from assessments in Eur/kg and GBP/kg. Darker shade means greater month-on-month price move.
Developed by James Burgess and Henry Edwardes-Evans. Designed by Reynaldo Dizon.
30 Commodity Insights April 2022 April 2022 Commodity Insights 31Russia crisis
exacerbates tension
between climate and
energy security risks
Whether US shale producers could help to boost non-Russian
supplies in the global market has now become a trickier debate.
By Meghan Gordon
32 Commodity Insights April 2022 April 2022 Commodity Insights 33Russia crisis exacerbates tension between climate, energy security risks Russia crisis exacerbates tension between climate, energy security risks
S US Gulf of Mexico fields rank
piking oil and gas prices and
pressure to shun Russian energy
imports in the days after the
Ukraine invasion forced a colossal rethink
among the lowest for carbon
of the Biden administration’s approach
to domestic oil and gas production.
intensity in the world, according
to the latest calculations by
S&P Global Commodity Insights
The flows had already fallen off while US lawmakers
were still debating a formal ban, and Treasury
Department guidance continued to permit energy
transactions through sanctioned Russian banks.
“With industry’s help, Biden could negotiate bipartisan
Whether US shale producers could contribute to a support for carbon price in exchange for pro-
global increase in non-Russian supplies became a industry measures such as fast-tracking permits,”
trickier debate, with some drillers saying investors he said March 7.
remained wary of anything but slow growth while many
progressive Democrats argued the crisis shows the By analyzing satellite data from 2019 and 2020,
need for a quicker energy transition. Kayrros created the first systematic estimate of
large methane leaks, finding about 1,800 so-called
A bill by Senator Ed Markey, Democrat-Massachusetts, “ultra-emitters,” of which 1,200 came from oil and
said the US should go further than just banning gas facilities. Those high-emitting events, which
Russian imports by developing a comprehensive are normally undetectable and not accounted for in
strategy to replace the barrels with “domestic carbon- national greenhouse gas inventories, represented as
free energy sources” and accelerate investments in much as 12% of global methane emissions from the oil
renewable energy. and gas industry, according to the study.
“Actively decarbonizing the United States energy The study demonstrates that climate-related data is
economy is of vital strategic interest to the national improving every day, potentially creating more political
security and climate change reduction targets of support for carbon pricing that distinguishes between The Oil and Gas Climate Initiative, a CEO-led S&P Global Analytics’ calculations represent the
the United States,” Markey said in the bill, called the cleaner and dirtier upstream sources. consortium of companies responsible for about one- greenhouse gas emissions of a field’s current
the “Severing Putin’s Immense Gains from Oil third of global production, has set targets to reduce operations from the wellhead to storage or export
Transfers (SPIGOT) Act.” US Gulf of Mexico fields rank among the lowest for upstream carbon intensity to 17 kgCO2e/boe by 2025 terminal, including upstream activities like flaring and
carbon intensity (CI) in the world, according to the and bring an end to routine flaring by 2030. Of the 104 venting but not exploration and drilling.
And yet other longtime climate champions, like State latest calculations by S&P Global Commodity Insights. fields ranked by S&P Global, 39 would currently meet
Department envoy John Kerry, started talking about the 2025 target. The calculations show a massive range of upstream
natural gas as a bridge fuel again. The updated rankings published February 15 look at impact, from 1.6 kgCO2e/boe for Norway’s
the carbon intensity of 104 crude streams across the Producers are reducing upstream emissions through offshore Johan Sverdrup to 1,460 kgCO2e/boe for
The US imported 672,000 b/d of Russian petroleum in world, with values expressed in kilograms of carbon cogeneration facilities, modernizing compression Venezuela’s Orinoco Belt.
2021, including 199,000 b/d of crude. dioxide equivalent per barrel of oil equivalent. plants, improving leak detection, ending venting and
reducing flaring. Offshore UK and Norway producers increasingly use
But how to encourage more supply in the short term Many oil and gas producers are scrutinizing the renewable power to run their platforms instead of coal
without sacrificing climate ambitions? emissions impact of their portfolios to determine Environmental groups say the efforts do nothing or natural gas, which sharply reduces emissions for
which fields will have staying power as fossil fuel to eliminate Scope 3 emissions, which are the vast barrel produced.
Antoine Halff, co-founder and chief analyst at Kayrros, investment shrink. Carbon pricing and other climate majority of global warming emissions tied to the
contends that striking that balance is possible. policies could create a premium for the least- use of fuels in airplanes, cars, petrochemicals and Offshore Gulf of Mexico production also claims low
intensive crude streams. elsewhere downstream. carbon intensity because advanced subsalt imaging
practices have helped drillers target the most efficient
34 Commodity Insights April 2022 April 2022 Commodity Insights 35Russia crisis exacerbates tension between climate, energy security risks Russia crisis exacerbates tension between climate, energy security risks
Chasing the lowest-carbon crudes
Global oil producers are increasingly touting efforts to reduce the carbon intensity of their upstream operations to stand out as investment dollars
shrink during the energy transition. Some producers see carbon intensity rankings as a measure of which fields will have staying power, while
environmental groups say the efforts ignore the much larger global warming emissions created downstream when the oil is refined for transportation,
shipping, petrochemicals and other uses. S&P Global Commodity Insights has expanded its carbon intensity calculations to include 104 fields,
representing the greenhouse gas emissions of current operations from the wellhead to storage or export terminal.
Sunrise
5x
AB
SK
scale
Firebag
Canada oil sands MacKay River
Long Lake Canada shale Carbon intensity estimates
Producers rely on carbon- Water recycling will be key (kgCO2eq/boe, January 2022)
intensive steam injections Surmont to reducing emissions from
but can offset emissions MEG Christina
175
CVE Christina Lake the supply-chain 100 Oil field
with cogeneration and Lake challenges of formations 50
solvent-based technolo- Jackfish
with high water content. 10
gies. Kirby Lake Foster Creek
Cold-Lake
Primrose/
AB Wolf Lake
SK
Montney
Hibernia
Hebron
Cardium Middle East
Viking CANADA Aging fields with strong output and
Bakken limited flaring rank among the lowest
emitters, on par with some global
ND offshore sources.
Bakken
WY
CA Powder-River Kirkuk
UT IRAN
U N I T E D S TAT E S Utica Onshore US shale IRAQ
Uinta OH Methane leaks and routine
CO Zubair West Qurna
Denver- KS
flaring have created a wide gap Rumaila Marun
Salina
Julesburg in carbon intensity among US
Anadarko shale producers, although all Burgan Ghawar
San-Joaquin TX OK will face tougher federal rules Zuluf
CA-Coast under a new EPA proposal. Safaniya Fateh
SCOOP-STACK
reservoirs. These fields range from 12.1 kgCO2e/boe to by the need for gas-powered steam injections to Permian Permian
Offshore North America SAUDI Murban
Delaware other LA ARABIA
23.1 kgCO2e/boe under the latest estimates. mine the heavy bitumen. Some producers are trying Permian Gulf-Coast-Louisiana Advanced seismic imaging to
Dukhan
Midland target the most-efficient
to lower emissions with cogeneration and solvent- Eagle reservoirs and strong output
0 500 mi Ford per well help limit emissions
Kuwait’s Burgan field, new to the list, is the lowest based assistance. 0 500 km footprints.
0 250 mi
0 250 km
onshore stream at 16.8 kgCO2e/boe.
MEXICO Great-White
California’s medium to extra-heavy San Joaquin oil LA
S&P Global carbon analyst Varaleka Pant said Burgan – ranks second-highest on the list at 177.9 kgCO2e/boe
Horn-Mountain
along with Saudi Arabia’s offshore Safaniya and UAE’s because the aging field requires large steam injections 3.5x
Appomattox
Schrader-Bluff scale Leo
onshore Fateh, both of which are below 20 kgCO2e/boe and heavy water management. AK Alpine Europa
Prudhoe-Bay Thunder
– show that even aging fields can have low per-barrel Kuparuk-River Auger Mad-Dog Horse
Shenzi Devils
carbon intensities, given high production volumes and The extreme carbon intensity of Venezuela’s Orinoco Tahiti Tower
Atlantis Offshore UK and Norway
limited flaring. belt shows that this crude stream would face Julia
Big-Foot
Chinook
Using offsite renewable Goliat
energy instead of onsite coal
challenges in a world with tight carbon budgets, even 0 500 mi Lucius Stones or gas for power sharply
Jack lowers platforms' carbon
if not for the existing sanctions limiting its reach. The 0 500 km
intensity.
Cleaning up the upstream crude has high levels of dissolved gas that gets flared Rest of world Heidrun
out, and the fields use energy-intensive processes like Some offshore projects have started capturing associated
gas to transport to local LNG facilities. In Venezuela,
Methane controls largely determine where US onshore delayed coking and hydrocracking to upgrade the crude flaring of dissolved gas and energy-intensive processing Statfjord NORWAY
exacerbate its heavy crude's carbon footprint.
shale drillers fall on the CI scale, and the entire sector quality, Pant said. Snorre
Samotlor Clair Gullfaks
will be forced to tighten these emissions further under Oronoco
(Venezuela) RUSSIA Schiehallion Troll
Tengiz Oseberg
Kraken
the Environmental Protection Agency’s latest proposed “Reduction in wellhead flaring and adoption of AZE.
KAZ. Bozhong Mariner Alvheim
Waha Captain Grane
methane rule. US onshore operations range from about integrated energy technologies such as cogeneration Azeri CHINA Ivar-Aasen
Golden-Eagle Johan Sverdrup
Cantarell Edvard-Grieg
18.1 kgCO2e/boe in the Permian and Delaware basin systems can help significantly bring down the carbon MEX. LIBYA
Bombay High
Buzzard
Ekofisk
Cusiana Bonga Catcher
to 95.4 kgCO2e/boe near the Louisiana Gulf Coast, intensity for the oil-rich Orinoco Belt,” she said. ECU.
VEN. NIGERIA
INDIA
Valhall
Agbami North
according to S&P Global. Sacha
BRAZIL Girassol UNITED Sea
ANG. KINGDOM
Tupi
Canadian oil sands operations on the list have CI 0 500 mi
0 500 km
values of 43.6 kgCO2e/boe to 119.8 kgCO2e/boe, driven
Source: S&P Global Commodity Insights Developed and designed by Meghan Gordon, Varaleka Pant, and Ginny Mason.
36 Commodity Insights April 2022 April 2022 Commodity Insights 37You can also read