Electron Backscatter Diffraction Study of Ultrahigh-Pressure Tso Morari Eclogites (Trans-Himalayan Collisional Zone): Implications for Strain ...
←
→
Page content transcription
If your browser does not render page correctly, please read the page content below
GeoScienceWorld
                Lithosphere
                Volume 2022, Article ID 7256746, 20 pages
                https://doi.org/10.2113/2022/7256746

                Research Article
                Electron Backscatter Diffraction Study of Ultrahigh-Pressure Tso
                Morari Eclogites (Trans-Himalayan Collisional Zone):
                Implications for Strain Regime Transition from Constrictional to
                Plane Strain during Exhumation

                             Alosree Dey,1,2 Koushik Sen ,1,2 and Manish A. Mamtani3
                             1
                               Wadia Institute of Himalayan Geology, 33 GMS Road, Dehradun 248001, India
                             2
                               Academy of Scientific and Innovative Research, Ghaziabad, Uttar Pradesh 201 002, India
                             3
                               Department of Geology and Geophysics, Indian Institute of Technology, Kharagpur 721302, India

                             Correspondence should be addressed to Koushik Sen; koushik.geol@gmail.com

                             Received 9 November 2021; Accepted 19 February 2022; Published 16 March 2022

                             Academic Editor: Francis McCubbin

                             Copyright © 2022 Alosree Dey et al. Exclusive Licensee GeoScienceWorld. Distributed under a Creative Commons Attribution
                             License (CC BY 4.0).

                             The Tso Morari Crystalline Complex (TMCC) of trans-Himalaya (eastern Ladakh, India) contains enclaves of ultrahigh-pressure
                             eclogites that underwent deep burial (≥80 km) and subsequent rapid exhumation during continental subduction, collision, and
                             final accretion of the Indian plate with the Eurasian plate. We present an electron backscatter diffraction (EBSD) study of eight
                             eclogite samples to investigate the deformation mechanism and strain regimes active during peak (HP) metamorphism and
                             subsequent postpeak rapid exhumation of the TMCC. Our study shows that the least retrogressed eclogite exhibits strong
                             linear fabric (L tectonite) characterized by omphacite, having [001] axes parallel to and (110) poles perpendicular to lineation.
                             These features concur with constrictional strain during peak (HP) metamorphism. A transitional planolinear fabric (LS
                             tectonite) is shown by other eclogites that show petrographic evidence of omphacite alteration to amphibole and the presence
                             of lower metamorphic grade minerals like actinolite and chlorite. Characteristics of lattice preferred orientation (LPO) of
                             omphacite and quartz, indicated, respectively, by the LS and B indices, also suggest variation in strain regime from pristine
                             eclogites to their altered counterparts. Based on these results, it is suggested that a constrictional strain regime prevailed during
                             peak (HP) metamorphism in the TMCC due to the buoyant rise of TMCC in response to slab break-off and reverse slab pull
                             during and after the deepest continental subduction. This buoyant rise was also facilitated by compression related to the
                             ongoing India-Eurasia collision. This regime evolved later to plane strain that was superimposed on the UHP rocks at a
                             shallower depth. It is plausibly associated with foliation-parallel extension during exhumation at midcrustal depths. A high-
                             temperature prism c-slip in quartz shown by few samples is interpreted to have formed due to a subsequent granulite facies
                             metamorphic overprint on the eclogite during collisional thickening.

                1. Introduction                                                                              by a subducting oceanic slab, and this transition of the con-
                                                                                                             tinental crust rocks at convergent margins, from subduction
                An important aspect regarding accretion and growth of con-                                   to exhumation, can be explained by a single process that is
                tinents is continental subduction, which is often manifested                                 breaking off of the subducting slab [3]. However, mecha-
                by the presence of high-pressure (HP) to ultrahigh-pressure                                  nisms of continental crust exhumation to the surface are
                (UHP) rocks [1, 2]. The exposures of HP or UHP metamor-                                      complex, varied, and currently debated. Numerous tectonic
                phic rocks on the Earth’s continental crust constitute an evi-                               models explaining exhumation of HP/UHP metamorphosed
                dence for their exhumation subsequent to deep subduction                                     slices of continental crust have been proposed so far. These
                and continental accretion. It is generally accepted that conti-                              are exhumation by extension facilitated by detachment fault
                nental crust can be subducted to great depths if it is pulled                                [4, 5], extensional collapse [6], foreland propagating

Downloaded from http://pubs.geoscienceworld.org/gsa/lithosphere/article-pdf/doi/10.2113/2022/7256746/5569363/7256746.pdf
by guest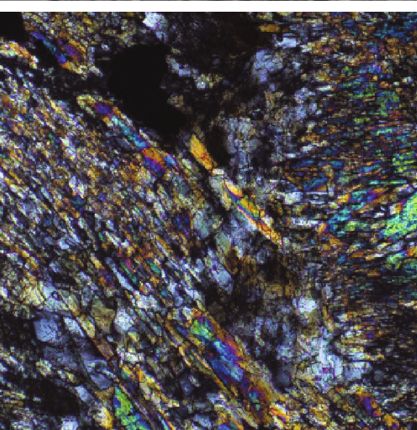
2                                                                                                                                                         Lithosphere

                thrusting [7], buoyancy assisted by erosional and tectonic
                processes [8], corner flow [9, 10], and channel flow [11].                                                       L-type                                z
                Cloos and Shreve [12] introduced and described the organi-                                                 [001]    [010]
                                                                                                                                                                      y      x
                                                                                                                                               LS-type
                zation and dynamics of subduction channels to explain effi-                                                                   [001]   [010]
                cient exhumation of blueschists and eclogitic rocks and their
                structural/deformational relationships with the surrounding                                                Prolate strain
                units from the footwall (downgoing plate) and hanging wall                                                                  Plane strain
                (mantle wedge) realms. In this tectonic context, serpentinite,                                                                           SL-type
                                                                                                                                                      [001]   [010]
                formed due to hydration of the overlying mantle wedge at
                sub-Moho depths of the subduction channel, acts like a
                lubricant and facilitates exhumation ([13] and references
                therein).                                                                                                                                  Plane strain
                    Field and microstructural studies conducted by various
                research groups have provided new insights into the kine-                                                                                       S-type
                                                                                                                                                            [001]    [010]
                matics and tectonic evolution of paleosubduction channels
                [14–17]. Most of these studies focus on exhumed HP rocks,
                which are highly strained [18] and often present as relics or
                inclusions within retrograded lithologies [19]. One of the                                                                                   Oblate strain
                most important devices used for the textural and microfabric
                                                                                                             Figure 1: The Flinn diagram representing L-type to S-type
                analyses of HP/UHP rocks is electron backscatter diffraction
                                                                                                             omphacite fabrics along with their interpretation in terms of
                (EBSD) [20, 21]. Lattice preferred orientation (LPO) pat-
                                                                                                             strain geometry (after Keppler [7]).
                terns of omphacite in eclogite have been studied in the past
                by various workers using either the universal stage ([22, 23];
                also see [24, 25] for reviews) or EBSD [26–37]. These studies                                into geodynamic processes operating during subduction
                have demonstrated that in omphacite LPOs, lineation-                                         and exhumation of HP/UHP rocks. In this regard, the pet-
                parallel [001] maxima and foliation-parallel girdle distribu-                                rofabric study of UHP eclogites can contribute to fill the
                tion represent constriction and flattening strains, respectively                              gap, since it can shed light on the strain regime and defor-
                (Figure 1) ([25] and references therein). The two end-                                       mation mechanisms that prevailed during different stages
                members, namely “L-type” (constrictional) and “S-type”                                       of their tectonic evolution.
                (flattening), can be correlated with the prevailing strain
                regime during high-pressure deformation [23, 24, 26, 27,                                     2. Geological Setting
                34, 38] . The LS and SL types show the poles to (010) planes
                clustered perpendicular to the foliation and the [001] axes                                  The ISZ consists of various lithounits, namely the Zildat
                concentrated parallel to the lineation (Figure 1). Any                                       Ophiolitic Mélange, which is present between the HP/UHP
                second-order variation in either “L-” or “S-” type LPOs in                                   TMCC and remnant of the Tethyan Oceanic block or the
                omphacite can be used to identify coaxial and/or noncoaxial                                  Nidar Ophiolitic Complex (Figure 2(b)) [49]. The TMCC
                strain regimes that might be associated to heterogeneous                                     represents the north Indian continental margin that under-
                simple shear, plane strain, transpression, transtension, or                                  went ultrahigh-pressure metamorphism during Indo-
                other specific deformation geometries [25].                                                   Eurasian continent-continent collision [50]. It is a domal
                    In the trans-Himalayan part of Ladakh (NW India), the                                    structure and consists of both ortho- and paragneiss, locally
                Indus Suture Zone is present as a linear, Orogen-parallel                                    called Puga Gneiss, along with metabasic enclaves and dikes.
                zone formed at ~50-55 Ma [39–43] after consumption of                                        These enclaves and intrusions are garnet amphibolite to
                the Tethyan Oceanic plate during convergence between the                                     eclogite in nature. Metamorphic studies carried out by previ-
                Indian and Eurasian plates. The Tso Morari Crystalline                                       ous workers suggest the peak (HP) metamorphism of eclo-
                Complex (TMCC), lying to the west of the Indus Suture                                        gite facies in the TMCC at ≥2.8 GPa [51–56]. Detailed
                Zone (Figures 2(a) and 2(b)), is composed of rocks of the                                    petrochronological study [57] suggests that peak (HP) meta-
                Paleozoic north Indian continental margin. They were sub-                                    morphism of TMCC took place at ~47-43 Ma. Based on the
                ducted, underwent UHP metamorphism, and were subse-                                          P-T pseudosection modelling carried out by previous
                quently exhumed. Several previous studies of these units                                     workers on the metabasic enclaves of TMCC [51–56]
                were devoted to characterizing their metamorphism and                                        (Figure 3), it can be inferred that the high-pressure mineral
                discussing the mechanism of exhumation of the TMCC                                           omphacite was stable from ≥2.8 GPa to ~1.5 GPa within a
                [7, 44–48]. However, geometry, kinematics, and dynamics                                      temperature range of ~530°C to ~650°C defining the P-T
                of tectonic transport along the subduction channel that                                      path from peak (HP) to postpeak (HP) metamorphic stages.
                accommodated deep burial and exhumation received less                                        Quartz represents mostly the late garnet amphibolite and
                attention. Eclogite, specifically eclogitic lenses, are part of                               granulite facies of metamorphism at ≤1.5 GPa to ~0.5 GPa
                subduction channels, and they often exhumed in continen-                                     with temperature ranging from ~500°C up to 750°C during
                tal collision zones ([25] and references therein). Therefore,                                granulite metamorphism.
                understanding the deformation mechanism of omphacite                                             Various mechanisms have been postulated to explain the
                and eclogitic rocks as a whole is critical for gaining insight                               exhumation of the TMCC subsequent to ultrahigh-pressure

Downloaded from http://pubs.geoscienceworld.org/gsa/lithosphere/article-pdf/doi/10.2113/2022/7256746/5569363/7256746.pdf
by guest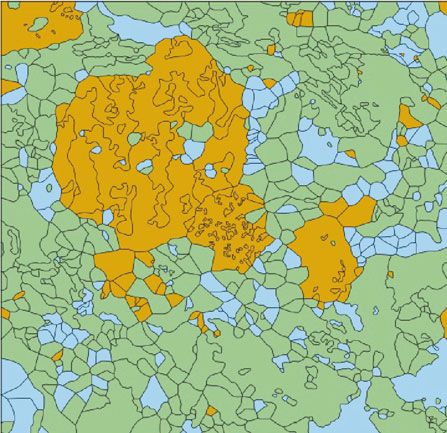
Lithosphere 3
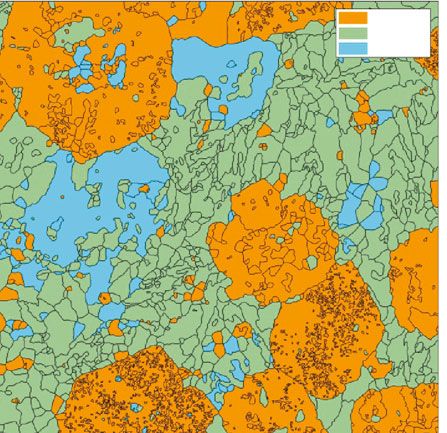
Figure 2: (a) Geological map of Himalaya and trans-Himalaya. Boxes present study area. (b) Geological map of the study area (after Epard
and Steck [46]) showing major geological units and sample locations. (c) Outcrop of sample 6Y location having retrograded eclogite
embedded within granitic gneiss. (d) Outcrop of sample 3XA near Sumdo. The outcrop showing granitic gneiss containing enclaves of
eclogite within it. (c) Outcrop showing location of sample 8XB near Kiager Tso Lake.
metamorphism such as propagation of the TMCC as a (Figure 4(c)) and shows evidence of dynamic recrystalliza-
nappe towards the foreland or the Indian plate [7]. It was tion (Figure 4(b)). Quartz grains are present as inclusions
also proposed that the TMCC moved upward along a low- in garnet and also occupy the interstitial spaces in the matrix.
viscosity channel and that the ascent was facilitated by ser- It may be noted that quartz shows evidence of dynamic recrys-
pentinite acting as lubricating material [45]. A tectonic tallization by bulging and subgrain rotation (Figure 4(g)).
model was also proposed in which the “extrusion” of the Actinolite and chlorite replace both omphacite and amphibole
TMCC was explained by a combination of pure and simple (Figure 4(h)) in highly retrogressed rocks (6Y).
shear [46]. This was supported by EBSD studies of quartz Depending on the degree of retrogression, the samples
in the Puga Gneiss [47, 48]. collected across the strike of the TMCC from eight locations
(Figure 2(b)) can be divided into three subtypes. Sample
3. Petrography 7XA belongs to type-1, which is the most pristine and rela-
tively unaltered type of eclogite consisting dominantly of
The studied metabasic rocks are variably retrogressed eclo- garnet (23.39% phase fraction), omphacite (21.44% phase
gites. They consist of garnet, omphacite, amphibole, white fraction), and amphibole with least amount of alteration
mica, epidote, quartz/coesite, plagioclase, biotite, and acces- and symplectites (Figure 5). Samples 3XA (13.23% and
sory phases like rutile, ilmenite, apatite, and zircon. Garnet 15.22% phase fraction of garnet and omphacite, respectively,
porphyroblasts either are inclusion free or contain inclusions with 5.39% of quartz), 8XB (11.63% and 9.26% phase frac-
of omphacite, epidote, amphibole, quartz, white mica, etc. tion of garnet and omphacite, respectively, with 9.67%
Garnets are often rimmed by thin amphibole rich layers. quartz), 1YA, 1YB, 8YA, and 8YB belong to type-2 eclogite
Clinopyroxenes belong to the omphacite group according to and are characterized by abundant symplectites and signif-
Quad-Na classification [58] (Figure 3(b)). Omphacite and icant amounts of garnet and omphacite (garnet varying
amphibole are present as inclusions in garnet and also as from 4.71% to 11.63% and omphacite from 3.98% to
individual grains in the matrix (Figures 4(a), 4(b), and 4(d)) 9.26% phase fractions) (Figure 5) with moderate replace-
and as symplectites. Omphacite margins are often amphiboli- ment of omphacite by amphibole. Sample 6Y is the most
tized, indicating partial retrogression (Figures 4(c), 4(e), and retrogressed sub type-3, and here, omphacite (4.05% phase
4(f)). Omphacite also occurs as inclusions in amphibole fraction) is almost completely retrogressed to actinolite
Downloaded from http://pubs.geoscienceworld.org/gsa/lithosphere/article-pdf/doi/10.2113/2022/7256746/5569363/7256746.pdf
by guest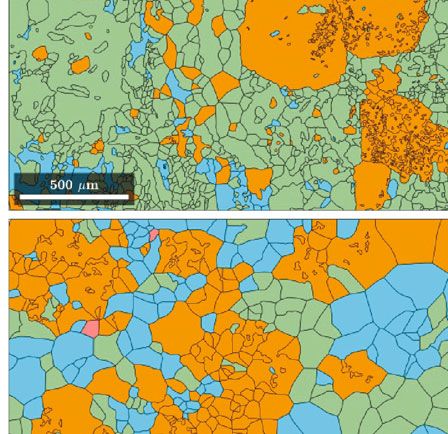
4                                                                                                                                              Lithosphere

                Figure 3: (a) A comparative diagram showing metamorphic P-T paths of Tso Morari eclogite obtained by various workers (compiled and
                modified after Pan et al. [56]). The P-T paths compared are of Wilke et al. (W) [54], Pan et al. (Pa) [56], Palin et al. (P) [87], Konrad-
                Schmolke et al. (K) [51], St. Onge et al. (St.) [52], de Sigoyer et al. (de) [44], Guillot et al. (G) [88], and Warren et al. (Wa) [89].
                Metamorphic facies boundaries are drawn after Gilotti [1] and Hacker et al. [2]. (b) Classification diagram of clinopyroxene. (a) Quad-
                Na classification according to Morimoto et al. [58] (Quad represents the Ca-Mg-Fe pyroxene area) from samples 3XA and 8XB.
                Abbreviations: AM: amphibolite; Amp-EC: amphibolite-eclogite; BS: blueschist; EA: epidote amphibolite; EC: eclogite; Ep-EC: epidote
                eclogite; GR: granulite; GS: green schist; HGR: high-pressure granulite; Law-EC: lawsonite eclogite.

                (33.79% phase fractions) and chlorite (8.18% phase frac-                                     nal sections of the rock, and the shape preferred orientation
                tions) (Figure 5) with almost negligible amount of garnet                                    of omphacite was observed for each section through optical
                (0.64% in phase fraction). Relic omphacite is present in                                     microscopy. The preferred orientation of omphacite in 2
                minor amounts among symplectites/break down products.                                        orthogonal planes helped trace the foliation, and a section
                Phase fractions of garnet, omphacite, quartz, actinolite,                                    along the foliation was cut. Finally, a section perpendicular
                and chlorite detected by HKL CHANNEL 5 are provided                                          to the inferred foliation plane (parallel to preferred orienta-
                in Supplementary Table. 1.                                                                   tion of omphacite observed in petrography on the foliation
                                                                                                             plane) was prepared for EBSD analyses. For preparing sam-
                4. Analytical Techniques                                                                     ples for EBSD analyses, Mamtani’s Fabric Analysis Lab
                                                                                                             (MFAL) protocol was adopted [59]. Accordingly, conven-
                As most of the eclogite samples have poorly developed                                        tional polishing of slides by colloidal silica gel is followed
                mesoscopic fabric (Figure 2), we have oriented the rock sur-                                 by broad ion beam polishing (BIBP). The latter was done
                faces geographically and marked the strike and dip of the                                    in two steps: cleaning of the slide for 5 minutes followed
                exposed surface of the samples before collecting them from                                   by polishing for 30 minutes using the Leica EM TIC 3X
                the outcrops. Thin sections were prepared from 2 orthogo-                                    triple broad ion beam milling system housed in the

Downloaded from http://pubs.geoscienceworld.org/gsa/lithosphere/article-pdf/doi/10.2113/2022/7256746/5569363/7256746.pdf
by guest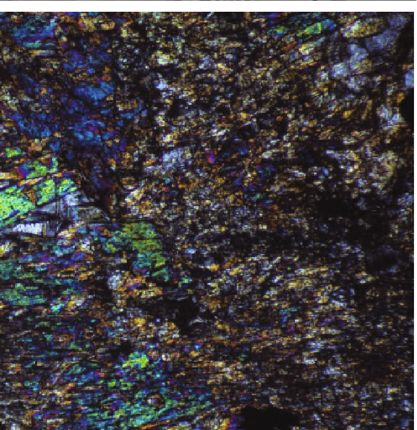
Lithosphere                                                                                                                           5

                Figure 4: Photomicrographs representing petrographic and microstructural features of the studied Tso Morari eclogite samples. (a) Sample
                7XA showing dominantly garnet omphacite assemblage with presence of some amphibole, rutile, and epidote. Garnet cores are rich in
                inclusions. (b) Omphacite showing evidence of dynamic recrystallization and alteration to amphibole (sample 7XA). (c) Relict omphacite
                presents as inclusions in amphibole (sample 7XA). (d) Sample 3XA showing preferred orientation of omphacite and amphibole
                inclusions in garnet with the presence of amphibole, white mica, and epidote in the matrix. (e) BSE image of sample 1YA showing
                symplectite containing omphacite, amphibole, white mica, and rutile near the grain boundary of garnet. (f) BSE image from sample 8XB
                showing symplectite colony and replacement of omphacite by amphibole. (g) Evidence of subgrain rotation and recrystallization in
                quartz grain present within an amphibole-rich matrix (8XB). (h) Sample 6Y showing evidence of intense retrogression by presence of
                actinolite and chlorite with very minor amounts of relict omphacite. Mineral abbreviations: gt: garnet, omph: omphacite, amph:
                amphibole, wm: white mica, ep: epidote, ru: rutile, act: actinolite, chl: chlorite, q: quartz, sg: subgrain.

Downloaded from http://pubs.geoscienceworld.org/gsa/lithosphere/article-pdf/doi/10.2113/2022/7256746/5569363/7256746.pdf
by guest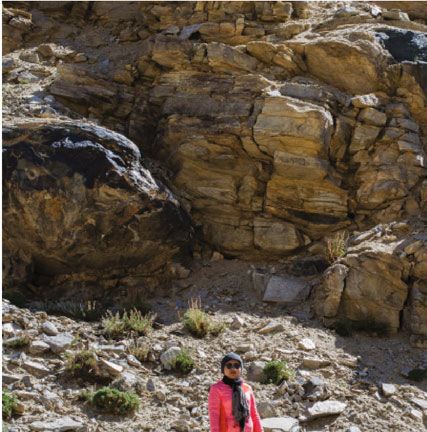
6                                                                                                                 Lithosphere

                                                                                                  Quartz                     Garnet
                                                                                                  Omphacite                  Omphacite
                                                                                                  Garnet                     Quartz

                                                                                                   Garnet                    Garnet
                                                                                                   Omphacite                 Omphacite
                                                                                                   Quartz                    Quartz
                                                                                                   IImenite                  IImenite

                                                                                                  Quartz                     Garnet
                                                                                                  Omphacite                  Omphacite
                                                                                                  Garnet                     Quartz

                                                                                                  Garnet                       Quartz
                                                                                                  Omphacite                    Omphacite
                                                                                                  Quartz                       Garnet
                                                                                                                               Actinolite
                                                                                                                               Chlorite

                                                                        Figure 5: Phase maps for all the analyzed samples.

Downloaded from http://pubs.geoscienceworld.org/gsa/lithosphere/article-pdf/doi/10.2113/2022/7256746/5569363/7256746.pdf
by guest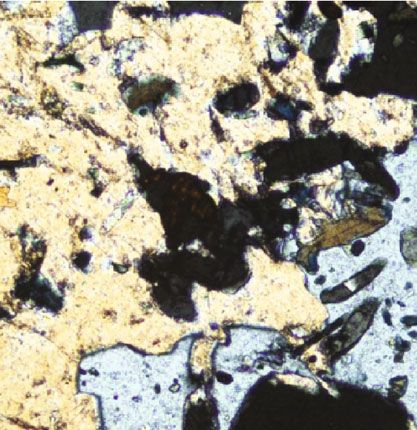
Lithosphere                                                                                                                                               7

                Department of Geology and Geophysics, Indian Institute of                                    Boundaries of the selected grains were also smoothed. These
                Technology (IIT) Kharagpur, India (see [59] for detailed                                     steps for grain segmentation were used for phase mapping,
                parameters of the MFAL protocol). After sample prepara-                                      grain orientation spread (GOS) mapping, and preparing his-
                tion, EBSD patterns were acquired at 30 kV accelerating                                      tograms for both grain size distribution (GSD) and angle of
                voltage, 1:49 × 10−6 mbar system vacuum, and ~15 mm                                          misorientation for omphacite grains. Since these samples
                working distance using the Carl Zeiss Auriga Compact                                         have weakly developed foliation and the XZ sections were
                FEG-SEM fitted with the NordlysMax2 EBSD detector                                             determined using petrographic observations alone, we also
                (Oxford instruments, UK) housed in Central Research Facil-                                   employed crystallographic vorticity analyses (CVA) [61,
                ity (IIT Kharagpur, India). Thin sections were placed in the                                 62]. CVA analyses utilize crystallographic orientation of
                SEM sample chamber and tilted to 70° before the EBSD                                         individual grains and apply rotation statistics to determine
                analyses. Data acquisition and indexing of EBSD patterns                                     their dispersion axes. The objective is to determine the vor-
                were carried out automatically using the AZtec software                                      ticity normal surface (VNS), which is the most reliable plane
                (Oxford Instruments, UK). Step size in the range of 2-6 μm                                   to study shear kinematics (Figure 6; [61]). CVA analyses are
                was taken for EBSD mapping, which is at least one-third                                      advantageous in terms of providing objective quantitative
                in size than the smallest of grains. 2 μm was used only for                                  determination of the vorticity vector orientation. Moreover,
                some individual omphacite grain for intragrain misorienta-                                   it does not depend on the relationship between vorticity
                tion analysis along a line profile.                                                           and fabric elements like lineation and foliation [61, 62].
                     Additional backscattered electron (BSE) images were                                     All the pole figures for lattice preferred orientations
                obtained by the Scanning Electron Microscope Zeiss EVO                                       (LPO) for both omphacite and garnet were determined
                40 US at the Wadia Institute of Himalayan Geology, Dehra-                                    after CVA analyses and on the VNS where the Z axes of
                dun. To withstand the vacuum conditions and high-energy                                      the stereoplot correspond to the bulk vorticity axes
                beam of electrons, the polished thin section was mounted                                     (Figure 6), along which the rotation related to simple
                rigidly to an aluminum stub using a conductive cohesive                                      shear occurs [62]. For CVA analyses, only grains with a
                then it was gold coated up to 10-30 A0.                                                      GOS > 1° were selected. Additionally a ratio of 1 : 4 for
                     The electron probe micro analyzer (EPMA) CAMECA                                         magnitude of principal and secondary axes of each grain
                SX-Five instrument was used to obtain the mineral chemis-                                    scale dispersion was kept as a threshold to ignore analyses
                try data at the DST-SERB National Facility, Department of                                    points with insignificant dispersion of lattice (https://
                Geology (Center of Advanced Study), Institute of Science,                                    github.com/zmichels/CVA). Indexed points, thus filtered,
                Banaras Hindu University. Polished thin sections were                                        were used for pole figure analyses including low-angle
                coated with a 20 nm-thin layer of carbon for the analyses                                    (2°-10°) inner and outer “neighbour-to-neighbour” grain
                using the LEICA-EMACE200 instrument. The CAMECA                                              boundary misorientation analyses. LPOs of quartz were
                SX-Five instrument was operated by the SX-Five Software                                      plotted with a halfwidth of 15°, and halfwidth of 10° was
                at a voltage of 15 kV and current 10 nA with a LaB6 source                                   used for all the other minerals.
                in the electron gun for generation of electron beam. Natural                                      LPOs of the minerals (omphacite, garnet, quartz, and
                silicate mineral andradite was used as internal standard to                                  also actinolite and chlorite for retrograded metabasic sam-
                verify positions of crystals (SP1-TAP, SP2-LiF, SP3-LPET,                                    ples) are shown in the lower-hemisphere equal area projec-
                SP4-LTAP, and SP5-PET) with respect to corresponding                                         tions. Pole figures were plotted using one point per grain
                wavelength dispersive (WD) spectrometers (SP#) in the                                        to avoid oversampling bias of large grains. Eigenvalue anal-
                CAMECA SX-Five instrument. The following X-ray lines                                         yses [63, 64] were used to quantify the orientation distribu-
                were used in the analyses: F-Kα, Na-Kα, Mg-Kα, Al-Kα,                                        tion data in terms of point maxima or clustering and girdle
                Si-Kα, P-Kα, Cl-Kα, K-Kα, Ca-Kα, V-Kα, Ti-Kα, Cr-Kα,                                         distribution. To quantify and characterize symmetry of ori-
                Mn-Kα, Fe-Kα, and Ni-Kα. Natural mineral standards fluo-                                      entation of omphacite, the LS index was used [38]. The
                rite, halite, apatite, periclase, corundum, wollastonite, ortho-                             index is based on the eigenvalues (λ1 > λ2 > λ3 ) of the orien-
                clase, rutile, chromite, rhodonite, hematite, and pure metals                                tation tensor calculated from the individual vectors of the
                V and Ni were used for routine calibration and X-ray ele-                                    directions (010) and [001] axes in sample coordinates. The
                mental mapping and quantification. Routine calibration,                                       value of the LS index varies from 0 for end-member S-type
                acquisition, quantification, and data processing were carried                                 to a value of 1 for the end-member L-type.
                out using SxSAB version 6.1 and the SX-Results software of
                CAMECA. Calibration for analyses was done by using a
                                                                                                                              1        P010           G001
                number of natural and synthetic standards. Precision of                                        LS − index =      2−              −                , ð1Þ
                                                                                                                              2     G010 + P010    G001 + P001
                analyses for major oxides is less than 1%. EPMA data are
                provided in Supp. Table. 4.
                     Plots of lattice preferred orientation (LPO) were calcu-                                where P = ðλ1 – λ2 Þ is the point maximum parameter and
                lated using the MTEX 5.7.0, an open source MATLAB tool-                                      G = 2ðλ2 – λ3 Þ represents the girdle distribution. For charac-
                box for quantitative texture analyses, available at http://                                  terizing orientation distribution of quartz c-axes, the cylin-
                mtex-toolbox.github.io [60]. MTEX was also used for eigen-                                   dricity index (B) is used [65]. This value ranges between 0
                value analyses. For grain segmentation, a 5° threshold angle                                 for completely random fabric and 1 representing a
                was used, and only grains bigger than 5 μm in size and hav-                                  completely nonrandom fabric. B represents the sum of the
                ing more than three orientation solutions were selected.                                     point (P) and girdle (G) end-member fabric components.

Downloaded from http://pubs.geoscienceworld.org/gsa/lithosphere/article-pdf/doi/10.2113/2022/7256746/5569363/7256746.pdf
by guest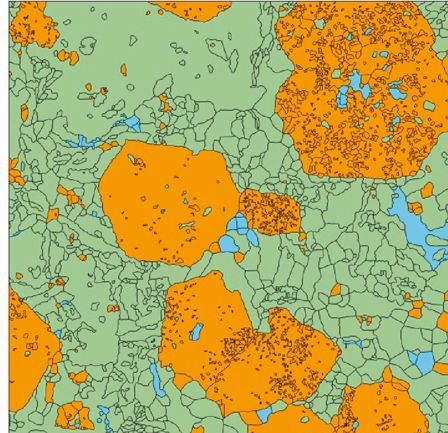
8                                                                                                                                Lithosphere

                Figure 6: (a) Diagram showing the kinematic reference frame of the sample after computing rotation in terms of crystallographic vorticity
                axes (CVA) (taken from Michels et al. [61]). (b–i) Vorticity normal section (VNS) and bulk vorticity axis for all the eight samples. x-axes are
                parallel to lineation (E-W), and Z/CVA is perpendicular to foliation.

Downloaded from http://pubs.geoscienceworld.org/gsa/lithosphere/article-pdf/doi/10.2113/2022/7256746/5569363/7256746.pdf
by guest
Lithosphere                                                                                                                                               9

                Fabric strength of the indexed phases was calculated using                                   analyses helps identify the slip systems that are active during
                the M index [66]. The M index is defined as:                                                  deformation (see [25, 35] and references therein for detailed
                                                                                                             descriptions of identifying slip systems from grain boundary
                                                 ð
                                               1                                                             misorientation analyses), and in some cases, especially for
                                        M=         IRT ðθÞ − R0 ðθÞ∣dθ,                           ð2Þ        quartz, the identified slip systems can also provide an assess-
                                               2
                                                                                                             ment of the temperature of deformation [67]. LPOs of
                                                                                                             sample 3XA show girdle distribution of (010) poles perpen-
                where RT ðθÞ is the theoretical distribution of misorientation
                                                                                                             dicular to the foliation (Z) with a maximum MUD (multi-
                angle for a random fabric and R0 ðθÞ is the distribution for                                 ples of uniform distribution) of 6.6. The [001] axes are
                observed misorientation angles.                                                              oriented parallel to the lineation (X) with a maximum
                    Low-angle boundary (2°-10°) misorientation analyses for                                  MUD of 7.1. Misorientation analyses of low-angle grain
                both inner (subgrain boundaries) and outer grain bound-                                      boundaries of 3XA shows maximum concentration near
                aries were carried out for all the eight samples and are plot-                               [010] and (110) that indicates slip/edge dislocation along
                ted following the principles and methodologies described by                                  [001](100) tilt boundaries. The LS index of 0.46 indicates a
                [35], and the slip systems were inferred from [24–26]. For                                   planolinear fabric. Sample 7XA shows strong girdle distribu-
                misorientation analyses of low-angle grain boundaries of                                     tion of (010) polls perpendicular to the foliation. The [001]
                quartz, the plotting convention of [67] was followed.                                        axes show strong LPOs parallel to the lineation (X) with a
                    Intracrystalline deformation for few individual ompha-                                   maximum MUD of 8.3. Low-angle boundary misorientation
                cite grains was also identified. The grain having maximum                                     plot shows maximum concentration at [010] that indicates
                GOS was selected from each of the samples. The image of                                      slip/edge dislocation along [001](100) tilt boundaries. The
                the grains was smoothened, and points with missing index                                     LS index of 0.82 indicates a strongly linear/constrictional
                were filled using a half quadratic filter (https://mtex-                                       fabric. Samples 1YA and 1YB both show a distribution of
                toolbox.github.io/HomepageOld/files/doc/EBSDsmoothing                                         [001] parallel to the lineation and that of (010) poles perpen-
                .html). A line profile across the grains was made to obtain a                                 dicular to the foliation plane. Low-angle boundary misorien-
                misorientation angle gradient along the profile and also the                                  tation plot for 1YA shows concentrations near both [001]
                distribution for axes of misorientation for low-angle (2°-                                   and [010] suggesting [100](010) and [001](100) slips,
                10°) inner grain boundaries.                                                                 respectively. Low-angle boundary misorientation plot for
                    Phase fractions (in percentage) of all the indexed phases                                1YB shows maximum concentration near [001] that indi-
                are provided in Supp. Table. 1. The P, G, and R values of                                    cates slip/edge dislocation along [100](010). Sample 1YA
                omphacite and quartz for all the samples are given in Supp.                                  has an LS index of 0.51 that indicates a planolinear fabric.
                Table. 2 and Supp. Table. 3, respectively. Supp. Table. 4 con-                               On the other hand, 1YB has an LS index of 0.29 indicating
                tains the mineral chemistry data (EPMA) of clinopyroxene/                                    a planar fabric. Sample 8XB shows a very weak girdle distri-
                omphacite for samples 3XA and 8XB.                                                           bution of [001] axes parallel to lineation and a strong con-
                                                                                                             centration of (010) poles perpendicular to the foliation
                5. EBSD Analyses                                                                             plane with a maximum MUD of 5.6. Axes of misorientation
                5.1. Grain Orientation Spread and Grain Size Distribution. A                                 for low-angle grain boundaries for 8XB are concentrated at
                grain map of omphacite colored by orientation spread of                                      [001] as well as at [010] suggesting [100](010) and
                each grain (GOS) is presented for each eclogite sample                                       [001](100) slips, respectively. LPO is further characterized
                (Figure 7). The map represents the angular spread of orien-                                  by an LS index of 0.55 suggesting a planolinear fabric. Both
                tation for each grain. This intragranular curvature is dictated                              8YA and 8YB show a strong concentration of (010) poles
                by the presence of internal lattice curvature of a grain.                                    perpendicular to foliation with respective maximum MUD
                Therefore, a map showing higher GOS of a particular phase                                    of 6.2 and 4.4. They both have comparatively weaker distri-
                will indicate higher intragranular distortion. GOS for the                                   bution of [001] axes parallel to lineation. Both these samples
                Tso Morari eclogite samples show a variation of maximum                                      have concentration of low-angle grain boundary misorienta-
                GOS from ≥3 (sample 6Y) to ≥7 (sample 7XA). Histograms                                       tion axes at [001] suggesting [100](010) slip. The LS index of
                for grain size distribution and misorientation angles for                                    these samples are 0.53 (8YA) and 0.47 (8YB) indicating an
                omphacite grains are also presented (Figure 7) to provide a                                  LS pattern. Sample 6Y has much less number of point anal-
                visual representation of variation in the grain size of ompha-                               yses and shows the concentration of (010) poles perpendic-
                cite for different samples and also the angular deviation for                                 ular to foliation and that of [001] axes parallel to lineation.
                each omphacite grain from the mean orientation on the                                        6Y also has concentration of low-angle grain boundary mis-
                grain.                                                                                       orientation axes at [001] suggesting [100](010) slip.
                                                                                                                 In general, our LPO data indicate that the retrogressed
                5.2. LPOs and Low-Angle Grain Boundary Misorientation                                        samples have weak LPO patterns and that there is a transi-
                Analyses of Omphacite. Figure 8 shows the stereoplots (lower                                 tion from L-type to LS-type fabrics from pristine to more
                hemisphere) of LPOs for omphacite, and Figure 9 shows the                                    retrograded eclogite samples. This weakening of LPO can
                inverse pole figures for misorientation analyses of low-angle                                 be attributed to retrogression, omphacite breakdown, and
                (2°-10°) inner and outer “neighbour-to-neighbour” grain                                      its replacement by amphibole, symplectite formation, and
                boundaries in crystallographic reference frame. This                                         late-stage fluid infiltration. Low-angle grain boundary mis-
                “neighbour-to-neighbour” grain boundary misorientation                                       orientation analyses (Figure 9) overall show a transition

Downloaded from http://pubs.geoscienceworld.org/gsa/lithosphere/article-pdf/doi/10.2113/2022/7256746/5569363/7256746.pdf
by guest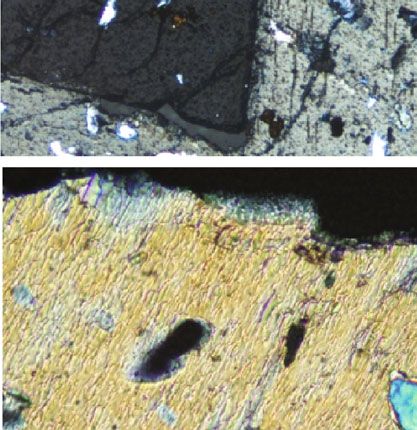
10                                                                                                                   Lithosphere

                Figure 7: Grain orientation spread (GOS) map of omphacite for all the samples along with histograms of grain size distribution and
                misorientation angle for omphacite. Magenta-colored lines in the GOS map represent the subgrain boundaries in omphacite.

Downloaded from http://pubs.geoscienceworld.org/gsa/lithosphere/article-pdf/doi/10.2113/2022/7256746/5569363/7256746.pdf
by guest
Lithosphere 11
Figure 8: (a–h) Omphacite, (i), actinolite, and (j) chlorite LPOs of all the samples shown in lower-hemisphere equal area projections
(halfwidth = 10° ). x-axes are parallel to lineation (E-W), and Z/CVA is perpendicular to foliation. Contours are shown in multiples of
uniform distribution (MUD). n: number of grains.
Downloaded from http://pubs.geoscienceworld.org/gsa/lithosphere/article-pdf/doi/10.2113/2022/7256746/5569363/7256746.pdf
by guest12 Lithosphere
1.8
3
1.8
3 2.5
1.6
1.6
2.5
2.5
2 1.4
1.4
2
2 1.2
1.2
M.U.D.
M.U.D.
M.U.D.
M.U.D.
M.U.D.
1.5
1 1
1.5 1.5
0.8
1 0.8
1
1
0.6
0.6
0.5
0.5 0.4
0.5
0.4
2.2 4.5
3.5
2.5
2 4 2.5
3
1.8 3.5
2
2.5
1.6 3 2
1.4
2.5 2
M.U.D.
M.U.D.
M.U.D.
M.U.D.
1.5
M.U.D.
1.2 1.5
2
1.5
1
1 1.5
1 1
0.8
1
0.6
0.5 0.5
0.5
0.5
0.4
0
Figure 9: Inverse pole figures showing low-angle (2°-10°) “neighbour-to-neighbour” inner and outer grain boundary misorientation
analyses for (a–h) omphacite, (i) actinolite, and (j) chlorite.
from [001](100) to [100](010) slip from most pristine to ever, the patterns obtained for all the poles and planes are
most retrograded eclogite samples. The fabric strength very random with numerous point maxima. Due to this ran-
defined by the M index for omphacite is strong for 7XA dom distribution, no crystallographic inferences could be
(0.12) but overall is weak for other samples (0.022-0.055). made, and implications, if any, of garnet LPOs are not dis-
In type-1 and most of the type-2 samples, the presence of cussed any further. Garnet LPOs are shown in Supplemen-
recrystallized grains and subgrains of omphacite (Figures 4, tary Figure 1.
5, and 7) suggests deformation by dislocation creep [23, 26,
68–76]; also see review by [25]). On the other hand, weak 5.5. LPOs of Quartz. LPOs of quartz for both a-axes (1120)
CPO and comparatively low GOS (Figure 7) in the most ret- and c-axes (0001) are shown in Figure 10 along with the B
rogressed samples (8YB and 6Y) may suggest that in these index (see also Supp. Table 3) and inverse pole figures for
eclogites, omphacite may have accommodated strain by low-angle inner and outer “neighbour-to-neighbour” grain
dominantly grain size sensitive (GSS) creep processes such boundaries in the crystallographic reference frame. 3XA
as diffusion creep [33]. It may be noted that diffusion creep shows a weak girdle distribution of a-axes at a high angle
in omphacite has been suggested to play a major role in low- to the foliation plane and distribution of c-axes nearly
temperature conditions [23]. perpendicular to the foliation plane with a maximum
MUD of 3.8. The B index of 0.28 indicates very low
5.3. LPOs of Actinolite and Chlorite. These two minerals are eccentricity of the c-axes. Low-angle grain boundary
low-grade alteration products of preexisting omphacite and/ misorientation analyses suggest the dominance of a rare
or amphibole and are observed and indexed for only sample rhomb slip. 7XA shows strong LPOs of c-axes
6Y. Actinolite shows strong concentration of [001] axes perpendicular to the foliation plane with a maximum
along the Z plane, perpendicular to the foliation plane hav- MUD of 11 and girdle distribution of a-axes. A B index of
ing a maximum MUD of 10. In chlorite, the [001] axes show 0.77 indicates a highly eccentric c-axis distribution. Grain
polar distribution along the lineation with a maximum boundary misorientation analyses indicate a basal slip
MUD of 12, and the (010) poles are perpendicular to the along low-angle inner and outer grain boundaries. Both
foliation plane (Figure 8). Low-angle grain boundary misori- 8XB and 8YB have strong LPOs of c-axes parallel to the
entation analyses of actinolite suggest a slip along [100](010) lineation with maximum MUD of 3 and 5.8, respectively.
boundaries while that of chlorite indicates dominance of the This pattern of c-axes LPO for both these samples, along
[001](100) slip system (Figure 9). with grain boundary misorientation plot, indicates high-
temperature prism slip. A B index of 0.52 and 0.58 also
5.4. LPOs of Garnet. Garnet LPOs were prepared for poles to suggest a strong LPO of c-axes. 8YA and 1YA on the other
(100) and (110) and the [111] crystallographic planes for all hand show polar and girdle distribution of c-axes,
the samples except 6Y; the latter has almost no garnet. How- respectively, with a maximum MUD of 7.1 and 2.2,
Downloaded from http://pubs.geoscienceworld.org/gsa/lithosphere/article-pdf/doi/10.2113/2022/7256746/5569363/7256746.pdf
by guestLithosphere 13
Figure 10: Quartz LPOs are shown in lower-hemisphere equal area projections (halfwidth = 15° ) (x-axes are parallel to lineation (E-W), and
Z/CVA is perpendicular to foliation) along with inverse pole figures for low-angle (2°-10°) inner and outer grain boundary misorientation
analyses. Cartoon plotting conventions and slip systems of quartz are also shown following Neumann [67]. n: number of grains.
Downloaded from http://pubs.geoscienceworld.org/gsa/lithosphere/article-pdf/doi/10.2113/2022/7256746/5569363/7256746.pdf
by guest14 Lithosphere
respectively. Grain boundary misorientation analyses of both ing the postpeak (HP) decompression stage. A similar kind
these samples suggest the most common prism slip. 1YB of transition has been observed by various workers in
also shows LPOs of c-axes with a maximum MUD of 2.4, omphacite from eclogite in different tectonic settings around
and its low-angle grain boundary misorientation analyses the world [29, 35, 36, 80]. Detailed LPO analyses of ompha-
suggest both basal and prism slips. The M index is cite from different eclogite-bearing nappes of Alps [80] show
moderate to weak for most of the samples (0.01 to 0.05), that an L-type fabric in omphacite is formed in the constric-
apart from strong fabric strength for 3XA (M index = 0:10) tional field during the high-pressure metamorphism and
and 7XA (M index = 0:16). subsequent retrogression stage. On the other hand, S-type
LPOs of omphacite were observed in a prograde path owing
5.6. Intragranular Misorientation Analyses of Omphacite. To to the initial burial/subduction. LPOs and shape preferred
understand intragranular deformation and misorientation in orientation analyses of omphacite carried out on eclogitic
omphacite, misorientation line profiles for the grain with the rocks from the Tauern Window of Eastern Alps [29] suggest
maximum orientation spread are shown from 5 representa- flattening the strain during prograde evolution that changed
tive samples (Figure 11). Line segments were drawn across to constrictional strain regime during peak (HP) metamor-
domains of different angular orientations across the grain, phic and exhumation stages. EBSD analyses on omphacite-
and a profile for angular discordance with mean orientation bearing eclogite of the Sanbagawa metamorphic belt of
and a misorientation gradient were obtained (Figure 11). Japan [35] reveal a strong L-type fabric in omphacite with
The angular misorientation profile ranges from 8° to 10° a very high LS index and transitional LS-type fabric with a
with an abrupt change in the orientation gradient, possibly moderate LS index for retrograded/altered eclogites. Study
related to intracrystalline deformation, can be inferred in on eclogitic rocks of Malpica-Tui Allocthonous Complex
samples 1YA, 8XB, and 6Y. of Spain [36] also has shown two types of LPOs in ompha-
cite owing to noncoaxial constrictional strain and noncoax-
6. Discussion ial flattening strain.
By comparing our results with those discussed above, a
6.1. Variation in Strain Regime Inferred from EBSD Patterns. conclusion can be drawn that a constrictional strain regime
The Tso Morari Crystalline Complex, especially its metaba- prevailed during peak (HP) metamorphism and subsequent
sic patches, bears signatures of a complex metamorphic his- exhumation of the TMCC along a subduction channel. Inte-
tory with imprints of continental subduction, accretion/ grated metamorphic modelling and U-Pb geochronology of
collisional thickening, and rapid exhumation stages zircon [77] suggest subduction of the TMCC along a steep
(Figure 12). Detailed petrochronological study [52] suggests to almost vertical channel into the mantle that was followed
~2.1 GPa pressure and ~535°C temperature for prograde by extrusion that coincided with oceanic slab break-off (also
metamorphism at 58 Ma, followed by peak (HP) metamor- see [44, 81]). Constrictional L-type fabric in omphacite can
phism at 51 Ma in the P-T range of 2.5-2.7 GPa and 630- develop due to buoyancy driven extrusion of continental
645°C and finally retrogression at ~45 Ma (7-8 kbar and material between two lithospheric plates [29]. Therefore,
700-750°C). The prograde and peak (HP) metamorphic the constrictional strain regime during peak (HP) metamor-
stages of the TMCC are also characterized by rapid exhuma- phism and subsequent rapid exhumation of the TMCC can
tion [44, 57, 77] in the order of 3 mm/year [46] to as high as be explained by fast near-vertical subduction followed by
10 mm/year [78]. Plastic deformation and rheology of the slab break-off and extrusion of continental material along a
eclogites at the base of the continent or subducting slab or narrow path, squeezed out between two lithospheric plates
in the mantle, at a pressure > 1:5 GPa, are most likely to be (Figure 12). Transition of this constrictional strain regime
accommodated in omphacite [23, 24, 79]. It is therefore to plane strain regime, as shown by retrograded type-2 and
argued that the strain regime or deformation geometry/ type-3 eclogites, can be explained by a gradual decrease in
nature during peak (HP) metamorphism and postpeak the steepness of the channel angle at a shallower depth and
(HP) isothermal decompression/rapid exhumation stages layer parallel transport of the TMCC (Figure 12). This stage
of the TMCC can be best identified in the omphacite grains is similar to the “transport parallel lengthening” [47]. Our
of the eclogite lenses. LPOs of omphacite from eight eclogite study also shows a transition in activation of dominant slip
samples of the TMCC in the present study show that the systems in omphacite during the exhumation history of the
type-1 or the least altered omphacite-bearing sample 7XA TMCC. Grain boundary misorientation analyses show a
shows a strong L-type fabric (Figure 8) with an LS index of change from [001](100) to [100](010) slip systems in
0.82. Therefore, it can be inferred that the peak (HP) meta- omphacite from peak (HP) to postpeak (HP) metamorphic
morphic stage or stage of deepest continental subduction of stage (type-1) to subsequent exhumation, retrogression,
the TMCC is characterized by constrictional strain. On the and alteration stage (type-2 and type-3).
other hand, type-2 (partly altered) eclogites have varying EBSD analyses for LPOs of quartz have been done on the
degree of alteration of omphacite, and type-3 (almost Puga Gneiss, host of the TMCC metabasic rocks, in the
completely retrogressed) eclogites are characterized by a recent past [47, 48]. A prolonged top-to-the-east shearing
transitional type of LPOs (Figure 8) with an LS index vary- was inferred to be responsible for exhumation of the TMCC
ing between 0.29 and 0.55. In brief, the omphacite LPOs to shallow crustal depths till 30 Ma [47]. It may be noted that
indicate transition from constrictional strain regime at peak the Puga Gneiss is essentially a quartzofeldspathic gneiss
(HP) metamorphic conditions to a plane strain regime dur- devoid of any high-pressure mineral assemblage, and its
Downloaded from http://pubs.geoscienceworld.org/gsa/lithosphere/article-pdf/doi/10.2113/2022/7256746/5569363/7256746.pdf
by guestLithosphere 15
b 12
10
misorientation angle in degree
8
6
4
a
2
b
a 0
(3XA)
550 600 650 700 750 800 850 900
b y
10
9
8
misorientation angle in degree
7
6
5
4
3 a
2
1
b
(1YA) 0
a
1200 1250 1300 1350 1400 1450 1500 1550
y
10
9
b 8
misorientation angle in degree
7
6
5
4
3
2
1
(8XB) a b
a 0
320 330 340 350 360 370 380 390 400 410
y
b 9 a
8
7
misorientation angle in degree
6
5
4
3
a 2
1 b
(8YB)
0
365 370 375 380
y
9
b
8
7
misorientation angle in degree
6
5
4
a
3
b
2
(6Y) 1 a
0
1900 1950 2000 2050 2100 2150 2200 2250
y
To reference orientation
Orientation gradient
Figure 11: Intragranular misorientation analyses for single-omphacite grains from representative samples showing a misorientation line
profile along a line segment. Grain with maximum orientation spread is selected from each sample.
Downloaded from http://pubs.geoscienceworld.org/gsa/lithosphere/article-pdf/doi/10.2113/2022/7256746/5569363/7256746.pdf
by guest16 Lithosphere
50
45
W
Peak to post peak metamorphism
(Pressure: 25.5-27.5 kbar Type-1 omphacite with L-type
40 Temperature: 630-645 °C LPO
Age- 58.0 ± 2.2 Ma )
Continental subduction, slab
nd break off and buoyancy driven
mo e
Diaraphit extrusion along a vertical channel.
35 G
km Dry-EC
C/
5°
30
Lws-EC Coe
Pressure (Kbar)
Qtz Isothermal decompression during
exhumation characterized by Type-2 and Type-3 omphacite
Ep-EC omphacite breakdown, having L-S type LPO and
25 weakening of the LPO with
symplectite formation, fluid
infiltration increase in alteration of omphacite
(Pressure: 27-12 kbar
Amp-EC Temperature: 660-680°C
20 Age: 50.8 ± 1.4 ma
BS
15
High temperature
HGR metamorphism related Prism slip in quartz
St.
to collisional thickening
(Pressure: 12.5 ± 0.5 kba
10 Temperature: 690 ± 25°C
EA Age: 45-48 Ma)
Retrogression down to slip in quartz
5 greenschist
GR (Pressure: 7-8.4 kbar
AM
Temperature:Lithosphere 17
omphacite to amphibole and symplectite formation suggest Supplementary 3. Table showing the P, G, and R values for
that fluid infiltration played a major role in omphacite quartz.
breakdown and the overall exhumation of the TMCC. Past Supplementary 4. Table showing the EPMA data of clinopyr-
studies also suggest the infiltration of fluid from the adjacent oxene from samples 3XA and 8XB.
Nidar Ophiolite and Zildat Ophiolitic Mélange within the
TMCC at various stages of its exhumation [84–86]. We con- Supplementary 5. Garnet LPOs shown in lower-hemisphere
clude that fluid infiltration, symplectite formation, and equal area projections (halfwidth =10°). Orientations and
breaking down of omphacite during isothermal decompres- contours similar to that of Figure 7. n: number of grains.
sion/exhumation played a major role in weakening of LPO
in the retrogressed eclogite of TMCC. References
[1] J. A. Gilotti, “The realm of ultrahigh-pressure metamor-
7. Conclusion phism,” Elements, vol. 9, no. 4, pp. 255–260, 2013.
Based on this study, the following conclusions can be made: [2] B. R. Hacker, T. V. Gerya, and J. A. Gilotti, “Formation and
exhumation of ultrahigh-pressure terranes,” Elements, vol. 9,
(i) The peak (HP) metamorphism/deepest continental no. 4, pp. 289–293, 2013.
subduction and subsequent rapid exhumation of [3] F. Von Blanckenburg and J. H. Davies, “Slab breakoff: a model
the TMCC took place in a constrictional regime for syncollisional magmatism and tectonics in the Alps,” Tec-
tonics, vol. 14, no. 1, pp. 120–131, 1995.
(ii) Subsequent exhumation at shallower depths was [4] C. Ruppel, L. Royden, and K. V. Hodges, “Thermal modeling
more within a plane strain regime of extensional tectonics: application to pressure-temperature-
time histories of metamorphic rocks,” Tectonics, vol. 7, no. 5,
(iii) Breakdown, recrystallization, and symplectite for- pp. 947–957, 1988.
mation in omphacite appear to be a significant fac- [5] L. Jolivet, B. Goffé, P. Monié, C. Truffert-Luxey, M. Patriat, and
tor effecting the rapid exhumation of the TMCC M. Bonneau, “Miocene detachment in Crete and exhumation
P-T-t paths of high-pressure metamorphic rocks,” Tectonics,
Data Availability vol. 15, no. 6, pp. 1129–1153, 1996.
[6] J. F. Dewey, P. D. Ryan, and T. B. Andersen, “Orogenic uplift
All the data are provided either with the manuscript or as and collapse, crustal thickness, fabrics and metamorphic phase
supplementary tables. changes: the role of eclogites,” Geological Society, London, Spe-
cial Publications, vol. 76, no. 1, pp. 325–343, 1993.
Conflicts of Interest [7] A. Steck, J. L. Epard, J. C. Vannay et al., “Geological transect
across the Tso Moarari and Spiti areas: the nappe structures
The authors declare that they have no conflicts of interest. of the Tethys Himalaya,” Eclogae Geologicae Helvetiae,
vol. 91, pp. 103–121, 1998.
Acknowledgments [8] A. I. Chemenda, M. Mattauer, and A. N. Bokun, “Continental
subduction and a mechanism for exhumation of high-pressure
Director of WIHG is thanked for encouragement and metamorphic rocks: new modelling and field data from
support. We gratefully acknowledge the research grant pro- Oman,” Earth and Planetary Science Letters, vol. 143, no. 1-4,
vided by the Ministry of Earth Sciences, Govt. of India pp. 173–182, 1996.
(MoES/P.O./Geo/96/2017) for this study. Niloy Bhowmik [9] J. P. Platt, “Exhumation of high-pressure rocks: a review of
is thanked for carrying out the EBSD analyses in IIT Kharag- concepts and processes,” Terra Nova, vol. 5, no. 2, pp. 119–
pur (India). Zach Michels is thanked for his suggestions 133, 1993.
regarding MTex. N. V. Chalapathi Rao Banaras Hindu Uni- [10] P. Allemand and J. M. Lardeaux, “Strain partitioning and
versity (India) is thanked for carrying out the electron metamorphism in a deformable orogenic wedge: application
microprobe analyses. Shubham Choudhary is thanked for to the Alpine belt,” Tectonophysics, vol. 280, no. 1-2,
his help during fieldwork. C. P. Dorje provided logistic support pp. 157–169, 1997.
for fieldwork in Ladakh. Thorough and constructive reviews [11] M. Cloos, “Flow melanges: numerical modeling and geologic
made by four anonymous reviewers are gratefully acknowl- constraints on their origin in the Franciscan subduction com-
edged. MAM acknowledges the Ministry of Earth Sciences plex, California,” Geological Society of American Bulletin,
(India) for providing funds to establish the Broad Ion Beam vol. 93, no. 4, pp. 330–345, 1982.
Polishing facility in IIT Kharagpur (India) for EBSD sample [12] M. Cloos and R. L. Shreve, “Subduction-channel model of
preparation through project MoES/P.O.(Geo)/169/2017. prism accretion, melange formation, sediment subduction,
and subduction erosion at convergent plate margins: 2. Impli-
cations and discussion,” Pure and Applied Geophysics, vol. 128,
Supplementary Materials no. 3-4, pp. 501–545, 1988.
Supplementary 1. Phase fractions of indexed minerals for all [13] S. Guillot, S. Schwartz, B. Reynard, P. Agard, and C. Prigent,
“Tectonic significance of serpentinites,” Tectonophysics,
the studied samples.
vol. 646, pp. 1–19, 2015.
Supplementary 2. Table showing the P, G, and R values for [14] B. Ábalos, P. Puelles, and J. I. Gil Ibarguchi, “Structural assem-
omphacite. blage of high-pressure mantle and crustal rocks in a
Downloaded from http://pubs.geoscienceworld.org/gsa/lithosphere/article-pdf/doi/10.2113/2022/7256746/5569363/7256746.pdf
by guest18 Lithosphere
subduction channel (Cabo Ortegal, NW Spain),” Tectonics, sive to foliated eclogites during exhumation of subducted
vol. 22, no. 2, pp. 1.1–1.21, 2003. ocean crust in the North Qilian suture zone, NW China,” Jour-
[15] P. Agard, M. P. Searle, G. I. Alsop, and B. Dubacq, “Crustal nal of Metamorphic Geology, vol. 29, no. 7, pp. 699–720, 2011.
stacking and expulsion tectonics during continental subduc- [31] Y. Cao, H. Jung, and S. G. Song, “Petro-fabrics and seismic
tion: P-T deformation constraints from Oman,” Tectonics, properties of blueschist and eclogite in the North Qilian suture
vol. 29, no. 5, pp. 1–19, 2010. zone, NW China: Implications for the low-velocity upper layer
[16] R. Keppler, M. Stipp, J. H. Behrmann, K. Ullemeyer, and in subducting slab, trench-parallel seismic anisotropy, and
F. Heidelbach, “Deformation inside a paleosubduction chan- eclogite detectability in the subduction zone,” Journal of Geo-
nel - insights from microstructures and crystallographic pre- physical Research: Solid Earth, vol. 118, no. 6, pp. 3037–3058,
ferred orientations of eclogites and metasediments from the 2013.
Tauern Window, Austria,” Journal of Structural Geology, [32] Y. Cao and H. Jung, “Seismic properties of subducting oceanic
vol. 82, pp. 60–79, 2016. crust: constraints from natural lawsonite-bearing blueschist
[17] P. Agard, “Subduction of oceanic lithosphere in the Alps: and eclogite in Sivrihisar Massif, Turkey,” Physics of the Earth
selective and archetypal from (slow-spreading) oceans,” Earth and Planetary Interiors, vol. 250, pp. 12–30, 2016.
Science Reviews, vol. 214, article 103517, 2021. [33] Y. Cao, J. Du, M. Park et al., “Metastability and
[18] C. Teyessier, “Exhumation of deep orogenic crust,” Litho- nondislocation-based deformation mechanisms of the Flem
sphere, vol. 3, no. 6, pp. 439–443, 2011. eclogite in the Western Gneiss Region, Norway,” Journal of
Geophysical Research: Solid Earth, vol. 125, no. 5, article
[19] D. L. Whitney, C. Hamelin, C. Teyssier et al., “Deep crustal
e2020JB019375, 2020.
source of gneiss dome revealed by eclogite in migmatite (Mon-
tagne Noire, French Massif Central),” Journal of Metamorphic [34] Y. Cao, J. Du, H. Jung et al., “Crystal preferred orientations,
Geology, vol. 38, no. 3, pp. 297–327, 2020. deformation mechanisms and seismic properties of high pres-
sure metamorphic rocks from the Central Qiangtang meta-
[20] D. Mainprice and A. Nicolas, “Development of shape and lat-
morphic belt, Tibetan Plateau,” Journal of Structural Geology,
tice preferred orientations: application to the seismic anisot-
vol. 145, article 104309, 2021.
ropy of the lower crust,” Journal of Structural Geology,
vol. 11, no. 1-2, pp. 175–189, 1989. [35] H. U. Rehman, D. Mainprice, F. Barou, H. Yamamoto, and
K. Okamoto, “EBSD-measured crystal preferred orientation
[21] D. J. Prior, A. P. Boyle, F. Brenker et al., “The application of
of eclogites from the Sanbagawa metamorphic belt, central
electron backscatter diffraction and orientation contrast imag-
Shikoku, SW Japan,” European Journal of Mineralogy,
ing in the SEM to textural problems in rocks,” American Min-
vol. 28, no. 6, pp. 1155–1168, 2017.
eralogist, vol. 84, no. 11-12, pp. 1741–1759, 1999.
[36] P. Puelles, A. Beranoaguirre, B. Ábalos et al., “Eclogite inclu-
[22] T. M. Boundy, D. M. Fountain, and H. Austrheim, “Structural sions from subducted metaigneous continental crust (Mal-
development and petrofabrics of eclogite facies shear zones, pica-Tui Allochthonous Complex, NW Spain): petrofabric,
Bergen Arcs, western Norway: implications for deep crustal geochronology, and calculated seismic properties,” Tectonics,
deformational processes,” Journal of Metamorphic Geology, vol. 36, no. 7, pp. 1376–1406, 2017.
vol. 10, no. 2, pp. 127–146, 1992.
[37] M. Park and H. Jung, “Relationships between eclogite-facies
[23] G. Godard and H. L. M. van Roermund, “Deformation- mineral assemblages, deformation microstructures, and seis-
induced clinopyroxene fabrics from eclogites,” Journal of mic properties in the Yuka Terrane, North Qaidam
Structural Geology, vol. 17, no. 10, pp. 1425–1443, 1995. ultrahigh-pressure metamorphic belt, NW China,” Journal of
[24] B. Ábalos, “Omphacite fabric variation in the Cabo Ortegal Geophysical Research: Solid Earth, vol. 124, no. 12,
eclogite (NW Spain): relationships with strain symmetry dur- pp. 13168–13191, 2019.
ing high-pressure deformation,” Journal of Structural Geology, [38] S. Ulrich and D. Mainprice, “Does cation ordering in ompha-
vol. 19, no. 5, pp. 621–637, 1997. cite influence development of lattice-preferred orientation?,”
[25] R. Keppler, “Crystallographic preferred orientations in eclo- Journal of Structural Geology, vol. 27, no. 3, pp. 419–431, 2005.
gites - a review,” Journal of Structural Geology, vol. 115, [39] M. P. Searle and R. K. Stevens, “Obduction processes in
pp. 284–296, 2018. ancient, modern and future ophiolites,” Geological Society,
[26] J. Bascou, G. Barruol, A. Vauchez, D. Mainprice, and London, Special Publications, vol. 13, no. 1, pp. 303–319, 1984.
M. Egydio-Silva, “EBSD-measured lattice-preferred orienta- [40] A. L. Henderson, Y. Najman, R. Parrish, D. F. Mark, and G. L.
tions and seismic properties of eclogites,” Tectonophysics, Foster, “Constraints to the timing of India-Eurasia collision; a
vol. 342, no. 1-2, pp. 61–80, 2001. re-evaluation of evidence from the Indus Basin sedimentary
[27] J. Bascou, A. Tommasi, and D. Mainprice, “Plastic deforma- rocks of the Indus-Tsangpo Suture Zone, Ladakh, India,”
tion and development of clinopyroxene lattice preferred orien- Earth-Science Reviews, vol. 106, no. 3-4, pp. 265–292, 2011.
tations in eclogites,” Journal of Structural Geology, vol. 24, [41] Y. Najman, D. Jenks, L. Godin et al., “The Tethyan Himalayan
no. 8, pp. 1357–1368, 2002. detrital record shows that India-Asia terminal collision
[28] D. Pipenbreier and B. Stöckert, “Plastic flow of omphacite in occurred by 54 Ma in the Western Himalaya,” Earth and Plan-
eclogites at temperatures below 500°C - implications for inter- etary Science Letters, vol. 459, pp. 301–310, 2017.
plate coupling in subduction zones,” International Journal of [42] K. Sen, V. Adlakha, S. Singhal, and R. Chaudhury, “Migmati-
Earth Sciences, vol. 90, no. 1, pp. 197–210, 2001. zation and intrusion of “S-type” granites in the trans-
[29] W. Kurz, “Constriction during exhumation: evidence from Himalayan Ladakh Magmatic Arc of north India and their
eclogite microstructures,” Geology, vol. 33, no. 1, pp. 37–40, bearing on Indo-Eurasian collisional tectonics,” Geological
2005. Journal, vol. 53, no. 4, pp. 1543–1556, 2018.
[30] Y. Cao, S. G. Song, Y. L. Niu, H. Jung, and Z. M. Jin, “Variation [43] G. Bhattacharya, D. M. Robinson, and M. M. Wielicki, “Detri-
of mineral composition, fabric and oxygen fugacity from mas- tal zircon provenance of the Indus Group, Ladakh, NW India:
Downloaded from http://pubs.geoscienceworld.org/gsa/lithosphere/article-pdf/doi/10.2113/2022/7256746/5569363/7256746.pdf
by guestYou can also read