Investigating the Impact of Root-Lesion Nematodes (Pratylenchus thornei) and Crown Rot (Fusarium pseudograminearum) on Diverse Cereal Cultivars in ...
←
→
Page content transcription
If your browser does not render page correctly, please read the page content below
agronomy
Article
Investigating the Impact of Root-Lesion Nematodes
(Pratylenchus thornei) and Crown Rot
(Fusarium pseudograminearum) on Diverse Cereal Cultivars in a
Conservation Farming System
John P. Thompson *                 and Timothy G. Clewett †

                                          Centre for Crop Health, Institute for Agriculture and the Environment, University of Southern Queensland,
                                          West Street, Toowoomba, QLD 4350, Australia; tim@clewett.net.au
                                          * Correspondence: john.thompson@usq.edu.au
                                          † Present address: 155 Robinson Road, Geham, QLD 4352, Australia.

                                          Abstract: In two experiments on a farm practicing conservation agriculture, the grain yield of a range
                                          of wheat cultivars was significantly (p < 0.001) negatively related to the post-harvest population
                                          densities of Pratylenchus thornei in the soil profile to 45 cm depth. In a third and fourth experiment
                                          with different rotations, methyl bromide fumigation significantly (p < 0.05) decreased (a) a low initial
                                          population density of P. thornei in the soil profile to 90 cm depth and (b) a high initial population of
                                          P. thornei to 45 cm depth, and a medium level of the crown rot fungus, Fusarium pseudograminearum,
                                at 0–15 cm depth to a low level. For a range of wheat and durum cultivars, grain yield and response
                                   to fumigation were highly significantly (p < 0.001) related to (a) the P. thornei tolerance index of
Citation: Thompson, J.P.; Clewett,        the cultivars in the third experiment, and (b) to both the P. thornei tolerance index and the crown
T.G. Investigating the Impact of          rot resistance index in the fourth experiment. In the latter, grain yield was significantly (p < 0.001)
Root-Lesion Nematodes (Pratylenchus       positively related to biomass at anthesis and negatively related to percentage whiteheads at grain
thornei) and Crown Rot (Fusarium          fill growth stage. One barley cultivar was more tolerant to both diseases than the wheat and
pseudograminearum) on Diverse Cereal      durum cultivars. Crop rotation, utilizing crop cultivars resistant and tolerant to both P. thornei and
Cultivars in a Conservation Farming
                                          F. pseudograminearum, is key to success for conservation farming in this region.
System. Agronomy 2021, 11, 867.
https://doi.org/10.3390/
                                          Keywords: root-lesion nematode; Pratylenchus thornei; crown rot; Fusarium pseudograminearum; wheat;
agronomy11050867
                                          durum; barley; soil fumigation; DNA based diagnosis
Academic Editor: Aritz Royo-Esnal

Received: 31 March 2021
Accepted: 26 April 2021
                                          1. Introduction
Published: 28 April 2021                        Root-lesion nematodes (Pratylenchus thornei Sher and Allen, 1953 and P. neglectus
                                          (Rensch, 1924) Filipjev and Schuurmans Stekhoven, 1941) are a serious threat to wheat
Publisher’s Note: MDPI stays neutral      (Triticum aestivum L.) production in Australia [1,2], where they have been estimated to
with regard to jurisdictional claims in   cause losses valued at AU$123 M/annum [3]. These nematode species are also of global
published maps and institutional affil-   importance to wheat production in many other countries [4,5]. In the subtropical grain
iations.                                  region of eastern Australia, also referred to as the northern grain region, P. thornei was
                                          found to be more widespread, and in higher population densities, than P. neglectus [6]. In
                                          this region, wheat and other grain crops are grown mainly on vertisols [7]. The high clay
                                          contents and deep soil profiles of vertisols can store soil water during fallow periods, which
Copyright: © 2021 by the authors.         is an important factor for successful dryland cropping in this semi-arid environment [8].
Licensee MDPI, Basel, Switzerland.              Wheat was the dominant crop in rotations when root-lesion nematodes were first
This article is an open access article    recognised as a problem in the Darling Downs area of the subtropical grain region, in
distributed under the terms and           the late 1970s [1]. Since then, there have been substantial changes in the farming systems
conditions of the Creative Commons        used by growers in the region with a greater diversity of crops grown, and adoption of
Attribution (CC BY) license (https://     conservation farming measures including stubble retention, reduced tillage, soil testing to
creativecommons.org/licenses/by/          guide fertiliser use and monitoring of soil water to aid sowing decisions (Table 1).
4.0/).

Agronomy 2021, 11, 867. https://doi.org/10.3390/agronomy11050867                                          https://www.mdpi.com/journal/agronomy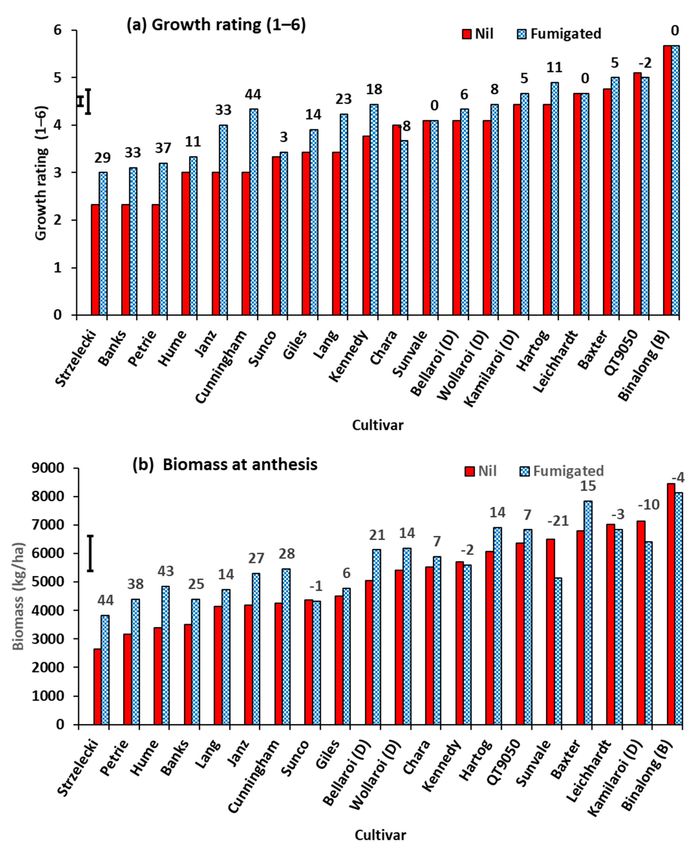
Agronomy 2021, 11, 867                                                                                                  2 of 28

                         Table 1. Change in farming practices on the Darling Downs of Queensland.

   Agronomic Practice           Traditional Systems                          Conservation Farming Systems
                         •   Continuous wheat, or 3 years of
                                                               •   Less wheat, and more summer crops and other
 Crop rotations              wheat then 1–2 years sorghum
                                                                   winter crops
                             (Sorghum bicolor)

                         •   No grain legumes                  •   Grain legumes

 Stubble management      •   Stubble burnt                     •   Stubble retained

                         •   Full tillage                      •   Reduced tillage
 Tillage practices
                         •   Random traffic                    •   Controlled traffic

                                                               •   N fertiliser used based on deep soil testing
 Fertiliser practices    •   None or little fertiliser use
                                                               •   P and Zn fertilisers used based on topsoil testing

 Soil water monitoring   •   None, or monitoring by probing    •   Soil coring to assess plant-available water before sowing

                                   Better balanced rotations now include other cereals, coarse grains, particularly sorghum
                             (Sorghum bicolor (L.) Moench), pulses and oilseeds. However, it has become apparent that
                             some of these rotational crops can also host P. thornei [9].
                                   Traditional farming practices were to burn stubble soon after harvest and mechanically
                             till fallow land to control weeds. These practices have now been largely replaced by
                             conservation tillage practices in which stubble is retained and weed control is largely with
                             herbicides [10]. Conservation tillage practices have been shown to result in less erosion
                             of the clay soils of this region [10,11], and to achieve better water infiltration into the
                             soil profile. Better water infiltration occurs because the retained stubble protects the soil
                             surface from raindrop impact, which causes soil disaggregation, resulting in decreased
                             water penetration. In addition, mechanical tillage disrupts continuous macropores from
                             root and earthworm channels and can form plough pans, which restrict water percolation.
                             Conservation tillage practices work best to increase water infiltration and consequent grain
                             yield when combined with controlled traffic to minimise the impact of farm machinery
                             on soil compaction [12]. Conservation tillage practices also provide better conditions for
                             soil biota than traditional tillage practices [13]. However, higher population densities
                             of P. thornei were detected in the topsoil layer with zero tillage than with mechanical
                             tillage of a vertisol in the long-term Hermitage Fallow Management Experiment [14].
                             Pratylenchus thornei was found to cause poor yield response to the extra stored soil water in
                             the conservation tillage treatment by an intolerant wheat cultivar compared to a tolerant
                             barley (Hordeum vulgare L.) cultivar [15]. Subsequent selection of a wheat cultivar for
                             sowing each year that is the most P. thornei-tolerant cultivar available commercially at
                             the time has resulted in wheat yields that better reflect the available water stored in the
                             soil profile with the various stubble and tillage management treatments in the Hermitage
                             Fallow Management Experiment [16]. It has been considered that continued retention of
                             stubble in conservation agriculture might contribute to organic matter-mediated general
                             suppression of P. thornei in the soil [17], thereby counteracting other environmental factors
                             in conservation agriculture that promote reproduction and survival of P. thornei.
                                   Cultivars of wheat and other susceptible crop species vary in their reaction to P. thornei,
                             as characterized by levels of resistance and tolerance. There are various ways to characterize
                             the resistance and tolerance of nematodes and fungal pathogens [18]. Here, we define
                             a resistant cultivar as one that can retard nematode reproduction in its roots, resulting
                             in lower final nematode population densities than a susceptible cultivar. Resistance of
                             cereal cultivars to P. thornei can be determined under field conditions [19] or under more
                             controlled conditions in the glasshouse [20]. Tolerance is best determined under the field
                             conditions of the region where the crop is grown, so that relevant environmental conditions
                             can interact with the nematode parasite and the host cultivar to result in a relevant yield
                             outcome [21,22]. Here, we define a tolerant crop cultivar as one that can grow and yield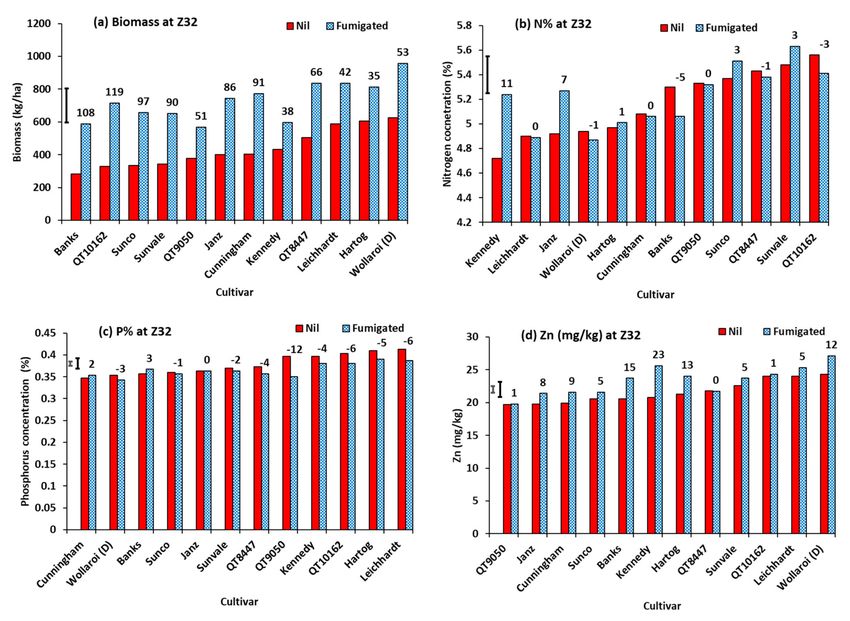
Agronomy 2021, 11, 867                                                                                            3 of 28

                         well in nematode-infested fields in comparison with an intolerant cultivar [22–25]. Both
                         resistance and tolerance are quantitative traits and such information about commercial
                         cultivars is provided to growers in the northern grain region on a nine-level ordinal
                         rating system [26,27] derived from multi-experiment analysis of quantitative data [20,22].
                         Inheritance of resistance to P. thornei in wheat is polygenic with additive gene action [28–30].
                         Because P. thornei builds up to a lesser extent in the roots of resistant than susceptible wheat
                         cultivars during the growing season, this can result in grain yield differences between
                         cultivars [20]. Cultivars can also possess independent non-specific genetic factors [21] by
                         which they yield better (tolerance) or worse (intolerance) than expected from their levels
                         of resistance. The combined effects of such resistance factors and tolerance factors on the
                         grain yield of wheat cultivars have been captured in a single tolerance index derived from
                         a multi-environment trial analysis of grain yield on P. thornei-infested field sites [22].
                               Another major disease of winter cereals in the subtropical grain region of eastern
                         Australia is crown rot caused by the fungus Fusarium pseudograminearum O’Donnell and T.
                         Aoki (syn. F. graminearum Group 1), which has been estimated to cause losses of AU$79
                         M/annum Australia wide [3]. The incidence of this disease has increased with the change
                         to conservation agriculture, and it is now the most important soil/stubble-borne disease,
                         followed by root-lesion nematodes, as gauged by specific DNA levels in soil samples from
                         Australian grain regions [31]. During its parasitic phase, F. pseudograminearum colonises the
                         stem bases of wheat plants, resulting in browning that extends with the infection up the
                         stem during the growing season. The disease is most severe when rainfall of 25 to 50 mm
                         occurs within 6 to 8 weeks of plant emergence followed by a dry spring [32]. Interaction
                         between water availability in the soil and the effects of the crown rot fungus reducing water
                         conductance in the xylem can result in bleached heads, known as whiteheads or deadheads,
                         that contain shriveled or no grain at the normal grain filling stage. Klein et al. [33] found
                         that the loss of potential wheat yield was better correlated with percentage of whiteheads
                         (r = 0.89) than with incidence of stem basal browning (r = 0.59) or infection with Fusar-
                         ium pseudograminearum determined by plating stubble pieces on a selective agar medium
                         (r = 0.58). Between crops, the fungus survives in stubble located above the soil surface or
                         incorporated in the soil [34]. Consequently, it is unsurprising that burning stubble soon
                         after harvest, compared with retaining stubble throughout the fallow period, results in a
                         reduction in crown rot in the following crop [35]. Therefore, the change in farming practices
                         towards stubble retention was seen as a contributing factor to an increase in the prevalence
                         of crown rot as an issue for growers in the region [36,37]. However, the better storage of
                         soil water with stubble retention can offset the interaction between crown rot disease and
                         limited water supply in reducing yield [32]. Ratings of resistance to crown rot of cultivars
                         of wheat and durum (Triticum turgidum L.) for growers [27,38] are provided on an ordinal
                         scale of 1 (very susceptible) to 9 (resistant), derived using a formula incorporating both
                         incidence (based on tiller numbers) and severity of browning of stem bases of mature
                         plants from field experiments [32].
                               The ‘National Soil Fumigation Project’ was established in 2001 by the Grains Research
                         and Development Corporation (GRDC) of Australia to assess the potential for increasing
                         wheat production through removal of known and unknown biological constraints in the
                         soil by methyl bromide fumigation. Methyl bromide was regarded as an effective broad-
                         spectrum biocide with good soil penetration properties, which was available for use then,
                         but has now been phased out, along with other ozone depleting organohalides, as part
                         of the Montreal Protocol. Two types of trials were envisaged: (1) farm trials with small
                         replicated plots imposed on farmer-managed fields, and (2) research trials with strips of
                         fumigant imposed across established research experiments investigating management treat-
                         ments such as crop rotation, type of tillage and stubble treatment. Although the program
                         was nationally coordinated, participants were given the flexibility to investigate issues
                         that they considered important using methods considered appropriate for their region.
                         As part of this program, we used methyl bromide fumigation to quantify the effects of
                         P. thornei on yield loss in wheat on a farm where the best conservation agriculture practices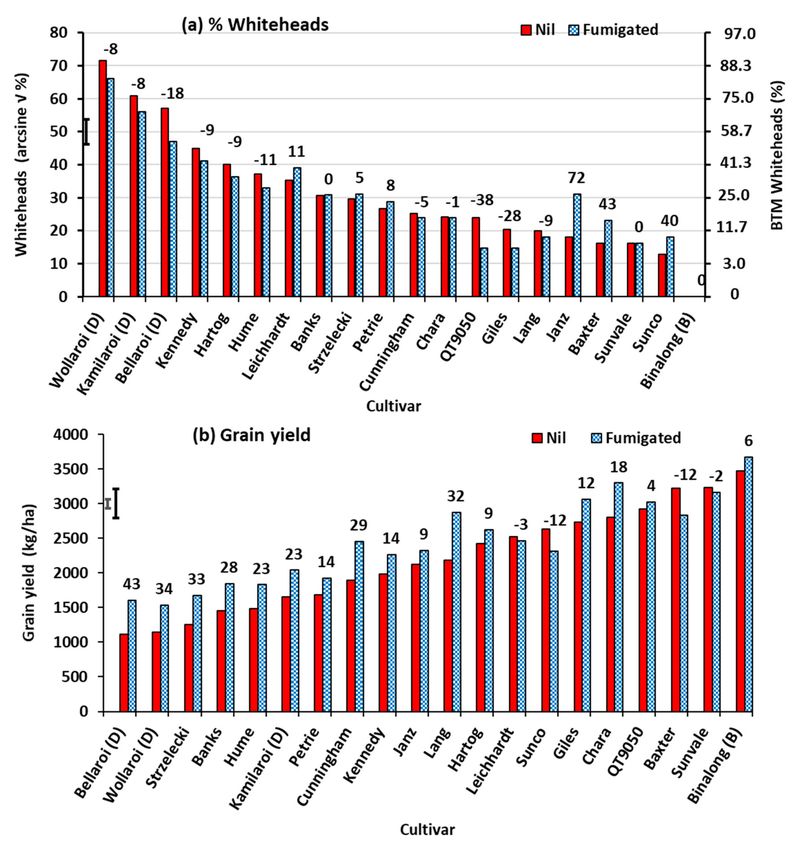
Agronomy 2021, 11, 867                                                                                                          4 of 28

                                    were in use. Methyl bromide presented some advantages over other fumigants, such as
                                    chloropicrin or methyl isothiocyanate liberators such as dazomet that can considerably
                                    change the concentrations of available nutrients in soil [39,40], complicating interpreta-
                                    tion of responses. Additionally, because methyl bromide has a vapour density of 3.3, it
                                    presented the opportunity for control of P. thornei occurring in vertisols deeper in the soil
                                    profile than 30 cm, which was the limit of effectiveness of the nematicide aldicarb in a
                                    previous study [41]. Aldicarb was the most effective of nematicides previously tested for
                                    control of P. thornei in vertisols in this region [40,42]
                                         This paper reports an investigation into the yield responses of a range of cereal
                                    cultivars to P. thornei occurring in fields with best management practices for conservation
                                    agriculture, and their yield responses where F. pseudograminearum naturally co-occurred
                                    with P. thornei at damaging levels.

                                    2. Materials and Methods
                                    2.1. Field Experiments
                                          Four field experiments were conducted over several years on a commercial grain
                                    farm near Macalister (Lat. 27.03◦ S, Long. 151.07◦ E; elevation 337 m), Australia. The
                                    farm combined good crop rotational practices with conservation tillage practices (zero-till,
                                    stubble retention, controlled traffic), as well as pre-plant soil sampling for monitoring of
                                    soil water and deep nitrate for best sowing decisions and fertiliser management practice.
                                    The soil at the site is a Black Vertosol [43] of the Bongeen soil type [44] containing 60% clay.
                                    Experiments 1 and 2 were designed to assess the grain yield of a range of wheat breeding
                                    fixed lines and named cultivars in the year 2001. Following the observation of poor growth
                                    of some cultivars known to be intolerant to P. thornei, the soil under a number of cultivars
                                    in both experiments was sampled in layers to 150 cm deep after harvest to characterize final
                                    P. thornei population densities. In this paper, we will refer to all fixed lines as ‘cultivars’,
                                    whether named for commercial release or with code numbers. The term cultivar here
                                    means ‘cultivated variety’ derived from plant breeding, and is used rather than ‘genotype’,
                                    a term best confined to genetic studies [45]. Experiments 3 and 4 were conducted to assess
                                    a range of cereal cultivars (11 bread wheat and one durum in Experiment 3 in 2002; and
                                    16 bread wheat, three durum and one barley in Experiment 4 in 2003) for response to soil
                                    fumigation with methyl bromide. The land for the experiments had 92 kg N/ha applied as
                                    urea by the grower in March of each year. The cropping histories from farm records of the
                                    land used for the respective experiments are given in Table 2.

              Table 2. Cropping histories of the field sites used for the experiments. Cultivar names are in parentheses.

            Experiments 1 and 2                               Experiment 3                               Experiment 4
      2001 Wheat cultivar experiments                  2002 Fumigation experiment                2003 Fumigation Experiment
           2000–2001 Black gram                     2001 Chickpea (Cicer arietinum,                 2002 Chickpea (Howzat)
          (Vigna mungo cv. Regur)               mixed cultivars Jimbour, Kaniva, Howzat              2001 Wheat (Kennedy)
       1999 Wheat (Hybrid Mercury)                            and Barwon)                        2000–2001 Black gram (Regur)
              1998 Barley (Skiff)                          2000 Barley (Tallon)                  1999 Wheat (Hybrid Mercury)
      1997–1998 Sorghum (Buster MR)                 1998–1999 Maize (Zea mays C76)                     1998 Barley (Skiff)
      1996–1997 Sorghum (Buster MR)                 1997–1998 Sorghum (Buster MR)              1997–1998 Sorghum (Buster MR)
      1995–1996 Sorghum (Buster MR)                 1996–1997 Sorghum (Buster MR)              1996–1997 Sorghum (Buster MR)

                                    2.2. Experiments
                                          All experiments were conducted with three replicates of treatments in randomised
                                    complete blocks. In Experiments 1 and 2, the treatments were wheat cultivars laid out in
                                    the field as a row: column design [46]. In Experiments 3 and 4, the treatments comprised
                                    a full factorial of cereal cultivars by soil fumigation with two levels (nil and fumigated).
                                    Plot dimensions were 8 m long × 7 seed rows of 25 cm cut back to 6.5 m for harvest in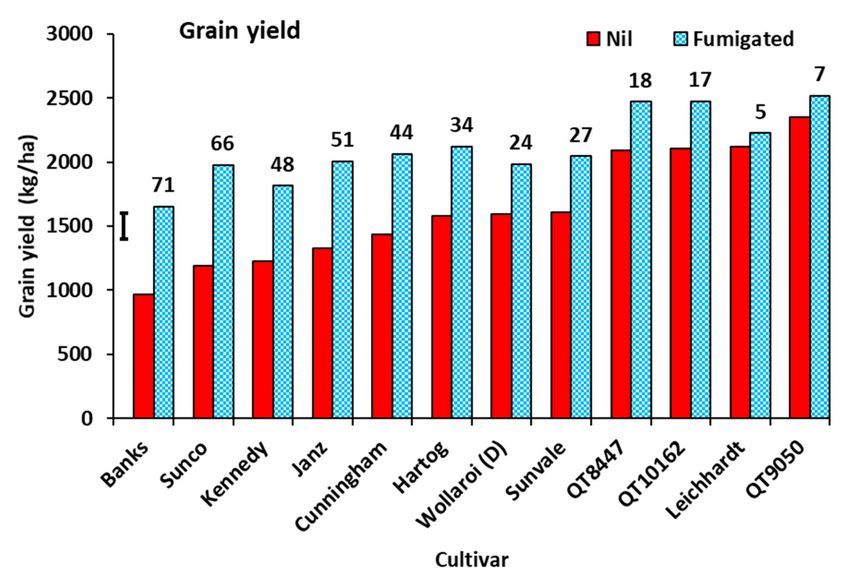
Agronomy 2021, 11, 867                                                                                           5 of 28

                         Experiments 1 and 2, and 8 m long × 7 rows of 25 cm with plots spaced 2.25 m apart and
                         cut back to 5 m for harvest in Experiments 3 and 4. In Experiments 3 and 4, plots to be
                         fumigated were trenched on all sides to 20 cm depth, covered with thick polyethylene
                         tarpaulin, which was then sealed in the trench with soil. The soil was fumigated with
                         methyl bromide (0.91 kg/10 m2 ) by a commercial operator using the hot gas method [47];
                         tarpaulins were removed after 4 days. After 14 days, the soil was sampled and after 17 days,
                         the experiments were sown. The various cereal cultivars were sown through the cone of a
                         seed drill. Weighed quantities of seed, calculated from kernel weights and germination
                         percentages, were sown for a target population of 100 viable seeds/m2 . For Experiments 1
                         and 2, fertiliser applied at sowing was urea supplying 55 kg N/ha as a side dressing, and
                         with 40 kg/ha Starter Z (Granulock Z, Incitec Pivot) supplying 3.7 kg N/ha, 8.2 kg P/ha,
                         1.6 kg S/ha, and 1.0 kg Zn/ha applied in the seed drill rows. For Experiments 3 and
                         4, fertiliser applied at sowing in the seed drill rows was 75 kg/ha Starter Z supplying
                         7.0 kg N/ha, 15.4 kg P/ha, 3.0 kg S/ha, and 1.9 kg Zn/ha.
                               Grain from all experiments was harvested when ripe (Zadoks growth stage Z93 [48])
                         with a combine harvester (Kingaroy Engineering Works, Kingaroy, Australia). Grain
                         moisture percentage was determined by drying a 100 g subsample in a forced draught
                         oven at 80 ◦ C for 2 days. Grain yield was expressed in kg/ha at 12% moisture equivalent,
                         calculated from harvested grain weight/plot and grain moisture percentage.

                         2.3. Soil Sampling
                              Deep soil coring of Experiments 1 and 2 was undertaken in early February following
                         harvest of wheat cultivars in late November. Deep soil coring of Experiments 3 and 4, was
                         undertaken in July at 15 days after the tarpaulins for fumigation were removed. Cores
                         of 4.5 cm diameter were taken at four evenly spaced intervals from the plots using an
                         hydraulically operated rig. The cores were divided into depth intervals of 0–15, 15–30,
                         30–45, 45–60, 60–90, 90–120, and 120–150 cm. The four cores from each plot were bulked in
                         respective depth intervals, and sealed in plastic bags for transport to the laboratory where
                         they were stored at 4 ◦ C pending processing for analysis. The soil samples were manually
                         broken into pieces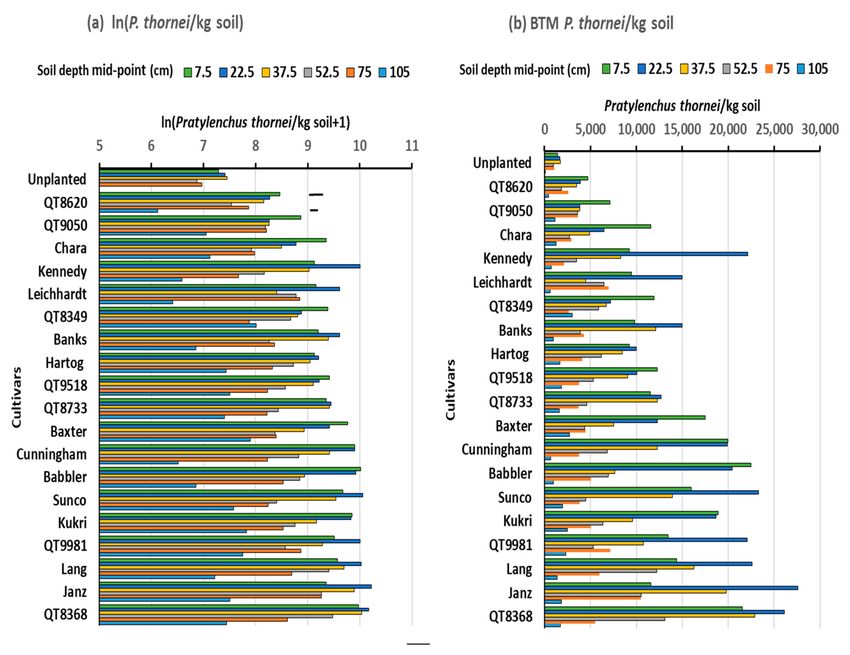
Agronomy 2021, 11, 867                                                                                                         6 of 28

                                   2.5. Pratylenchus Thornei, other Nematode Species and Fusarium Pseudograminearum
                                         Nematodes were extracted using the Whitehead tray method [50] from a 150 g field-
                                   moist subsample of soil in a constant temperature room at 22 ◦ C for 48 h. Nematodes in
                                   the extract were collected on a 20-µm mesh sieve and concentrated into ~15 mL water then
                                   stored in a specimen vial at 4 ◦ C until counting. Nematodes were counted in a 1-mL Peters
                                   slide [51] (Chalex Corporation, Portland, Oregon, USA), with a compound microscope
                                   (Olympus BH-2, Tokyo, Japan) at ×40 and ×100 magnifications. Pratylenchus thornei were
                                   identified morphologically [52], and counts were expressed as number of P. thornei/kg soil
                                   (oven dry equivalent).
                                         Subsamples of 300 g of undried soil were tested for nematode and fungal pathogens by
                                   the Root Disease Testing Service (RDTS) of the South Australian Research and Development
                                   Institute (SARDI). Quantitative PCR assays using species-specific rDNA sequences for the
                                   nematode species P. thornei, P. neglectus and the cereal cyst nematode Heterodera avenae
                                   (Wollenweber 1924), and the fungus F. pseudograminearum were applied to DNA extracted
                                   from the bulk soil [53]. Results for this DNA based method were expressed in equivalent
                                   number of nematodes/g of soil from prior calibrations of DNA extracted from known
                                   numbers of nematodes [53], and in pico grams of F. pseudograminearum DNA/g soil.

                                   2.6. Soil Chemical Properties
                                         For Experiments 3 and 4, subsamples of 150 g of field moist soil were extracted with
                                   1 N KCl for determination of nitrate-nitrogen and ammonium-nitrogen (Code no. 7C2, [54],
                                   and results were expressed as mg N/kg dry soil. These values were converted to kg/ha
                                   by multiplying by the appropriate bulk density and depth interval in decimetres, then
                                   summing over the profile to 150 cm depth. Other subsamples of 100 g were dried in a
                                   forced draught oven at 40 ◦ C for 4 days, then ground to pass a 4 mm sieve. These samples
                                   were analysed for (a) Colwell [55] bicarbonate-extractable phosphorus (Code No. 9B2) [54];
                                   (b) DTPA-extractable zinc [56] with analysis by atomic absorption spectrometry (Code
                                   12A1) [54], and pH of 1 soil: 5 water suspension (Code No. 4A1) [54]. Duplicate undried
                                   soil samples (equivalent of 20 g oven-dry weight) were moistened to 56% moisture content
                                   (equivalent to pF 2) in sterile glass jars (60 mm diameter × 70 mm high), sealed with
                                   polythene film and incubated at 30 ◦ C for 28 days. After incubation, one sample was
                                   extracted with 100 mL of 2N potassium chloride, and analysed for ammonium-nitrogen
                                   and nitrate-nitrogen as described above. The other incubated sample was dried at 40 ◦ C
                                   and analysed for phosphorus, zinc and pH as described above.

                                   2.7. Crop Measurements
                                        In Experiment 3, plant biomass was determined at stem elongation (growth stage
                                   Z32 [48]. Plants were counted in two 0.5 m lengths of row selected at random from the
                                   middle rows of the plots, and then plants were cut at ground level and removed in paper
                                   bags. The plant biomass was dried in a forced draught oven at 65 ◦ C for 4 days, and after
                                   weighing, was ground for chemical analyses.
                                        In Experiment 4, marked differences between plots in the growth of plants was
                                   observed at late stem elongation (Z35), with symptoms of P. thornei damage evident in a
                                   number of the cultivars. Plots were rated on a 1 to 6 scale for symptoms of crop yellowing,
                                   stunting, and poor canopy closure (Table 3).

                   Table 3. Rating system of plant growth and symptoms at late stem elongation (Z35) in Experiment 4.

       Growth Rating                                                   Description of Plants
               1                                           stunted with marked leaf chlorosis and necrosis
               2                               severe lower leaf chlorosis, reduced tillering, and poor canopy closure
               3                         lower leaf chlorosis, reduced biomass, and ~50% canopy closure of inter-row space
               4                        green with some lower leaf chlorosis, and ~60% canopy closure of the inter-row space
               5                                       green with ~80–90% leaf closure of the inter-row space
               6                                     dark green with full canopy closure of the inter-row space.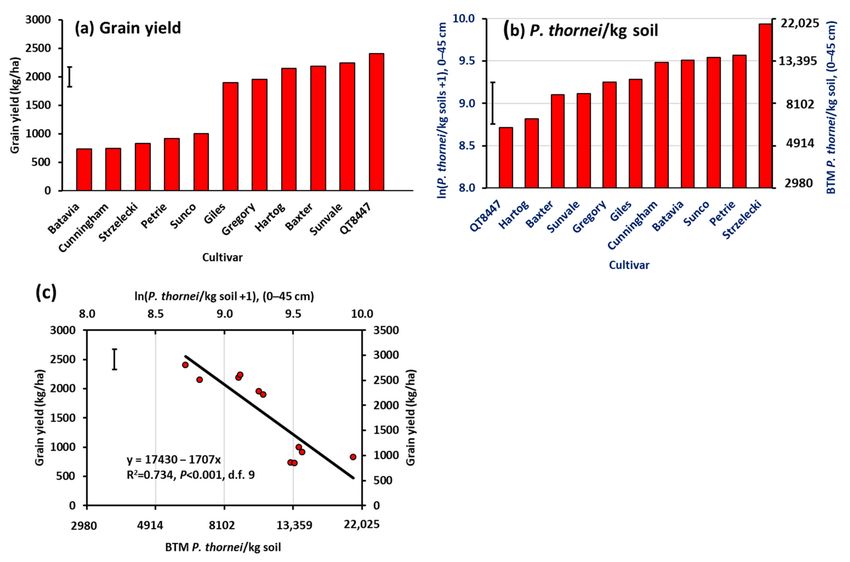
Agronomy 2021, 11, 867                                                                                                        7 of 28

                                        Plant biomass was determined at anthesis (Z65) [48] by cutting two quadrats of
                                    1 m × 2 rows at approximately one third the distance into the plots from each end. Biomass
                                    was dried at 80 ◦ C in a forced draught oven for 4 days before weighing. Whiteheads were
                                    evident in the plots at the grain filling stage (Z75–80) [48] and these whiteheads were on
                                    culms with basal stem browning indicative of crown rot. The percentage of whiteheads on
                                    a whole plot basis was estimated visually.

                                    2.8. Plant Chemical Analysis
                                         The dried plant material taken at Z32 in Experiment 3 was ground and subsamples
                                    were subjected to micro-Kjeldahl digestion before autoanalysis for nitrogen [57] and phos-
                                    phorus [58]. Other subsamples were subjected to di-acid digestion (nitric-perchloric [59]),
                                    then analysed for zinc by atomic absorption spectrometry. Bromine concentrations were
                                    determined in other subsamples by x-ray fluorescence analysis.

                                    2.9. Statistical Analyses
                                         All soil and plant data were analysed by analysis of variance (ANOVA) and where
                                    the F test was statistically significant, Fishers protected least significant difference (l.s.d.)
                                    at p = 0.05 was used to compare treatments. Nematode count data were transformed by
                                                                                       √
                                    ln(x+1) and percentage whiteheads by arcsine % before statistical analysis for confor-
                                    mation to normal distributions. Linear regression analysis was used to relate grain yield
                                    of wheat cultivars to final population density of P. thornei in the soil profile to 45 cm for
                                    Experiments 1 and 2. Correlation coefficients between grain yield and other measures of
                                    plant performance during the growing season were calculated for Experiment 4. Multiple
                                    regression was used in Experiment 4 to relate grain yield to growth rating or biomass at
                                                                                                        √
                                    anthesis and percentage whiteheads (transformed by arcsine %). Multiple regression
                                    was used to relate grain yield from nil-treated soil, or percentage change in grain yield
                                    with soil fumigation, as response variates, to indices for tolerance to P. thornei [22] and
                                    resistance to crown rot ([38], G.B. Wildermuth pers. comm.) as explanatory variates for
                                    wheat and durum cultivars in Experiments 3 and 4. The P. thornei tolerance index used was
                                    derived from independent multi-experiment analysis based on predicted grain yield (t/ha)
                                    of wheat and durum cultivars grown on P. thornei-infested field sites [22]. The crown rot
                                    resistance index used was an ordinal rating system of 1 (very susceptible) to 9 (resistant)
                                    based on stem browning from independent field experiments ([38], G.B. Wildermuth pers.
                                    comm.). Statistical analyses were conducted in Genstat [60].

                                    2.10. Rainfall
                                          The monthly and annual rainfalls relevant to the experiments are given in Table 4, in
                                    comparison with average long-term monthly and annual rainfalls from the nearest Bureau
                                    of Meteorology (BOM) site. For both years in which the fumigation Experiments 3 and 4
                                    were conducted there was little rainfall in May, but approximately 50 mm in June, which
                                    moistened the soil for subsequent effective fumigation and sowing of the experiments in
                                    July. For Experiment 3, there was substantial rainfall in August for nodal root development,
                                    and some rainfall in October for grain set, whereas in Experiment 4, there was some
                                    rainfall in August for nodal root development and a substantial amount in October for
                                    grain development.

     Table 4. Rainfall in experiment years compared with long-term averages (1972–2021) of Bureau of Meteorology (BOM site
     no. 41469) records from Macalister (4 km from experiment site).

                                                                             Rainfall (mm)
 Experiment No.          Year   J         F      M       A      M        J        J     A      S       O       N      D      Total
  Exps 1 and 2           2001   32       135     41      54     14       0       21     8      18      83     119      44     568
     Exp 3               2002   58        60      88      1      5      48        0     61      7      30      22      92     472
     Exp 4               2003   30       108     150     50     14      51       13     18      8      89      22     154     707
 Macalister BOM                 83        75     57      33     42      31       31     28     32      65      69      92     636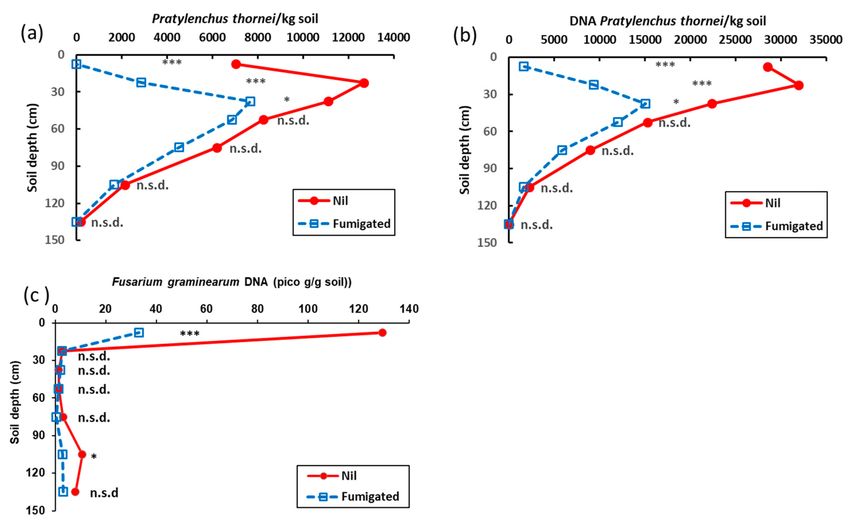
Agronomy 2021, 11, 867                                                                                                             8 of 28

                                  3. Results
                                  3.1. Experiment 1
                                       The final population densities of P. thornei, occurring in layers in the soil profile to
                                 120 cm deep after harvest of wheat cultivars in Experiment 1, are shown in Figure 1a as
                                 ln(P. thornei/kg soil), with the back-transformed means in Figure 1b. In ANOVA, there were
                                 highly significant effects of cultivar (p < 0.001) and soil depth (p < 0.001), and a significant
                                 cultivar x depth interaction (p = 0.03). Greatest population densities were after Strzelecki
                                 in the 15–30 and 0–15 soil layers with 23,500 and 21,500 P. thornei/kg soil, respectively. In
                                 comparison, the population densities in unplanted soil at these depths were 5600 and 5100,
                                 respectively. Other cultivars with a relatively higher population density in the 15–30 cm
                                 layer were Sunco, Petrie and Gregory, whereas cultivars Batavia and Cunningham had
                                 relatively high population densities in both 0–15 and 15–30 cm depth intervals, and Giles
                                 and Sunvale had relatively higher population densities somewhat deeper in the 15–30 and
                                 30–45 cm layers. Overall, cultivars Hartog and QT8447 had the lowest population densities
                                 in the soil profile, not much greater than the unplanted soil.
                                       There was a wide range in grain yield from 730 kg/ha for Batavia to 2410 kg/ha
                                 for QT8447 in Experiment 1 (Figure 2a). Other higher yielding cultivars were Sunvale,
                                 Baxter, Hartog, Gregory and Giles, while other lower yielding cultivars were Cunningham,
                                 Strzelecki, Petrie, and Sunco. There was a highly significant linear regression relationship
                                 between grain yield and P. thornei population density in the 0–15 cm layer (R2 = 0.603,
                                 p = 0.003, d.f. = 9). This relationship increased in significance as greater depths were
                                 taken into consideration to reach a maximum at 0–45 cm (R2 = 0.734, p < 0.001, n = 9)
                                 (Figure 2b,c). The regression relationships then decreased in significance gradually with
                                 successive depths to become p = 0.006 at 0–120 cm and fell ultimately to p = 0.056 at
                                 0–150 cm.

     Figure 1. Population densities of Pratylenchus thornei, in depth intervals of 0–15, 15–30, 30–45, 45–60, 60–90 and 90–120 cm in
     the soil profile, after harvest of 11 wheat cultivars in Experiment 1, (a) mean values for ln(P. thornei/kg soil+1) from ANOVA
     with bar marker representing l.s.d. (p = 0.05) for cultivar x depth interaction, (b) back-transformed values of number of P.
     thornei/kg soil. Cultivars are arranged in ascending order of mean P. thornei population density.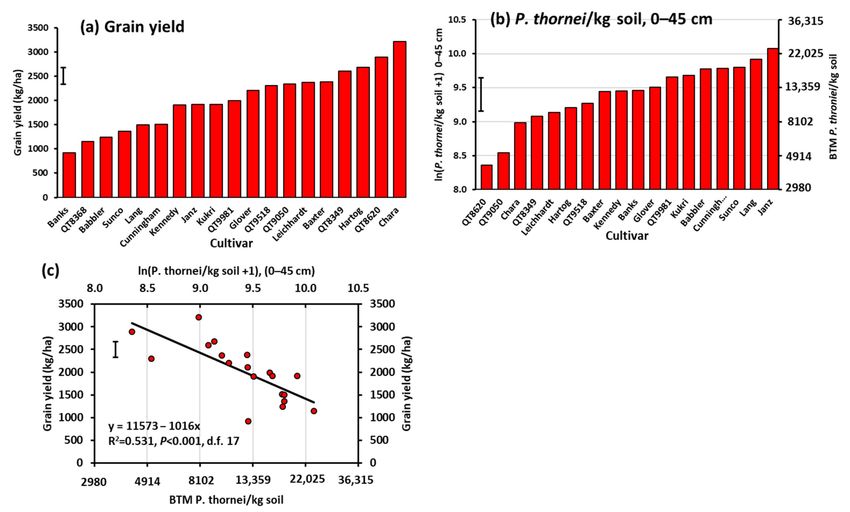
Agronomy 2021, 11, 867                                                                                                      9 of 28

     Figure 2. (a) Grain yield of 11 wheat cultivars in Experiment 1, (b) mean ln(P. thorneiI/kg soil +1) of final population
     densities in the soil profile to 45 cm depth after harvest, and (c) regression relationship between yield and P. thornei
     population density. Cultivars are in ascending order of value on the Y-axis in (a,b). BTM = back-transformed mean. Bar
     markers represent the l.s.d. (p = 0.05).

                                3.2. Experiment 2
                                      The final population densities of P. thornei in layers in the soil profile to 120 cm
                                deep, after harvest of the wheat cultivars in Experiment 2, are shown in Figure 3a as
                                ln(P. thornei/kg soil) with the back-transformed means in Figure 3b. In ANOVA, there
                                were highly significant effects of cultivar (p < 0.001) and soil depth (p < 0.001), but a non-
                                significant interaction. Greatest population densities were in the 15–30 and 0–15 layers
                                with respective averages across all cultivars of 12,250 and 11,150 P. thornei/kg soil. Average
                                population density then diminished further down the profile to be 8300 at 30–45, 4930 at
                                45–60, 4000 at 60–90 and 1170 at 90–120. Greatest population densities at any depth in the
                                soil profile were 27,580 after Janz and 26,130 after QT8368, both at 15–30 cm (Figure 3b).
                                Additionally, over the whole soil profile to 120 cm, these two cultivars had the highest
                                average population densities with 10,800 P. thornei/kg soil for QT8368, and 10,400 for Janz.
                                Lowest average population densities were for QT8620 with 2290 P. thornei/kg soil, and for
                                QT9050 with 3420 P. thornei/kg soil, compared with unplanted soil with 820 P. thornei/kg
                                soil (Figure 3b).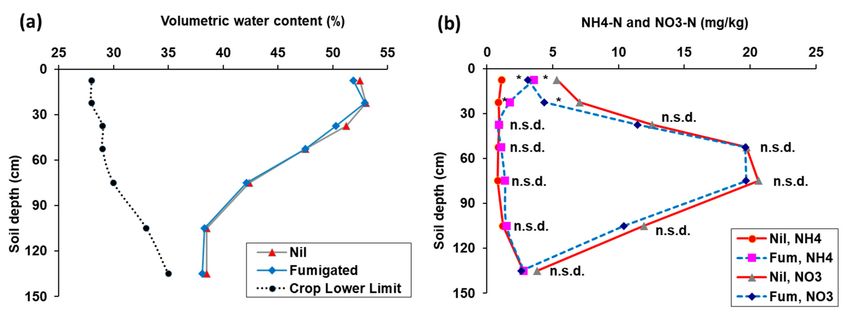
Agronomy 2021, 11, 867                                                                                                        10 of 28

     Figure 3. Population densities of Pratylenchus thornei in the soil profile in depth intervals of 0–15, 15–30, 30–45, 45–60,
     60–90 and 90–120 cm after harvest of 19 wheat cultivars in Experiment 2, (a) mean values for ln(P. thornei/kg soil+1) from
     ANOVA with bar markers (p = 0.05) for main effects of cultivar and soil depth, (b) back-transformed values of number of
     P. thornei/kg soil. Cultivars are in ascending order of mean P. thornei population density.

                                       Grain yield ranged from the least for Banks of 920 kg/ha up to the most for Chara of
                                 3210 kg/ha in Experiment 2 (Figure 4a). Other cultivars with higher yields were QT8620,
                                 Hartog, QT8349, and Baxter. Other cultivars with lower yields were QT8368, Babbler and
                                 Sunco. There was a significant linear regression relationship between grain yield and
                                 P. thornei population density in the 0–15 cm depth (R2 = 0.268, p = 0.013, n = 17), which
                                 became highly significant when greater depths in the soil profile were taken into account.
                                 The regression relationships between grain yield and population densities of P. thornei
                                 in the soil profile for 0–45 cm depth had the greatest percentage of variation explained
                                 (R2 = 0.531, p < 0.001, n = 17) (Figure 4b,c) compared with other profile depths.
Agronomy 2021, 11, 867 11 of 28
Figure 4. (a) Grain yield of 19 wheat cultivars in Experiment 2, (b) mean ln(P. thorneiI/kg soil +1) of final population
densities in in the soil profile to 45 cm depth after harvest, and (c) regression relationship between yield and P. thornei
population density. Cultivars are in ascending order of value on the Y-axis in (a,b). BTM = back-transformed mean. Bar
markers represent the l.s.d. (p = 0.05).
3.3. Experiment 3.
The soil before sowing Experiment 3 contained a low population density of P. thornei in
the topsoil (1100/kg soil), increasing with depth to a peak of 2400/kg soil in the 60–90 cm
layer (Figure 5). Fumigation resulted in 100% reduction in the population density of
P. thornei at all depths to 45 cm, 74% reduction in the 45–60 cm layer and 23% reduction in
the 60–90 cm layer (Figure 5).
Results for nematodes in the topsoil (0–15 cm) using DNA quantification were the
equivalent of 3500 ± 630 P. thornei/g soil, n = 15, with no P. neglectus or H. avenae de-
tected. There was a very low level of F. pseudograminearum with 7.0 ± 3.25 pico g DNA/g
soil, n = 15, in the nil-treated topsoil, and 1.3 ± 0.99 pico g DNA/g soil, n = 15, in the
fumigated topsoil.Agronomy 2021, 11, 867 12 of 28
Figure 5. Effects of fumigation with methyl bromide on population density of Pratylenchus thornei in
the soil profile before sowing Experiment 3. Points are the back-transformed values from means of ln
(x + 1) transformations (n = 15), where significant differences between transformed means for nil and
fumigated treatments at the respective depth intervals are indicated as * = p < 0.05 and *** = p < 0.001.
There was no significant difference between fumigated and nil-treated soil in the
distribution of soil water in the profile to 150 cm with both treatments having a volumetric
water content well above the crop lower limit (Figure 6a). The total quantity of plant-
available water in the whole soil profile (0–150 cm) of fumigated soil (124 ± 3.3 mm)
was very similar to nil-treated soil (117 ± 2.4 mm). There was no significant difference
between fumigated and nil-treated soil in the distribution of nitrate-nitrogen in the profile
(Figure 6b), or in the total quantity of nitrate-nitrogen in the soil profile (0–150 cm) between
fumigated soil (151 ± 13.4 kg NO3 –N/ha) and nil-treated soil (150 ± 12.5/ha).
Figure 6. (a) Volumetric water content (%), and (b) nitrate-nitrogen concentration (mg/kg) in the soil profile from fumigated
and nil treatments before sowing Experiment 3. There were highly significant differences due to soil depth for both soil
water and nitrate nitrogen, but not due to fumigation or interaction of fumigation and soil depth in ANOVA.
Chemical analysis of soil samples taken before sowing indicated that methyl bromide
fumigation resulted in a small increase in ammonium-nitrogen (Table 5). Phosphorus
and zinc concentrations were both 3 to 4 times greater in the 0–15 cm layer than in the
15–30 cm layer (Table 5). There was slightly less available phosphorus and slightly moreAgronomy 2021, 11, 867 13 of 28
available zinc in the fumigated than in the nil-treated soil at 15–30 cm. After incubation, the
ammonium-nitrogen in the untreated soil had increased, but not in the fumigated soil, and
the nitrate had decreased more so in the nil-treated soil than in the fumigated soil (Table 5).
After incubation, available phosphorus and zinc were slightly lower in fumigated soil than
in nil-treated soil, whereas there was no difference in soil pH.
Table 5. Effect of fumigation on soil chemical properties in Experiment 3, before and after incubation for 28 days. Values are
the means of n = 15, with SE in parentheses, n = 15.
NH4 –N NO3 –N a b c
Soil Depth (cm) Fumigation P (mg/kg Zn (mg/kg) pH
(mg/kg) (mg/kg)
Pre-incubation
nil 1.83 (0.65) 16.50 (0.78) 17.81 (1.55) 0.67 (0.06) 8.07 (0.05)
0–15
fumigated 2.90 (0.41) 1 16.80 (0.67) 17.86 (1.33) 0.80 (0.09) 8.19 (0.05)
15–30 nil 1.21 (0.92) 15.48 (0.52) 4.86 (0.40) 0.27 (0.04) 8.44 (0.04)
fumigated 2.80 (1.16) 12.80 (0.31) 3.90 (0.33) 0.23 (0.03) 8.61 (0.02)
Post-incubation
nil 8.24 (0.04) 5.70 (0.17) 14.91 (1.02) 0.76 (0.10) 8.11 (0.06)
0–15
fumigated 2.01 (0.02) 10.56 (0.17) 13.77 (0.93) 0.52 (0.06) 8.14 (0.06)
a b c
P (Colwell bicarbonate extraction [55]; Zn (DTPA extraction [56]; pH (1 soil: 5 water).
There was no significant difference in the number of plants/m2 at Z32 (stem elonga-
tion) due to either cultivar or fumigation in ANOVA with an overall mean of 69.0 plants/m2 .
There was a range of biomass production at Z32 among the nil-treated cultivars with a
two-fold increase from Banks to Wollaroi (Figure 7a). Soil fumigation resulted in in-
creased biomass of all cultivars, there being a significant fumigation x cultivar interaction
(Figure 7a). The percentage response to fumigation in biomass ranged from least for the
cultivar Hartog (35%) to greatest for QT10162 (119%). The nitrogen concentration of the
biomass (Figure 7b) differed significantly between cultivars, but differences due to fu-
migation were not significant. There were significant differences between cultivars in
phosphorus concentration of the biomass, and fumigation decreased phosphorus con-
centration with no interaction between fumigation and cultivars in ANOVA (Figure 7c).
Overall, fumigation increased zinc concentration of the biomass (Figure 7d). There were
significant differences between cultivars for zinc concentration, with no interaction between
fumigation and cultivar. QT9050 had the lowest zinc concentration while the durum wheat
Wollaroi had the highest.
Because the wheat in the fumigated plots was observed to have a slight bronzed
appearance and tip necrosis of the lower leaves, the dried plant material obtained at Z32
was analysed for bromide. There was a highly significant effect of fumigation on bromide
concentration with a mean value of 5284 mg Br/kg for wheat from the fumigated plots,
compared with 97 mg Br/kg from the nil plots. There were no significant cultivar or
fumigation x cultivar interaction effects in ANOVA of bromide concentration.
There was an exponential relationship between the percentage response to fumigation
of dry weight per plant and the percentage response to fumigation of plant P concentration
(Figure 8). This indicates that (1) cultivars that responded most negatively in P concentra-
tion to fumigation were those that responded least positively to fumigation in dry weight
per plant, and (2) cultivars that responded most positively in P concentration to fumigation
were those that responded most positively in dry matter to fumigation.Agronomy 2021, 11, 867 14 of 28
Figure 7. Response of wheat and durum cultivars at stem elongation (Z32) to soil fumigation with methyl bromide in
Experiment 3, (a) plant biomass, (b) N concentration, (c) P concentration and (d) Zn concentration. Bar markers represent
the l.s.d. for (a) fumigation x cultivar interaction, (b) cultivar main effect and (c,d) main effects of fumigation and cultivar.
(D) signifies a durum cultivar. Each graph is presented with nil-treated cultivars in ascending order of Y-axis value. Values
above bars are the percentage response to fumigation.
Figure 8. Relationship between percentage response to fumigation of plant dry matter at Z32 (stem elongation) and
percentage response to fumigation of phosphorus concentration in Experiment 3 of wheat and durum (D) cultivars.Agronomy 2021, 11, 867 15 of 28
There was a significant interaction between cultivars and soil fumigation in grain
yield (Figure 9). Without fumigation, grain yield ranged from 965 kg/ha for Banks up
to 2354 kg/ha for QT9050. The percentage response to soil fumigation ranged from 71%
for Banks down to 5% and 7% for Leichhardt and QT9050, respectively. No crown rot
browning of stem bases or whiteheads was evident in the crop. In multiple regression
analysis, both grain yield of the nil treatment, and percentage response to fumigation of
grain yield, were highly significantly related to the P. thornei tolerance index, but not to the
crown rot resistance index as shown in the following Equations.
Ynil = −182 + 702( PtTI ∗∗) − 9.3(CR n.s.), R2 = 0.56, p = 0.01, df = 9 (4)
Y%resp = 1.225 − 0.393( PtTI ∗ ∗ ∗) − 0.04(CR n.s.), R2 = 0.64, p = 0.004, df = 9 (5)
where Ynil = grain yield (kg/ha) from nil treatment; Y%resp = percentage response to soil
fumigation of grain yield; PtTI = the P. thornei tolerance index in t/ha; and CR = the crown
resistance index on ordinal scale of 1 to 9. Significance of coefficients indicated ** = p < 0.01,
*** = p < 0.001, n.s. = non-significant.
Figure 9. Grain yield of wheat and durum cultivars in response to soil fumigation with methyl bromide in Experiment
3. The graph is presented with cultivars in ascending order of grain yield from nil treatment. Bar marker represents l.s.d.
(p = 0.05) for fumigation x cultivar interaction. (D) signifies a durum wheat cultivar. Values above bars are the percentage
response to fumigation.
There was a highly significant relationship (p = 0.002), between percentage response
to fumigation of grain yield and percentage response to fumigation in phosphorus concen-
tration in the plant tissue at Z32 (Figure 10).Agronomy 2021, 11, 867 16 of 28
Figure 10. Relationship between response to fumigation of grain yield (kg/ha) and response to fumigation of phosphorus
concentration (%) in wheat plants at Z32 (stem elongation) in Experiment 3.
3.4. Experiment 4.
Soil from nil-treated plots before sowing Experiment 4 contained a high population
density of P. thornei with 7040/kg soil at 0–15 cm and a maximum population density of
12,690/kg soil at 15–30 cm (Figure 11a). The P. thornei population density then decreased
gradually with depth to 2130/kg soil at 90–120 cm. Fumigation significantly reduced the
P. thornei population density by 100% at 0–15 cm, 77% at 15–30 cm and 31% at 30–45 cm
(Figure 11a). A similar pattern of P. thornei population density in the soil profile, and the
effect of fumigation on it, was seen in the results for the DNA assay of P. thornei (Figure 11b).
The equivalent estimated population density by DNA assay was several fold greater than
that estimated from counting extracted live P. thornei. Mean crown rot DNA was 130 pico
g/g soil in the 0–15 cm layer (considered a medium risk for wheat and a high risk for
durum; RDTS pers. comm.) (Figure 11c). Fumigation reduced crown rot DNA to 33 pico
g/g (considered a low risk for wheat and medium risk for durum; RDTS pers. comm.).
There was no significant difference between fumigated and nil-treated soil in the
distribution of soil water in the soil profile (Figure 12a). Similarly, there was no significant
difference in plant-available water in the whole soil profile (0–150 cm) between fumigated
soil (200 ± 5.3 mm) and nil-treated soil (205 ± 5.3). The distribution of ammonium and
nitrate nitrogen in the soil profile is given in Figure 12b. There was significantly greater
ammonium nitrogen, but significantly less nitrate nitrogen in the fumigated soil than in
the nil-treated soil at 0–15 and 15–30 cm soil depths. There was no significant difference
deeper in the profile between fumigated and nil-treated soil. Over the whole soil profile,
there was somewhat less nitrate-nitrogen in the fumigated soil (199 ± 9.2 kg N/ha) than in
the nil-treated soil (225 ± 11.4 kg N/ha), but more ammonium nitrogen in the fumigated
soil (36.0 ± 4.0 kg N/ha) than in the nil-treated soil (26.0 ± 2.0 kgN/ha).
There were no significant differences between fumigated and nil-treated soil for avail-
able phosphorus and zinc or of pH (Table 6). There was a marked decrease in available
phosphorus and available zinc and an increase in soil pH from the 0–15 cm layer to the
15–30 cm layers (Table 6). After incubation, there was a small amount of ammonium-
nitrogen in the fumigated soil, but none in the untreated soil. Nitrate-nitrogen was con-
siderably higher after incubation than before incubation, but with no difference between
fumigated and nil-treated soil. There was no significant difference between fumigated and
nil-treated soil after incubation for available P or zinc, or for soil pH.Agronomy 2021, 11, 867 17 of 28
Figure 11. Effect of fumigation with methyl bromide on population densities of Pratylenchus thornei in the soil profile before
sowing Experiment 4, (a) P. thornei determined by extraction and counting microscopically, (b) P. thornei determined by DNA
quantification, and (c) Fusarium pseudograminearum determined by DNA quantification. Points are the back-transformed
values from means of ln(x+1) transformations (n = 15), where significant differences between transformed means for nil and
fumigated treatments at the respective depth interval are indicated as * = p < 0.05, *** = p < 0.001.
Figure 12. Effect of fumigation with methyl bromide on (a) volumetric water content and (b) mineral nitrogen (ammonium
and nitrate) in the soil profile before sowing Experiment 4. Points are the means (n = 15), where significant difference
between nil and fumigated treatments at the respective depth interval is represented as * = p < 0.05. There were no significant
effects of fumigation or of the interaction of fumigation and soil depth for volumetric water content in ANOVA.Agronomy 2021, 11, 867 18 of 28
Table 6. Effect of fumigation on soil chemical properties in Experiment 4, before and after incubation for 28 days. Values are
the means of n = 15, with SE in parentheses, n = 15.
NH4 –N NO3 –N a b c
Soil Depth (cm) Fumigation P (mg/kg Zn (mg/kg) pH
(mg/kg) (mg/kg)
Pre-incubation
nil 1.28 (0.18) 6.11 (0.97) 24.48 (1.55) 1.26 (0.25) 7.61 (0.07)
0–15
fumigated 4.11 (0.83) 1 3.58 (0.91) 24.30 (1.33) 1.12 (0.14) 7.65 (0.07)
15–30 nil 1.01 (0.00) 8.13 (0.90) 6.48 (0.22) 0.25 (0.05) 8.43 (0.05)
fumigated 2.03 (0.33) 5.02 (0.92) 3.90 (0.33) 0.23 (0.03) 8.47 (0.04)
Post-incubation
nil 0 (0) 20.5 (1.37) 24.62 (1.55) 1.39 (0.25) 7.58 (0.07)
0–15
fumigated 1.3 (0.8) 21.2 (1.54) 24.26 (1.38) 1.39 (0.22) 7.60 (0.07)
a P (Colwell bicarbonate extraction [55]; b Zn (DTPA extraction [56]; c pH (1 soil: 5 water).
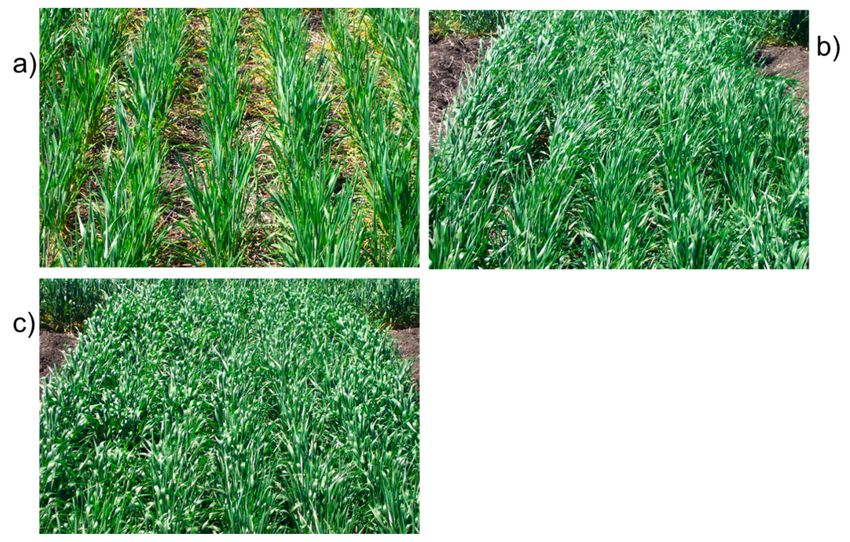
There were substantial differences in the appearance of the plants at late stem elonga-
tion (Z35) in Experiment 4 as shown in Figure 13. Some cultivars showed symptoms of the
consequences of P. thornei damage to the roots of chlorotic lower leaves, upright appearance
of leaves as though drought stressed, with poor canopy closure (e.g., Figure 13a image of
cv. Janz in nil-treated soil,). Soil fumigation decreased these symptoms (e.g., Figure 13b,
image of cv. Janz in fumigated soil). Other cultivars did not have these symptoms (e.g.,
Figure 13c, image of wheat line QT9050 in nil-treated soil).
Figure 13. Appearance of wheat plots at Z35 late stem elongation (a) P. thornei-susceptible cv. Janz soil showing symptoms
of lower leaf yellowing, poor canopy closure and low biomass, (b) cv. Janz growing on fumigated soil showing reduced,
and (c) QT9050, a wheat line moderately resistant to P. thornei, showing no symptoms.
Ratings of cultivars at late stem elongation(Z35) growing in untreated soil ranged from
2.2 for wheat cv. Strzelecki to 5.8 for barley cv. Binalong (Figure 14a). Other wheat cultivarsAgronomy 2021, 11, 867 19 of 28
with relatively low ratings indicating poor growth were Banks, Petrie, Hume, and Janz,
while cultivars with relatively high ratings indicating good growth were QT9050, Baxter,
Leichhardt and Hartog. Percentage responses in growth rating to fumigation ranged from
zero for Binalong to 44% for Cunningham. There was a general trend that cultivars that
had the lowest growth rating with nil treatment had the highest percentage response to
soil fumigation (Figure 14a). Biomass at anthesis of the cultivars grown on untreated plots
ranged from 2655 kg/ha for Strzelecki to 8445 kg/ha for Binalong (Figure 14b). Other
cultivars with low biomass production were Strzelecki, Petrie, Hume, Banks, Lang and
Janz, while other cultivars with high biomass production were the durum cv. Kamilaroi,
and wheat cultivars Leichhardt, Baxter, Sunvale and QT9050. Generally, cultivars with
low biomass production in the untreated soil had the highest percentage response to soil
fumigation, while the cultivars with the high biomass production had little or even negative
responses to soil fumigation.
The cereal cultivars had a wide range of percentage whiteheads from 0% for barley cv.
Binalong to 90.0% for the durum cv. Wollaroi (Figure 15a). The two other durum cultivars,
Kamilaroi and Bellaroi, had the next highest with 75.2 and 70.5% whiteheads, respectively.
The wheat cultivars ranged from 5.0% whiteheads for Sunco to 50.0% for Kennedy. Grain
yield ranged from 1120 kg/ha for durum cv. Wollaroi to 3400 kg/ha for barley cv. Binalong
(Figure 15b). Other cultivars with low grain yield were Wollaroi (durum), Strzelecki, Banks,
Hume, Kamilaroi (durum), and Petrie. Others with high grain yield were wheat cultivars
Sunvale, Baxter, QT9050, Chara and Giles. Generally, cultivars with low yield for nil
treatment had high percentage response to soil fumigation, while cultivars with high yield
with nil treatment had low or even negative response to soil fumigation.
Biomass and growth rating were strongly correlated with each other and both were
correlated with grain yield (Table 7). The percentage of whiteheads was not correlated with
either biomass or growth rating, but was strongly negatively correlated with grain yield.
The following equations were obtained from multiple regression analysis relating
√
yield to both growth rating and percentage whiteheads (arcsine % transformations), or to
both biomass and percentage whiteheads:
Y = 1046 + 327.5(GR ∗ ∗∗) − 35.95(WH ∗ ∗∗), R2 = 0.832, p < 0.001, df = 37 (6)
Y = 1812 + 0.2643(Biom ∗ ∗∗) − 30.76(WH ∗ ∗∗), R2 = 0.827, p < 0.001, df = 37 (7)
Y = 1373 + 511.1(GR ∗ ∗∗) − 34.30(WH ∗ ∗∗), R2 = 0.80, p < 0.001, df = 29 (8)
Y = 1729 + 0.3259(Biom ∗ ∗∗) − 38.01(WH ∗ ∗∗), R2 = 0.827, p < 0.001, df = 29 (9)
where Y = grain yield (kg/ha), GR = growth rating (1 to 6), Biom = biomass (kg/ha), and
√
WH = arcsine % whiteheads. Equations (6) and (7) are for 20 cereal cultivars on both
nil-treated and fumigated soil. Equations (8) and (9) are for only the 16 wheat cultivars on
both nil-treated and fumigated soil. Significance of coefficients indicated: *** p < 0.001.
When all cereal cultivars were included in the multiple regression, grain yield was
highly significantly related (p < 0.001) to both growth rating (GR) and to percentage white-
heads in the crop (WH), the former having a positive coefficient and the latter a negative
coefficient (Equation (6)). Similarly, when all cereal cultivars were included in the multiple
regression, grain yield was highly significantly related (p < 0.001) to both biomass at anthe-
sis (Biom) and to percentage whiteheads in the crop (WH), the former having a positive
coefficient and the latter a negative coefficient (Equation (7)). When only wheat cultivars
were included in the multiple regression, grain yield was still highly significantly related
(p < 0.001) to both growth rating (GR) and to percentage whiteheads in the crop (WH),
the former having a positive coefficient and the latter a negative coefficient (Equation (8)).
Similarly, when only wheat cultivars were included in the multiple regression, grain yield
was highly significantly related (p < 0.001) to both biomass at anthesis (Biom) and to per-
centage whiteheads in the crop (WH), the former having a positive coefficient and the latter
a negative coefficient (Equation (9)).Agronomy 2021, 11, 867 20 of 28
Figure 14. Response of wheat, durum (D) and barley (B) cultivars to soil fumigation with methyl bromide (a) growth rating
at stem elongation and (b) biomass at anthesis. Each graph is presented with cultivars in ascending order of values for nil
treatment. Bar markers represent the l.s.d. for (a) main effects for fumigation and cultivar, and (b) fumigation x cultivar
interaction from ANOVA. Values above bars are percentage response to fumigation.Agronomy 2021, 11, 867 21 of 28
Figure 15. Response of wheat, durum (D,) and barley (B) cultivars to soil fumigation with methyl bromide, (a) whiteheads
√
(arcsine %), and (b) grain yield. Graph (a) is presented in descending order and graph (b) in ascending order, respectively
of values for nil-treated cultivars. Bar markers represent the l.s.d. (a) main effect of cultivar, and (b) main effects of
fumigation and cultivar from ANOVA. Values above bars are percentage response to fumigation.
Table 7. Correlation matrix between measures of plant growth of all cultivars growing on either
nil-treated or fumigated soil (n = 40).
Growth Rating Biomass Whiteheads
Biomass 0.937 ***
Whiteheads −0.051 n.s. −0.031 n.s.
Grain yield 0.580 *** 0.561 *** −0.739
√ correlation coefficient significant at p < 0.001, n.s. = non-significant. Whiteheads transformed by
*** signifies
arcsine %.Agronomy 2021, 11, 867 22 of 28
The following equations were obtained from multiple regression analysis relating
yield with nil treatment, or percentage yield response from fumigation, to both the P. thornei
tolerance index and the crown rot resistance index:
Ynil = −935 + 707( PtTI ∗∗) + 368.6(CR ∗ ∗∗), R2 = 0.616, p < 0.001, df = 16 (10)
Y%resp = 70.2 − 8.69( PtTI n.s.) − 9.43(CR ∗ ∗∗), R2 = 0.535, p < 0.001, df = 16 (11)
2
Ynil = −877 + 1039( PtTI ∗ ∗ ∗) + 159.8(CR∗), R = 0.819, p < 0.001, df = 13 (12)
Y%resp = 72.9 − 13.01( PtTI ∗) − 7.58(CR∗), R2 = 0.512, p = 0.004, df = 13 (13)
where Ynil = grain yield (kg/ha) from nil treatment, Y%resp = percentage response in grain
yield to soil fumigation, PtTI = the P. thornei tolerance index in t/ha [22] and CR = the crown
resistance index ordinal scale of 1 to 9 [38]. Equations (10) and (11) are for 19 cultivars
(16 wheat and three durum); Equations (12) and (13) are for 16 wheat cultivars. Significance
of coefficients indicated: * p < 0.05, ** p < 0.01, *** p < 0.001.
When both wheat and durum cultivars were included in the multiple regression,
yield from the nil-treated soil was highly significantly related both positively to crown rot
resistance rating (p < 0.001) and to the P. thornei tolerance index (p = 0.003) (Equation (10)).
The percentage response to fumigation was significantly negatively related to the crown rot
resistance index (p < 0.05), but not to the P. thornei tolerance index, when wheat and durum
were considered together (Equation (11)). When only wheat cultivars were analysed, their
yield in the nil-treated soil was highly significantly (p < 0.001) related to the P. thornei
tolerance index, and significantly (p < 0.05) related to the crown rot resistance index
(Equation (12)). The percentage response of the wheat cultivars was significantly (p < 0.05)
negatively related to both the P. thornei tolerance index and the crown rot resistance rating
(Equation (13)).
4. Discussion
Wheat is the prime host of Pratylenchus thornei and much financial loss has been
suffered by wheat growers in the subtropical grain region of eastern Australia from this
nematode. Despite the change in this region to conservation agriculture, and the many
benefits that it provides compared with traditional agronomic practices, conservation
farmers must pay close attention to the management of plant pathogens. Our results
show that P. thornei can cause major loss in yield of many wheat cultivars in a commercial
farming system that utilizes best management practices for conservation agriculture. The
results of Experiments 1 and 2 show the difficulty in managing P. thornei, where wheat
was grown after the grain legume black gram (Vigna mungo (L.) Hepper). This pulse crop,
along with the closely related host crop mung bean (Vigna radiata (L.) R. Wilczek), should
be beneficial summer crops in rotations with wheat, but are not so in P. thornei-infested
fields. These results showed that the final population density of P. thornei in the soil profile
associated with the various wheat cultivars was a strong explanatory variable of their
grain yield, indicating that P. thornei was the major cause of the wide range of yield of
the wheat cultivars in these experiments. Susceptible to very susceptible cultivars, which
produced high population densities of P. thornei and suffered substantial yield loss in these
experiments, were Strzelecki, Petrie, Banks, QT8368, Batavia, Cunningham, Babbler, and
Sunco. Cultivars with this level of susceptibility and intolerance should be avoided in
fields that are infested with P. thornei. By contrast, cultivars such as QT8447, QT8620 and
QT9050, which have moderate resistance to P. thornei derived from the resistant selection
GS50a [25], produced much lower population densities of P. thornei and higher grain yield
in Experiments 1 and 2. Other cultivars with relatively lower final population densities of
P. thornei and higher grain yields were Sunvale, Baxter, Gregory, Giles, Chara, Leichhardt
and Glover. Cultivars with at least this level of tolerance should be chosen for sowing
in fields that contain P. thornei. An additional cultivar that exhibited better tolerance to
P. thornei based on grain yield in Experiment 3 was QT10162, a reselection from Baxter.You can also read