Electricity Markets, Reliability and the Evolving U.S. Power System - Analysis Group
←
→
Page content transcription
If your browser does not render page correctly, please read the page content below
Electricity Markets, Reliability and
the Evolving U.S. Power System

Analysis Group
Paul Hibbard
Susan Tierney
Katherine Franklin

June 2017
Markets, Reliability and the Evolving U.S. Power System

Acknowledgments

This report reviews the causes of a changing electricity resource mix in the U.S., and the impact
of those changes on electric power system reliability. It is important to view the evolving mix of
technologies, market incentives and policy goals in the electric industry against the long-
standing framework of federal, regional, state and utility requirements and procedures to
ensure the maintenance of a reliable and secure power grid at all times.

This is an independent report by the authors at the Analysis Group, supported with funding
from the Advanced Energy Economy Institute and the American Wind Energy Association.
The authors wish to thank Ellery Berk, Benjamin Dalzell, Jacob Silver, and Grace Howland of
Analysis Group for their assistance in the analysis and development of the report.

The report, however, reflects the judgment of the authors only.

About Analysis Group

Analysis Group provides economic, financial, and business strategy consulting to leading law
firms, corporations, and government agencies. The firm has more than 700 professionals, with
offices in Boston, Chicago, Dallas, Denver, Los Angeles, Menlo Park, New York, San Francisco,
Washington, D.C., Montreal, and Beijing.

Analysis Group’s energy and environment practice area is distinguished by expertise in
economics, finance, market modeling and analysis, regulatory issues, and public policy, as well
as significant experience in environmental economics and energy infrastructure development.
The practice has worked for a wide variety of clients including: energy producers, suppliers and
consumers; utilities; regulatory commissions and other public agencies; tribal governments;
power system operators; foundations; financial institutions; and start-up companies, among
others.

 Analysis Group
Markets, Reliability and the Evolving U.S. Power System

                                            Table of Contents

I.     Executive Summary                                                                            2

II. Introduction and Overview                                                                       6

III. The Economics of Electricity Supply and Demand, and the Role of Policy and Consumer
     Preferences                                                                                    8

       Power Plant Profitability: Industry Structure, Market Design and Competition                 8

       The Role of State and Federal Policies and Consumer Preferences in Shaping the Generation Mix13

IV. How the Resource Mix Has Changed Over Time Due to Market and Policy Factors                    20

       The Drivers of Changes in the Resource Mix                                                  23

       The Impact on Wholesale Electricity Prices                                                  38

V. Power System Reliability                                                                        40

       Overview                                                                                    40

       Reliability Factors                                                                         42

VI. The Impact of Resource Mix Changes on Power System Reliability                                 48

VII. Observations and Conclusions                                                                  62

APPENDIX A: Reliability of the Bulk Power System                                                   65

       Overview                                                                                    65

       Reliability Entities                                                                        66

       Planning for and Response to Disruptive Changes or Events                                   71

APPENDIX B: Recent Reliability Studies                                                             76

     Analysis Group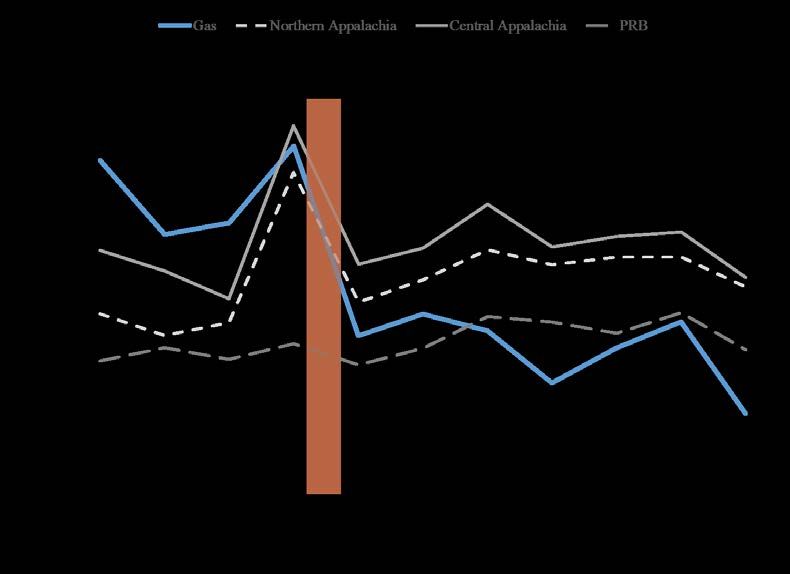
Markets, Reliability and the Evolving U.S. Power System

    I.                Executive Summary
          It is a common occurrence for the issue of reliability to be raised when market, technology or
policy changes are affecting the financial outlook of different segments of the electric industry. This
phenomenon has occurred several times over the past two decades, as the prospect of new industry
and market structures, technological advancement, air pollution controls and customer-driven changes
stood to alter the operations and economics of various types of power plants on the electric system.
Sometimes these warnings spring from genuine concerns, such as the need to address the localized
reliability impacts of potential plant closures; other times they reflect a first line of defense by
opponents of the changes underway in the industry.

        Recently, some have raised concerns that current electric market conditions may be
undermining the financial viability of certain conventional power plant technologies (like existing coal
and nuclear units) and thus jeopardizing electric system reliability. In addition, some have suggested
that federal and state policies supporting renewable energy are the primary cause of the decline in
financial viability. The evidence does not support either hypothesis.

       There is little doubt that the transition under way in the industry will lead to a power system
resource mix and consumption patterns quite different from the ones to which the industry has grown
accustomed in recent decades. The ongoing diversification of generation supply (See Figure 1) has
lowered wholesale electricity costs in most parts of the U.S. and has contributed to recent declines in
consumers’ overall cost of living.

                                                             Figure 1
                                   Shares of Total U.S. Net Generation by Fuel: 2005 vs. 2016
                      Oil Wind Solar Other                                                       Solar   Other
                      1% 0% 0% 3%                                                   Oil           1%      2%
                                                                                    0%
                                                                                              Wind
                           Water                                                              6%
                            7%                                                  Water
                                                                                 6%                              Coal
                                                                                                                 31%

    Nuclear                                             Coal
     19%                                                47%
                                                                  Nuclear
                                                                   21%

                             Gas
                             22%                                                                         Gas
         Source: SNL Financial.                                     S ource: SNL Financial.              33%

 Analysis Group                                                                                                         2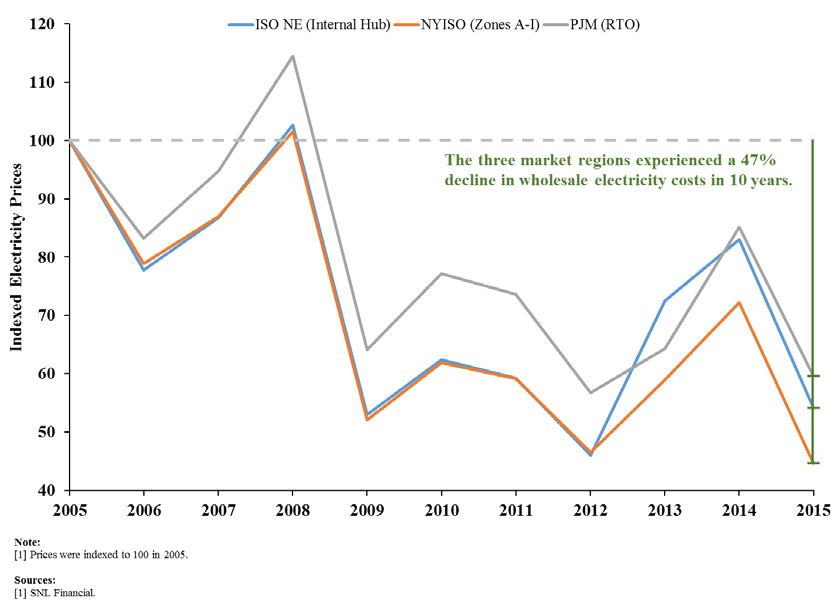
Markets, Reliability and the Evolving U.S. Power System
Yet the nature and pace of change have raised two fundamental questions in public debates
among electric industry participants, regulators, stakeholders and practitioners:
First, what exactly are the primary drivers of the transition underway in the electric industry?
Second, are the changes impacting the mix of generating resources in a way that could
undermine power system reliability?
In this Report we evaluate both questions. Based on our review, we arrive at the following
observations and conclusions:
1. Market Forces are Driving the Change in the Generation Mix, to the Benefit of Consumers
Fundamental market forces -- the addition of highly efficient new gas-fired resources, low
natural gas prices, and flat demand for electricity -- are primarily responsible for altering the
profitability of many older merchant generating assets in the parts of the country with
wholesale competitive markets administered by Regional Transmission Organizations (RTOs). As
a result, some of these resources (mostly coal- and natural gas-fired generating units, but also
many oil-fired power plants and a handful of nuclear power plants) have retired from the system
or announced that they will do so at a future date.
Other factors -- such as rapid growth in newer energy technologies (whose costs have declined
significantly in recent years), and state policies and consumers’ actions that support such
technologies -- also contribute to reducing the profitability of less economic assets. These are,
however, a distant second to market fundamentals in causing financial pressure on merchant
plants without long-term power contracts. In the PJM regional market, which accounts for a
large share of the nation’s coal plant retirements, decreases in natural gas prices have had a
much larger impact on the profitability of conventional generators than the growth of
renewable energy, as illustrated in Figure 2.
Analysis Group 3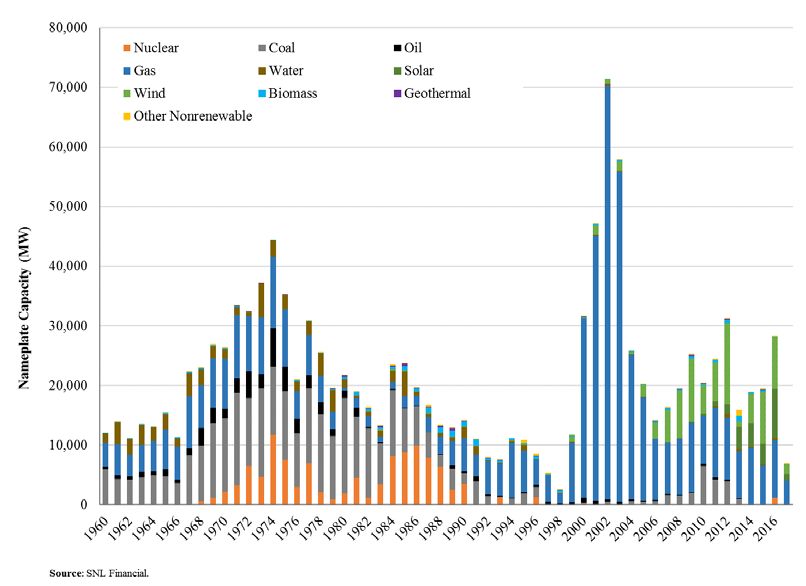
Markets, Reliability and the Evolving U.S. Power System
Figure 2:
Relative Incremental Impact of Three Factors on Prices per MWh in PJM’s Wholesale Energy Market:
Illustrative Impacts of Changes in Natural Gas Prices, Electricity Demand and Entry of Wind Resources 1
5 GW Wind Addition Decrease in load Decrease in Gas Prices
$0.00
-$5.00
-$10.00
$/MWh
-$15.00
-$20.00
-$25.00
-$30.00
Note: Impact of wind addition demonstrates impact of adding 5 GW of wind to all of PJM on marginal electricity price for all of PJM. Decrease in gas price
shown between 2005-2008 and 2009-2015 periods in PJM East.
Source: SNL Financial.
The retirement of aging resources is a natural element of efficient and competitive market
forces, and where markets are performing well, these retirements mainly represent the efficient
exit of uncompetitive assets, resulting in long-run consumer benefits.
1
To illustrate the relative impacts of changes in three types of factors (i.e., natural gas prices, the addition of
renewable capacity, and declines in demand for power) on wholesale electric energy market prices paid to a
merchant generator, we estimated the change in clearing prices in PJM in 2015 as follows: (A) To gauge the effect
of lower natural gas prices on energy market prices, we calculated the dollar/MWh price of output at a marginal
gas-fired generating unit first by using the average natural gas price in the 2005-2008 period and then by using the
average gas price in the 2009-2015 period. (B) We then calculated the effect of introducing 5,000 MW of wind
capacity into the PJM system by first looking at the actual dollar/MWh price at average load levels in 2015 and
then calculated what that price would have been if the supply curve had shifted with the addition of 5,000 MW of
inframarginal wind capacity. (C) We then calculated the effect of reduced load (e.g., from the demand-reducing
effects of the economic recession and/or increased investments in energy efficiency) by comparing the actual
wholesale energy price at average PJM load levels with what that price would have been had demand growth
between 2005-2007 continued through 2015.
Analysis Group 4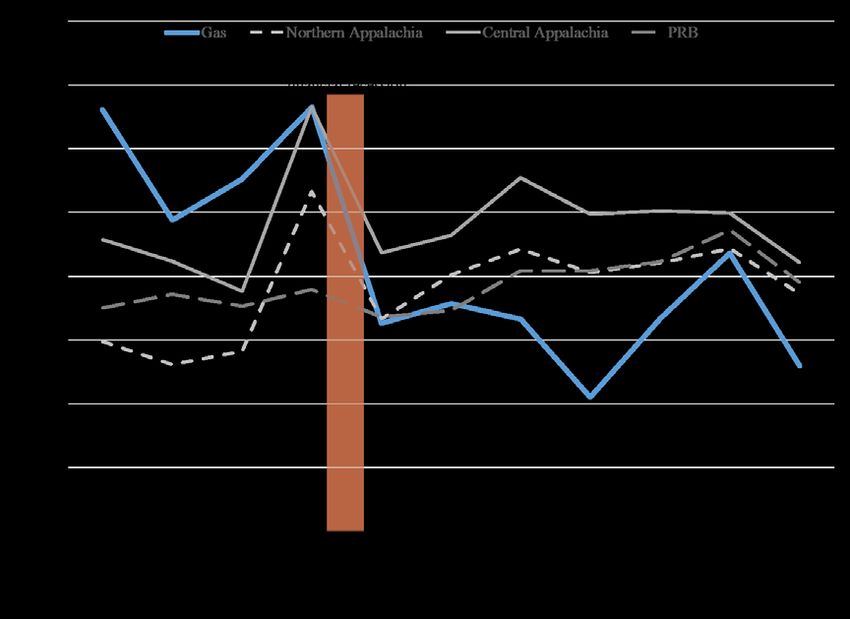
Markets, Reliability and the Evolving U.S. Power System
2. The Transition Underway in the Electric Resource Mix is Not Harming Reliability
Although some commentators have raised concerns that the declining financial viability of
certain conventional power plant technologies (like coal and nuclear power plants) that operate
as merchant units in several wholesale electricity markets may be jeopardizing electric system
reliability, there is no evidence supporting that conclusion. In fact, a recent reliability review by
the National Electric Reliability Council (NERC) -- the nation’s designated reliability organization -
- shows that the changes in regional wholesale markets are not leading to lower bulk-power-
system reliability metrics.
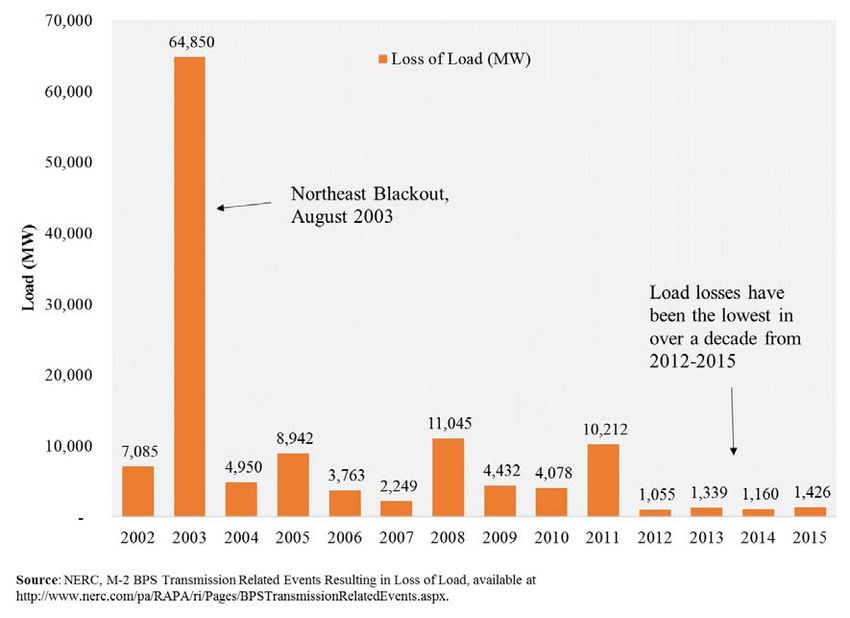
Many advanced energy technologies can and do provide reliability benefits by increasing the
diversity of the system. The addition of newer, more technologically advanced and more
efficient natural gas and renewable technologies is rendering the power systems in this country
more, rather than less, diverse. These newer generating resources are also contributing to the
varied reliability services -- such frequency and voltage management, ramping and load-
following capabilities, provision of contingency and replacement reserves, black start capability,
and sufficient electricity output to meet demand at all times -- that electric grids require to
provide electric service to consumers on an around-the-clock basis. As a result, increasing
quantities of natural gas and renewable generation are increasing the diversity of the power
system and supporting continued reliable operations.
Analysis Group 5
Markets, Reliability and the Evolving U.S. Power System

    II.     Introduction and Overview
         A common occurrence in the electric industry is for observers to raise reliability concerns when
policy changes -- combined with technology or market trends -- are affecting or may affect the financial
outlook for different segments of the electric industry. This phenomenon has occurred several times
over the past two decades. Such concerns about electric system reliability were voiced in the mid-
1990s, for example, when changes in efficient co-generation technologies, combined with high rates in
certain states, led large industrial customers to call for retail choice and many states to begin to
restructure the industry. Such concerns were raised when the Environmental Protection Agency (EPA)
and the states began to implement Title IV of the Clean Air Act, which controlled sulfur dioxide
emissions from power plants. More recent examples include the debates over reliability impacts in the
period leading up to EPA’s adoption of the Cross-State Air Pollution Rule, the Mercury and Air Toxics
Standard (MATS) and the Clean Power Plan, all of which would have affected air emissions from various
fossil-fuel power plants.

          The maintenance of power system reliability is a fundamental necessity for the protection of
public safety, health and welfare, as well as to support the nation's economy and standard of living.
Expressions of concern over power system reliability are thus common whenever there is major change
underway or anticipated in the industry. Sometimes the warnings spring from genuine concerns, such
as the need to address localized reliability impacts of potential plant closures; other times they reflect a
first line of defense by opponents of the changes underway in the industry, or those potentially
adversely affected.

         There are many sound reasons why policy and/or market changes rarely, if ever, actually end up
adversely affecting electric system reliability. A vast network of entities and organizations, and a robust
set of reliability laws, rules, practices, and procedures, ensures this outcome. Nevertheless, these
discussions play an important role in focusing the attention of the industry on taking the steps necessary
to continue to ensure reliable electric service to Americans.

         Over the past decade, the electric industry has witnessed significant transitions. The changes
result from a combination of forces: dramatic increases in the production of domestic natural gas and
the resulting decreases in the price of natural gas; displacement of coal-fired generation with output at
gas-fired power plants that had previously been underutilized; flat demand for electricity; continued
improvements in the efficiency, capabilities, and costs of new gas-fired generating technologies and of
both grid-connected and distributed solar and wind generation; widespread and growing adoption of
small-scale, decentralized generating technologies on customers’ premises; requirements that coal
plants without adequate controls on mercury and other toxic pollutants adopt modern equipment; and
other forces. These changes have lowered wholesale electricity costs in most parts of the U.S., and have
contributed to recent declines in consumers’ overall cost of living.

         These changes challenge the economics of older fossil-fuel and nuclear power plants in many
parts of the country and are driving a steady transition in the nation's resource mix towards more gas-

 Analysis Group                                                                                          6
Markets, Reliability and the Evolving U.S. Power System
fired and renewable resources. This raises two fundamental questions that have found their way into
the discourse among electric industry participants, regulators, stakeholders, and practitioners:
First, what exactly are the primary drivers of the transition underway in the industry?
Second, are the changes impacting the mix of generating resources in a way that could
undermine power system reliability?
This Report attempts to answer both questions. Regarding the first question, we review the
fundamental economic and policy factors that affect the profitability of various types of generating
sources competing in today's electricity markets. Further, we show how various factors -- changing fuel
costs, demand for electricity and various policies -- have influenced the evolving resource mix in various
regions. This analysis is presented in Sections III and IV.
Next, we review the evolving resource mix through the lens of power system reliability. This
section evaluates the specific contributions of various technologies -- dispatchable and non-dispatchable
power plants offering slow-ramping and quick-ramping capabilities, and so forth -- to providing the
essential reliability services needed to keep the lights on. We evaluate whether the overall mix of
resources resulting from economic and regulatory drivers may somehow degrade power system
reliability. This review is presented in Sections V and VI.
Finally, in Section VII we present our observations based on the analysis.
Analysis Group 7Markets, Reliability and the Evolving U.S. Power System
III. The Economics of Electricity Supply and Demand, and the Role
of Policy and Consumer Preferences
Power Plant Profitability: Industry Structure, Market Design and Competition
Across the regions of the U.S., companies that own power plants face different market
conditions. Notably, those in the organized wholesale markets compete for the opportunity to sell
energy, capacity, and ancillary services provided by their power plants. Power plant owners incur costs
for fuel, operations and maintenance; they make plant investments as needed to keep plants in service;
and they may be able to earn profits through retail sales (when a utility’s power plants’ costs are
covered directly in retail rates) or though wholesale sales under bilateral agreements and competitive
market transactions. 2
In fact, a key factor currently affecting a power plant's ability to earn profits in different states is
whether the plant’s investment costs are included in a regulated utility’s “rate base,” covered in a long-
term power purchase contract, or recovered through some combination of sales into energy, capacity
and/or ancillary service products in organized wholesale markets administered by Regional Transmission
Organizations (RTOs). 3 Rate-based power plants -- whether they are coal-fired generators, nuclear units,
gas-fired units, or renewable projects -- typically do not immediately face the same financial pressures
affecting merchant power plants located in certain regions served by RTOs. Similarly, the profits of
many power plants with long-term sales agreements may be covered -- or at least buffered to a
significant degree -- by terms and conditions in those contracts.
For power plants that are not included in a utility's rate base or under long-term power sales
agreements, the owners’ profits are greatly affected by fundamental market conditions in those RTO
markets and by their ability to provide services that have been valued in those RTOs’ market designs.
Although roughly two thirds 4 of the U.S. population resides in an area with an organized market RTO
(see Figure 3), the market designs in these RTO regions vary, in part because of the underlying
differences in electric industry structure and regulation in the states that participate in the RTOs.
2
Our discussion of market drivers evaluates the drivers of power plant profitability primarily through the lens of
competitive wholesale market operations, in part because the nation's competitive markets tend to be the places
where competition and changing economic factors are driving significant attrition of existing generating capacity.
However, in some ways the discussion is analogous to vertically-integrated companies and regions, as decisions
regarding investment, operation, and retirement of utility-owned generation or power purchase contracts are
based on the same underlying drivers of fuel prices, operational costs, investment costs and risks, electricity
demand, and regulatory policy.
3
Under the Federal Power Act, FERC has authority to regulate sales for resale and the terms and condition of sales
in interstate commerce and as such, these RTOs (with one exception) fall under the jurisdiction of the Federal
Energy Regulatory Commission (FERC). The one exception is the RTO (ERCOT) that serves most of Texas, because
that portion of Texas is electrically isolated from the power systems in other states.
4
ISO/RTO Council, "IRC History," available at http://www.isorto.org/about/irchistory.
Analysis Group 8Markets, Reliability and the Evolving U.S. Power System
Figure 3: Regional Transmission Organizations 5
Many states in some RTO regions - e.g., California’s CAISO region and those in the Plains and
Central parts of the U.S. (served by the Southwest Power Pool (SPP) and the Midcontinent ISO (MISO)) -
have retained a traditional utility-industry structure and permit their utilities to own power projects
and/or contract for power with third parties for resale to end-use customers. The profits of power
plants located in CAISO, MISO and SPP are thus strongly affected by state policy and regulation (in
addition to circumstances in which federal policy - e.g., air pollution regulations - affects the cost profile
and economic viability of individual generating units). In Iowa, for example, there are state ratemaking
incentives for utility investment in new wind facilities, on top of federal tax incentives for such
investment. 6 California has other incentives that favor investment in solar capacity. 7 Other vertically
integrated states in the Central U.S. and Western RTOs require that their states rely on integrated-
resource planning and competitive power procurements that have also led to increased investment in
new gas-fired generating capacity and renewable energy projects. 8
By contrast, in the other four RTO regions (Texas’ ERCOT, the Midwest/Mid-Atlantic states’ PJM,
New York’s NYISO, and New England’s ISO-NE), there are many merchant power plants (and other
resources) owned and operated by non-utility companies. In these RTOs, the owners' resources rely on
a combination of products in wholesale markets to determine which assets are dispatched and paid to
5
Figure source: FERC website, available at available at https://www.ferc.gov/industries/electric/indus-act/rto.asp.
6
For Iowa’s support for wind investment, see Letter RE: EPA Regulation of Carbon Dioxide Emissions from Existing
Power Plants, Iowa Utilities Board, December 6, 2013.
7
For California’s support of solar and other renewable investment, see “California Renewable Energy Overview
and Programs,” California Energy Commission, available at http://www.energy.ca.gov/renewables/.
8
Minnesota and Colorado are examples of vertically integrated states that have experienced growth in natural gas
and/or renewables, see EIA, “Minnesota: Profile Analysis,” April 20, 2017, available at
https://www.eia.gov/state/analysis.php?sid=MN; also see EIA “Colorado: Profile Analysis,” December 15, 2016,
available at https://www.eia.gov/state/analysis.php?sid=CO.
Analysis Group 9Markets, Reliability and the Evolving U.S. Power System
provide power in any hour or seasonally/annually (e.g., through energy- or capacity-market payments).
These power markets provide the compensation mechanisms that in turn shape the profits of these
power plant owners.
In the latter context, the economics of operating existing merchant power plants are
continuously affected by the underlying forces of electricity supply, demand and wholesale prices in
those regional markets. 9 The level of revenues they earn is closely tied to the level of total electricity
demand and the mix of competing generating resources over time. The level of electricity demand is
strongly affected by the overall level of activity and growth in the general economy, and has also
changed as a function of technological change in the industry. 10 The reduction in demand due to
economic and technological factors has affected the total revenues earned by existing power plants in
the market.
Power plant profitability is also affected by the cost of inputs to power production that must be
subtracted from revenues earned in the market – namely, the cost to procure and transport the fuel
(e.g., coal, natural gas, uranium, oil, biomass) to generate electricity; variable costs associated with
operating and maintaining the power plant; the fixed costs, such as salaries, property taxes, insurance,
plant security, and other regular expenditures needed to maintain the plant in safe and good-working
order each year; and the annualized cost associated with capital investments needed to keep the power
plant running, upgrade its capability, or to comply with new safety or environmental laws and
regulations. Even if a power plant’s revenues do not change from one year to the next, its underlying
costs (and thus its overall profit levels) may vary.
Changes in these underlying costs affect revenues, in turn, by shaping the offer prices at which
competitive power suppliers are willing to produce power. If a gas-fired power plant can obtain gas at a
price today lower than the month or year before, that project’s offer price will be lower than it was at
previous times. This could cause a plant to be selected for output in an RTO energy market today,
whereas it was too expensive to be dispatched in a prior year. Conversely, a coal-fired power plant
whose fuel costs may not have changed over that period of time could end up finding itself out of the
dispatch at present - and without the receipt of revenues in the energy market. As a result of such
changes, the lower gas prices would not only shift the sequence in which power plants are dispatched to
produce power, but also lower wholesale market prices to all power plants in that energy market and
render some power plants no longer economic to run very often (or at all).
Power plant owners continuously evaluate the current and future economics of power plant
operations – that is, the revenue and cost factors described above, including the economic and
regulatory risks that are inherent to the power generation sector as a normal course of doing business –
9
FERC, "Energy Primer: A Handbook of Energy Market Basics," November 2015, p. 35.
10
For example, the growth of more efficient end-use technologies – such as increased efficiency of light bulbs and
home appliances – can significantly moderate the level of growth in total electricity demand. Similarly, dramatic
cost reductions in distributed generation technologies, such as rooftop solar photovoltaics, combined with state
regulatory incentives for the adoption of such projects, can lead to significant reductions in the demand for energy
from central-station power plants.
Analysis Group 10Markets, Reliability and the Evolving U.S. Power System
to make decisions regarding whether to invest in plant upgrades, invest in new generating technology,
or even whether to continue operating plants beyond a particular point in time. Further, those that own
multiple power plants may make such decisions across a fleet of investment options and determine
where to invest limited capital among their portfolio of generating assets and even whether to remain in
the business of generating electricity from merchant power plants. In some circumstances, owners of
plants with low profitability may decide to retire them in order to remove the dampening effect of units
on the company's stock price. 11
Over time, the mix of power plants in a system reflects these various economic and financial
pressures. As power plants age, they become more costly to operate and maintain, while technological
change often leads to the development of replacement technologies that are more efficient, more
reliable, lower emitting, and/or lower cost.
These market pressures are also affected by two factors that affect individual power plants’
potential (or actual) profitability. First, each wholesale RTO market has its own market design details
which affect revenue potential for different types of power plants. 12 Second, the provisions of state and
federal public policies allow for compensating some technologies but not others (as explained further
below). Together, market design and public policies end up compensating some power plant owners for
some of the positive attributes of their assets (e.g., their electrical capacity and energy production, their
renewable energy output, and/or their ability to ramp their power up or down relatively quickly), but fail
to properly price certain negative attributes (e.g., air, water, and solid waste environmental
externalities) or conversely, to compensate a power plant for its ability to produce electricity without
externalities. These market-design conditions and public policies affect merchant plants differently
because of variations in power plants’ vintage, technological attributes, their location on the system,
and so forth.
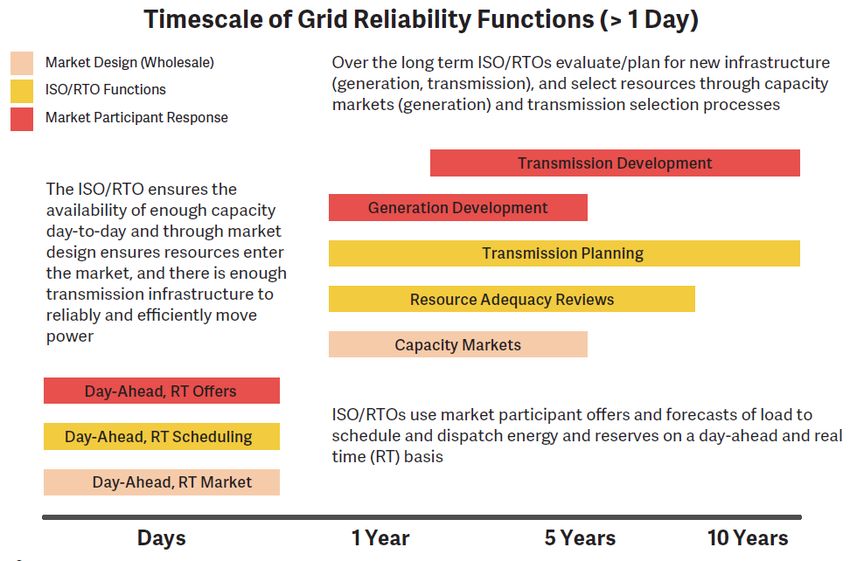
Additionally, the organized market RTOs currently and increasingly incorporate specific
technology-neutral reliability services and reliability needs into their market design constructs.
Examples include various RTOs’ performance obligations in capacity markets; their purchase of greater
quantities of reserves at market-based prices, particularly during periods of reliability constraints; and
payments or incentives for operational controls that perform various reliability services (e.g., the ability
of generation and supply-side resources to provide ramping, automatic generation control, and other
11
See, for example: UBS Utilities, "ETR: Amidst Regulatory Wait (Sell; $70 PT)," April 27, 2017; "NRG Energy Inc.
Moving to the Next Stage: Upgrading to Buy," UBS Global Research, May 31, 2017; "US Electric Utilities & IPPs: PJM
Results Take 2: Just Who Cleared What," UBS Global Research, May 26, 2017; "US Electric Utilities & IPPs: The
Capacity Crash, Just What Happened?" UBS Global Research, May 24, 2017; "US IPP and Utility Weekly Power
Points: The Core Debates of our Day," UBS Global Research, May 12, 2017; and "Dynegy, Inc.: Sticking to the Plan,"
UBS Global Research, May 9, 2017.
12
For example, wholesale electricity markets in ERCOT, PJM, NYISO, and ISO-NE are designed to compensate
generation resources and demand-side suppliers for the services they supply to the system through a combination
of energy, ancillary services, and capacity markets. PJM and ISO-NE have forward (3 years ahead) capacity
markets, while NYISO operates a seasonal capacity market. ERCOT does not have a capacity market, but allows for
higher pricing in the energy market to increase investment incentives. Finally, all four RTOs operate ancillary
service markets that differ in size, supplier obligations, procurement mechanisms, and compensation.
Analysis Group 11Markets, Reliability and the Evolving U.S. Power System
reliability services). Importantly, all RTOs also enforce procedures and obligations as a condition of
market participation for power plants, designed to assure that their facilities respond to operator
instructions, operate safely, and perform as expected in the context of a tightly interconnected
system. With increasing diversity of technologies on the electric system, many more types of power
plants (such as gas-fired power plants, nuclear power plants, coal-fired power plants, solar and wind
projects and other power plants) have ended up supplying valuable electric reliability and energy
services to the bulk power electric system, in light of these incentives and performance obligations.
Notably, organized wholesale electric markets are designed to obtain services to reliably and
efficiently meet customer needs without regard to preferred fuels or technologies. A necessary
component of meeting this goal is to provide the appropriate financial incentives for both efficient
dispatch as well as efficient market entry and exit. For many years and in many of these markets a
significant continuous portion of electricity demand - that is, the quantity of demand that exists around
the clock (often referred to as "baseload" requirements) - has been met by large generating resources
such as older coal-fired and nuclear generating stations. 13 However, as discussed in more detail below,
several key factors have begun to change this landscape.
First, improvements in the efficiency, costs and emissions profile of natural gas combined-cycle
(CC) and combustion-turbine (CT) technologies has led to their being the technology of choice for new
fossil-fueled generation investment in most regions. These gas-fired plants are also capable of serving
load on either a continuous or cycling basis, and thus can provide key reliability services to the grid
operator. Second, changing fuel prices for power generation -- in particular the lower gas prices due to
the emergence of shale gas -- have made it economical to operate this new capacity and to dispatch
existing gas-fired capacity that was previously underutilized; this, in turn, has lowered electric energy
prices and reduced the revenues for all other existing power plants (including coal, nuclear and even
relatively inefficient gas-fired power plants). Third, flat electricity demand across most regions -- due to
lower economic growth, increased energy efficiency, and the growth of distributed solar PV systems --
has reduced the sales and profit opportunities for all resources in the market. And fourth, the rapid
decline in the installed cost per megawatt of solar and wind generation has led to such resources
capturing significant market share at very low variable costs. Finally, many older and less efficient coal
plants without controls on mercury faced additional cost factors in the context of the MATS rule.
Together these factors have led many of the older and smaller coal-fired and some nuclear units to
retire (see Figure 9, below), consistent with market-based principles in these wholesale RTO markets.
13
Recently, much attention has focused on the economic pressures facing these power plants and technologies
that have historically operated around the clock, and that are sometimes referred as "baseload" power plants -
namely, older coal-fired units and nuclear units. However, they are neither the only power-generation
technologies facing economic stress due to market factors, nor are they the only types of technologies capable of
providing around-the-clock power supply and other functions necessary for reliable electric system operations.
Consequently, we do not use the term "baseload" to refer to any particular generating asset type or fuel source, as
many power plants can operate either around the clock or in cycling mode, and provide the same or more essential
reliability services that are provided by such resources. See the discussion below in Section V.
Analysis Group 12Markets, Reliability and the Evolving U.S. Power System
The Role of State and Federal Policies and Consumer Preferences in Shaping the Generation
Mix
In addition to economic factors, federal and state energy and environmental policies have
historically affected the costs and revenues of all types of generating sources and have contributed to
shaping the composition of the generation mix in all regions over time.
Prior examples of such federal policies include support for various types of power generation
technologies still in operation today: federal investment in large-scale hydroelectric facilities (e.g., the
Tennessee Valley Authority’s facilities that were built for rural electrification and flood control 14);
federal insurance to underwrite the risk of accidents at nuclear plants; 15 the availability of production
tax credits (PTCs) and investment tax credits (ITCs) for new nuclear plants and new renewable energy
projects; 16 the availability of loan guarantees for new nuclear plants; 17 and federal research and
development support for advanced coal-fired, renewable and nuclear technologies. 18 Over time, at the
federal level, support for the development and operation of fossil energy and nuclear power has
dominated cumulative federal energy incentives. 19 State policies that favor certain types of power-
generation resources include: many states’ requirements that utilities invest in energy efficiency; 20
renewable portfolio standards (RPS) in 29 states and in the District of Columbia; 21 ratemaking provisions
for certain new technology investments (e.g., such as the ability to recover construction work in
progress for nuclear plants in Georgia, 22 or pre-approval of ratemaking treatment for wind projects in
14
Tennessee Valley Authority Act of 1993, Pub. L. No. 108-447, 118 Stat. 2966.
15
Price Anderson Act of 1957, 42 U.S.C. § 2210.
16
The PTC is a ten-year tax credit on a per-kWh basis for electricity generated by qualifying resources, has been
important in facilitating the commercialization, and driving down the costs over time, of renewable resources. The
value of the 2016 PTC was $0.023/kWh. See Energy.gov, "Renewable Electricity Production Tax Credit (PTC),"
available at https://energy.gov/savings/renewable-electricity-production-tax-credit-ptc. The PTC is also available
to certain new nuclear facilities. While it is currently phasing out, the PTC contributed to the addition of large
quantities of wind capacity across the U.S. over the last 10-15 years. AWEA, "Production Tax Credit," available at
http://www.awea.org/production-tax-credit. The PTC and ITC have also supported investment in the new nuclear
units now under construction at the Vogtle Nuclear Station. E&E News, "House panel OKs lifeline for at-risk
reactors," June 15, 2017, available at www.eenews.net/greenwire/2017/06/15/stories/1060056109.
17
Energy Policy Act of 2005, P. L. No. 109-58, 119 Stat. 594.
18
A recent study estimates that the Federal government has spent over $1 trillion supporting various energy
technologies since 1950. 65 percent of these subsidies have supported fossil fuel development, and only 16
percent of these subsidies have gone toward the advancement of renewables (with remaining subsidies supporting
nuclear, hydro, and geothermal energy sources). See Management Information Systems, “Two Thirds of a Century
and $1 Trillion+ U.S. Energy Incentives,” May 2017. See also Department of Energy, "Budget and Performance,"
available at https://energy.gov/budget-performance.
19
Molly F. Sherlock, Congressional Research Service, Energy Tax Policy: Historical Perspectives on and Current
Status of Energy Tax Expenditures, May 7, 2010, pp. 28-29.
20
See Database of State Incentives for Renewables and Efficiency, available at http://www.dsireusa.org/.
21
Lawrence Berkeley National Laboratory, "U.S. Renewables Portfolio Standards: 2016 Annual Status Report," April
2016, p. 5. See also DSIRE for detailed state RPS descriptions, available at http://www.dsireusa.org/
22
See Georgia Power's Electric Service Tariff "Nuclear Construction Cost Recovery Schedule: 'NCCR'," Georgia
Power, January 2016, which specifies that " The Nuclear Construction Cost Recovery Schedule (NCCR) will recover
the cost of financing associated with the construction of a nuclear generating plant which has been certified by the
Analysis Group 13Markets, Reliability and the Evolving U.S. Power System
Iowa; 23 net-energy metering for rooftop solar in 41 states 24); laws requiring replacement of coal plants
with natural gas facilities for public health reasons (as in Colorado’s Clean Air Clean Jobs law 25); state tax
benefits and/or other incentives related to fossil fuel exploration and production; and many other state
policies. 26
As an example of specific policies promoting the development of renewable resources, state RPS
requirements have been in place for many years and have been adopted by state legislatures for a
variety of fuel-diversity, local economic development, 27 environmental, and other objectives. RPS
policies require that a certain percentage of generation in a state be procured from qualifying sources,
which most typically include wind, solar, and biomass. 28 Most RPS policies escalate the percentage
targets every year up until the goal year, and monitor the progress annually. To meet RPS requirements,
utilities can procure energy from qualifying resources, or in some states utilities can buy Renewable
Energy Credits (RECs) 29 that go towards their total requirement. If entities are unable to meet standards,
Commission in accordance with O.C.G.A. § 46-2-25(c.1) and the Commission’s Certification Order in Docket No.
27800. This schedule is applicable to and becomes a part of each retail rate schedule in which reference is made to
the NCCR."
23
http://home.engineering.iastate.edu/~jdm/wesep594/Tipton.pdf.
24
See Database of State Incentives for Renewables and Efficiency, available at http://www.dsireusa.org/. See also
NCSL, “State Net Metering Policies,” November 3, 2016.
25
http://www.leg.state.co.us/clics/clics2010a/csl.nsf/fsbillcont/0CA296732C8CEF4D872576E400641B74?Open&file
=1365_ren.pdf
26
For examples of state policies that subsidize fossil fuels see Doug Koplow and Cynthia Lin, “Review of Fossil Fuel
Subsidies in Colorado, Kentucky, Louisiana, Oklahoma, and Wyoming,” Earth Track, December 2012.
27
The United States Energy and Employment Report indicates that 374,000 individuals work at least in part for
solar firms and 102,000 individuals work for wind farms across the country (2017 U.S. Energy and Employment
Report, January 2017, accessible at https://www.energy.gov/downloads/2017-us-energy-and-employment-
report); and the Union of Concerned Scientists corroborates the strong employment effect of the renewable
industry ("How Renewable Electricity Standards Deliver Economic Benefits," Union of Concerned Scientists, May
2013, accessible at http://awea.files.cms-plus.com/FileDownloads/pdfs/UCS%20Renewable-Electricity-Standards-
Deliver-Economic-Benefits.pdf). The 2016 Massachusetts Clean Energy Report (available at
http://www.masscec.com/2016-massachusetts-clean-energy-industry-report-0) found that the clean energy sector
has created more than 105,000 jobs and contributes $11.8 billion to the Massachusetts economy. Similar
employment opportunities have been created in Florida, Vermont, California, Rhode Island, and Texas and have
been detailed in reports that can be accessed here: http://info.aee.net/clean-energy-jobs-reports.
28
Different states will have somewhat different rules about resources that qualify to meet RPS requirements. For a
full list of states and qualifying resources, see NREL, "Renewable Portfolio Standards," available at
http://www.nrel.gov/tech_deployment/state_local_governments/basics_portfolio_standards.html.
29
RECs are tradable commodities worth 1 MWh of electricity. States have markets for RECs such that utilities who
are short on qualifying renewable energy procurement can buy RECs and utilities that have a surplus of qualifying
resources can sell RECs. See the EPA REC website, available at https://www.epa.gov/greenpower/renewable-
energy-certificates-recs. Prices of RECs will vary regionally. For example, the RECs in Texas, which has a massive
surplus of wind, trade atMarkets, Reliability and the Evolving U.S. Power System
most states require that a penalty be paid, often called an Alternative Compliance Payment (ACP). 30
Other policies and pricing mechanisms at the state level also shape the attributes of the projects
that participate in certain markets. For example, nine Northeast states participate in the Regional
Greenhouse Gas Initiative (RGGI), which is a mandatory market-based program to reduce greenhouse
gas emissions, and that improves the market position of lower-emitting resources (e.g., solar, wind,
hydro, nuclear, and efficient gas-fired generators) relative to higher-emitting resources. 31 Separately,
New York and Illinois both have introduced zero-emission carbon (ZEC) programs, whereby nuclear
generators receive one ZEC per megawatt-hour (MWh) generated at a price tied to the federal
government's estimate of the social cost of carbon and wholesale capacity prices. 32 And some states
require utilities to procure or enter into long-term contracts for the purchase of specific resource types
(such as energy storage, fuel cells, or renewables). 33
Each of these federal and state policy levers can have the effect of creating incentives for certain
technologies to enter or remain in the market and in so doing introduce interactions with other assets
on the grid. For example, energy efficiency policies have affected overall demand for power, thus
reducing the need to call upon certain existing power plants and keeping electricity prices lower than
those electricity prices would otherwise be. 34 The entry of wind resources in Iowa, for example, has led
to lower output of other power plants on the system but has also led to local investment and local
jobs. 35 And older resources (e.g., fossil and nuclear generators) have remained in the market in part due
to the various state and federal incentives that have encouraged development and continued operation
over many years.
Wholesale electricity markets allow energy prices to go negative, as can occur occasionally in
certain localized areas and at certain times where there is a combination of low loads, offer prices from
generators that reflect production incentives like the PTC, fuel supply contracts, and/or the limited
ability of other generators to ramp their output down or turn off overnight. 36 Some have argued that
30
Lawrence Berkeley National Laboratory, "U.S. Renewables Portfolio Standards: 2016 Annual Status Report," April
2016, p. 4.
31
Emissions allowances are sold through auctions and the proceeds are invested in energy efficiency, renewable
energy, and other programs. See the RGGI website, https://www.rggi.org/.
32
See e.g. Illinois State Power Project, available at https://statepowerproject.org/illinois/.
33
For example, in California Investor Owned Utilities are mandated to procure storage and in 2016 Massachusetts
passed a law mandating utilities purchase renewables with a 1,600 MW carve out for offshore wind. See CPUC
Decision in "Order Instituting Rulemaking Pursuant to Assembly Bill 2514 to Consider the Adoption of Procurement
Targets for Viable and Cost-Effective Energy Storage Systems," Rulemaking 10-12-007, filed December 16, 2010
and Massachusetts House Bill 4568, An Act to Promote Energy Diversity.
34
See: "The Economic Impacts of the Regional Greenhouse Gas Initiative on Nine Northeast and Mid-Atlantic
States," Hibbard et al., July 14, 2015 and "The Economic Impacts of the Regional Greenhouse Initiative on Ten
Northeast and Mid-Atlantic States," Hibbard et al., November 15, 2011.
35
See "Estimated Economic Impacts of Utility Scale Wind Power in Iowa," NREL, November 2013.
36
See Congressional Research Service, "U.S. Renewable Electricity: How Does Wind Generation Impact
Competitive Power Markets?" November 7, 2012, p. 8. See also, ERCOT Investment Incentives and Resource
Adequacy," The Brattle Group, June 2012, page 20.
Analysis Group 15Markets, Reliability and the Evolving U.S. Power System
the PTC is driving significant negative pricing, but the reality is that negative prices from wind
generation, which qualifies for the PTC, do not occur frequently in the U.S. RTOs because wind units are
typically not often on the margin (and thus not eligible to set locational prices). For example, in a recent
PJM study, wind set the price about 0.1 percent of the time in a calendar year. 37 This low rate is true in
many regions in the U.S. that do not have high renewable penetration rates. Even in regions with a high
penetration of renewables, such as Texas, negative pricing occurs relatively infrequently, generally
during already low-load, low-price market conditions, and in Texas almost always in remote parts of the
grid where few if any conventional generators are affected. 38 Some view negative pricing as a distortion
of wholesale market price signals, while others argue that public policy incentives that contribute to
negative pricing correct a market distortion by appropriately crediting resources with otherwise-
unpriced positive attributes (e.g., the avoidance of a market externality, such as damages and risks
associated with pollutant emissions). 39 In any event, from a practical perspective, as demonstrated
below, the existence of state or federal policies or incentives is far less significant than the fundamental
market factors (primarily the addition of new natural gas capacity since 2000 and much lower natural
gas prices) in affecting the profitability of certain existing, older and merchant power-generation
technologies (such as existing coal and nuclear facilities) in certain RTO markets. 40
The declining costs and increased competitiveness of new investment in solar and wind
resources, in combination with early funding and policies to promote commercialization, have led to the
development and installation of significant quantities over the last twenty years. 41 Figure 4 shows the
annual renewable capacity additions from 2000 to 2016. As shown, wind used to dominate the
renewable capacity additions, but in recent years solar has accounted for a large share of incremental
additions. Over this time period, wind accounts for 72 percent of the cumulative renewable capacity
additions, while solar makes up 20 percent. 42 Notably, and as a result of this ongoing investment
climate, renewable resources for the first time comprised ten percent of total net electricity generation
in the U.S. in March 2017 as shown in Figure 5. Moreover, this generation flowed from a diverse set of
states with significantly different market and regulatory constructs, such as California, Colorado, Iowa,
Kansas, Minnesota, North Dakota, Oklahoma, and Texas, (as well as several others). See Figure 6.
37
PJM, State of the Market Report for PJM, March 2017.
38
In Q1 2016 in California, negative prices were experienced about four to seven percent of the time. Throughout
all of 2015, Texas experienced negative prices less than one percent of the time. CAISO, Q1 2016 Report on
Market Issues and Performance, June 2016; ERCOT, 2015 State of the Market Report for the ERCOT Wholesale
Market, June 2016, see p. 9.
39
Congressional Research Service, U.S. Renewable Electricity: How Does Wind Generation Impact Competitive
Power Markets? November 7, 2012.
40
One exception is the large Quad Cities nuclear station in Illinois, which is one of the few nuclear plants
significantly exposed to negative pricing (from wind generation in neighboring regions) at certain low-load periods.
41
See "Levelized Cost of Energy Analysis - Version 10.0," Lazard, December 2016, page 10.
42
Source: SNL Financial.
Analysis Group 16Markets, Reliability and the Evolving U.S. Power System
Figure 4: Annual U.S. Renewable Capacity Additions, 2000 - 2016
Figure 5: Wind and Solar Monthly Net Electricity Generation 43
43
Source: EIA, "Today in Energy," June 14, 2017, available at
https://www.eia.gov/todayinenergy/detail.php?id=31632.
Analysis Group 17Markets, Reliability and the Evolving U.S. Power System
Figure 6: Wind and Solar Net Electricity Generation by State, 2016 44
Finally, individual electricity-using customers have shifted their focus and goals towards a
cleaner generation mix. Hundreds of major corporations (including companies like Procter & Gamble,
Hilton Hotels, Kellogg, General Motors, Google, 3M, Dupont, and Walmart 45) have made public
commitments to rely on renewable energy, reduce their carbon footprint and control their power
costs. 46 Utilities with relatively high emission profiles 47 have made pledges to greatly reduce emissions:
FirstEnergy, in response to investor pressure, has pledged to reduce carbon emissions 90 percent by
2045; 48 Duke Energy is investing $11 billion to reduce carbon emissions 40 percent from 2005 levels by
2030; 49 Dominion Energy plans to reduce the carbon footprint of each of its customers by 25 percent
44
Source: EIA, "Today in Energy," June 14, 2017, available at
https://www.eia.gov/todayinenergy/detail.php?id=31632.
45
http://buyersprinciples.org/about-us/.
46
For example, 96 companies have pledged to go "100% renewable." Examples of these companies include:
ABInBev, Apple, Facebook, GM, Google, Goldman Sachs, Microsoft, Nike, P&G, SAP, Starbucks, and Walmart. See
http://there100.org/companies.
47
For a list of the largest utility emitters in the U.S., see NRDC, "Benchmarking Air Emissions of the 100 Largest
Electric Power Producers in the United States", July 2016, available at
https://www.nrdc.org/sites/default/files/benchmarking-air-emissions-2016.pdf, acceded June 6, 2017.
48
Cardwell, Diane, "Under Investor Pressure, Utility to Study Emissions," The New York Times, January 14, 2014,
available at https://www.nytimes.com/2014/01/15/business/energy-environment/power-company-to-study-
emissions-after-pressure.html?mcubz=2&_r=0; FirstEnergy, "Our Initiatives," available at
https://www.firstenergycorp.com/content/fecorp/environmental/initiatives.html.
49
Duke Energy, "Duke Energy's latest Sustainability Report details cleaner energy investments and an aggressive
goal to reduce carbon emissions 40 percent by 2030," April 27, 2017, available at https://news.duke-
energy.com/releases/duke-energy-s-latest-sustainability-report-details-cleaner-energy-investments-and-an-
aggressive-goal-to-reduce-carbon-emissions-40-percent-by-2030.
Analysis Group 18Markets, Reliability and the Evolving U.S. Power System
over the next 8 years; 50 DTE Energy announced a plan to reduce carbon emissions by 80 percent by
2050; 51 AEP plans to invest $1.5 billion in renewables in the 2017 through 2019 period; 52 and
MidAmerican Energy has committed to a 100 percent renewable energy vision. 53
The combination of economics, state and federal policies, and consumer and company purchase
or investment preferences, has thus led to a shift in the generation resource mix in the United States.
Importantly, as discussed further in Section VI, this has not come at the expense of reliability, and
significant additional quantities of renewable integration are possible. Not only have there been no
serious reliability effects to date, but also numerous studies on renewable integration and coal
retirements have concluded that regions within the U.S. can continue to add larger percentages of
generation coming from natural gas and renewable resources without anticipated reliability concerns. 54
In fact, in regions and/or at times when natural gas supply is constrained, renewable generation plays a
significant positive reliability role by reducing the amount of gas needed to meet demand, making
additional gas supplies available. Further, there is little evidence that the loss of aging conventional
resources due to new, low-cost generation coming on line introduces new or unique reliability
challenges. This is perhaps most evident in New England, which had less than 2 percent of its total
system generation come from coal power in 2016. Commenting on the potential reliability impact of
this condition, ISO-NE President and CEO, Gordon van Welie, recently stated "…coal is now largely
irrelevant in New England…and everyone else says we need coal to maintain resilience? That just
doesn't compute for me." 55 Further, ISO-NE sees no concern of additional renewables affecting
reliability: "The current market design should ensure adequate resources to meet the reliability
standards that the resulting resource mix appropriately complements the operational capabilities and
variability of renewable resources." 56
50
Dominion Energy, "Dominion Virginia Power Plan Sees More Clean Energy," May 1, 2017, available at
https://www.dominionenergy.com/news/news-releases/137244.
51
DTE Energy Newsroom, "DTE Energy announces plan to reduce carbon emissions by 80 percent," May 16, 2017,
available at http://newsroom.dteenergy.com/2017-05-16-DTE-Energy-announces-plan-to-reduce-carbon-
emissions-by-80-percent#sthash.jyjxm4QO.dpuf.
52
AEP, "2017 Corporate Accountability Report," May 2017.
53
MidAmerican Energy, "Our 100% Renewable Vision," available at https://www.midamericanenergy.com/our-
renewable-energy-vision.aspx.
54
Studies or statements have been made on this topic about the following regions: ERCOT, CAISO, NYISO, NEISO,
WECC, and PJM. See, for example, The Brattle Group, "Reliability Risks due to Coal Retirement in ERCOT,"
December 7, 2016; "PJM's Evolving Resource Mix and System Reliability," PJM Interconnection, March 30, 2017.
NREL, Western Wind and Solar Integration Study, available at https://www.nrel.gov/grid/wwsis.html; CAISO, NREL,
"Using Renewables to Operate a Low-Carbon Grid: Demonstration of Advanced Reliability Services from a Utility-
Scale Solar PV Plant," 2017; NYISO, "Growing Wind: Final Report of the NYISO Wind Generation Study," March 20,
2012.
55
E&E News, "Pruitt says coal losses make the grid vulnerable. Not really," June 7, 2017,
https://www.eenews.net/climatewire/2017/06/07/stories/1060055661.
56
Robert Ethier, ISO NE, "Can Wholesale Markets Satisfy Both Electric Reliability and Public Policy Goals?"
Presentation before the US DOE Electricity Advisory Committee, March 18, 2016.
Analysis Group 19Markets, Reliability and the Evolving U.S. Power System
IV. How the Resource Mix Has Changed Over Time Due to Market
and Policy Factors
Overall, electricity generation has been modernizing, with the average mix of generating
capacity becoming younger, more efficient, more varied in size and technology, more dispersed, and
more flexible since the mid-1990s. In short, the mix of resources has gotten more - not less - diverse in
recent years. Fossil fuels as a whole are still the dominant fuel source for power generation today,
providing two-thirds of energy generation and 70 percent of capacity. Technology and operational
advancements - such as increased ramping speeds for natural gas power plants; an increase in the
number of plants with dual-fuel capability; more dispersed siting of generation sources; improved
availability, ride-through capability, voltage, reactive and real power control, and inverter technologies
of renewables; and improved operator forecasting of weather conditions 57 - create additional diversity
within the generation mix that enhances reliability to the grid.
Figure 7 highlights and Figures 8 and 9 show, the various changes in generation and capacity
from 2005 to 2016. Of note, the shares of nuclear and hydro generation have remained relatively stable
in terms of generation and capacity, but coal and oil decrease across both dimensions, and renewables
increase considerably across both. Natural gas increased in capacity (17 percent), particularly in recent
years, but has seen an even greater increase in generation (81 percent). This can in part be explained by
the capacity addition chart (Figure 8), which shows large amounts of new, efficient natural gas capacity
coming online in the 2000s. Figure 9 shows retirements that have occurred between 1990 and 2017,
sorted by the age (or online date) of the retired unit as of the time of the power plant's retirement. As
shown in the figure, there are large quantities of both coal and natural gas capacity that have retired in
the last twenty years, with most of the retirements associated with older units (the average retirement
age of the coal plants at 59 years and the average age of retired natural gas plants at 44 years).
57
The California Independent System Operator Corporation (California ISO) reports a 20 percent improvement in
forecasting wind generation based on the results of a yearlong forecasting competition," "New Release: California
ISO Wind Forecasting Improves 20 Percent," CAISO, January 26, 2010; and "The forecasting tool has already
resulted in fewer orders to wind plants to curtail their output under certain circumstances. With more efficient
dispatch of the system, the amount of Minimum Generation (Min Gen) events (when the amount of generation is
close to exceeding the demand for electricity) is reduced, resulting in fewer wind curtailments," See "New Wind
Power Forecast Integrated into ISO-NE Processes and Control Room Operations," ISO New England, April 1, 2014.
See also, "Fast Cycling and Rapid Start-up: New Generation of Plants Achieves Impressive Results," Siemens,
January 2011; "Power Trends 2016: The Changing Energy Landscape," NYISO, 2016; "Changing Resources: How
New England has Responded to Challenged Associated with the Expanded Role of Natural Gas," ISO New England,
May 2016; and "Variable Renewable Generation Can Provide Balancing Control to the Electric System," NREL,
September 2013.
Analysis Group 20You can also read