Natural Gas in Canada: what are the options going forward? - Oxford University Research Archive
←
→
Page content transcription
If your browser does not render page correctly, please read the page content below
May 2015

                     Natural Gas in Canada:
                    what are the options going forward?

OIES PAPER: NG 98                                         Ieda Gomes
                                 OIES Senior Visiting Research Fellow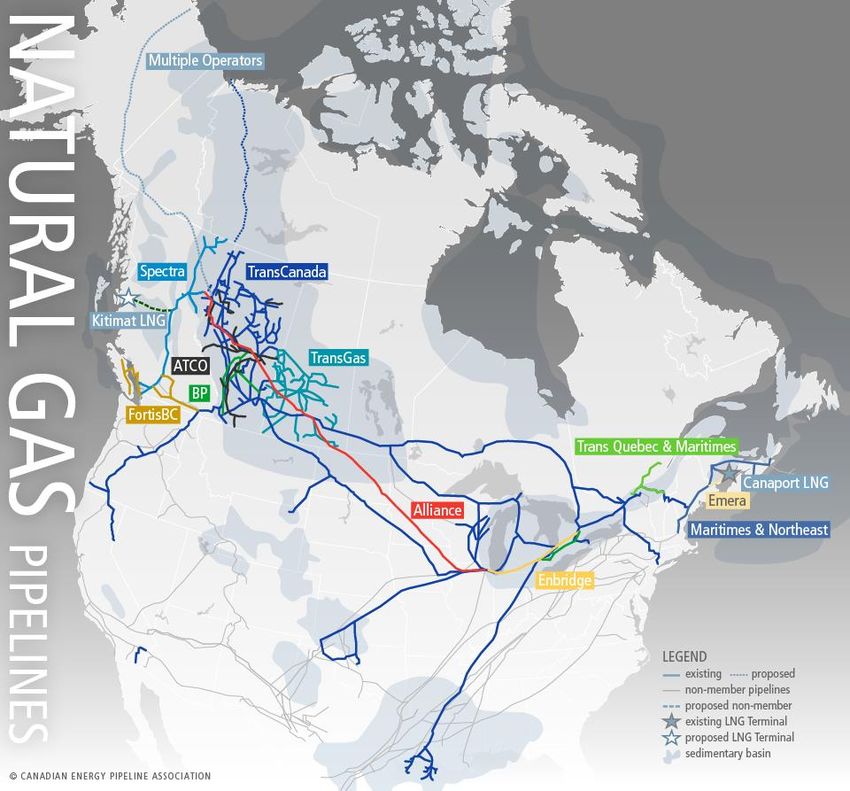
The contents of this paper are the authors’ sole responsibility. They do not
         necessarily represent the views of the Oxford Institute for Energy Studies or any of
                                             its members.

                                           Copyright © 2015
                               Oxford Institute for Energy Studies
                                    (Registered Charity, No. 286084)

This publication may be reproduced in part for educational or non-profit purposes without special
permission from the copyright holder, provided acknowledgment of the source is made. No use of this
publication may be made for resale or for any other commercial purpose whatsoever without prior
permission in writing from the Oxford Institute for Energy Studies.

                                       ISBN 978-1-78467-030-6

                                                                                                      i
  May 2015: Natural Gas in Canada
Acknowledgements

The author would like to thank all those who provided valuable insights and information during the
preparation of this paper, particularly Mel Ydreos, Executive Director of Energy Vantage (Canada),
Yasmin Rahemtulla, Director Oil Sands Analysis and Forecasting (Alberta Energy, Canada), James
Li, Analyst, Oil Sands Business Evaluations, (Alberta Energy), Brendan Grey, Director, Energy
Information and Analysis at Department of Energy (Government of Alberta). The author would like to
express her gratitude to Paul Cheruvathur, Manager, Oil Sands Project Engineering and Approvals
(Alberta Energy) who contributed to the early concept of this paper and also provided a host of
information about regulatory matters and LNG projects in Canada.
The author also would like to thank members of the Oxford Institute for Energy Studies, especially
Jonathan Stern for initial thoughts on the paper concept and Howard Rogers for reviewing this paper
and Kate Teasdale and John Elkins for the final formatting and editing.

                                                                                                  ii
  May 2015: Natural Gas in Canada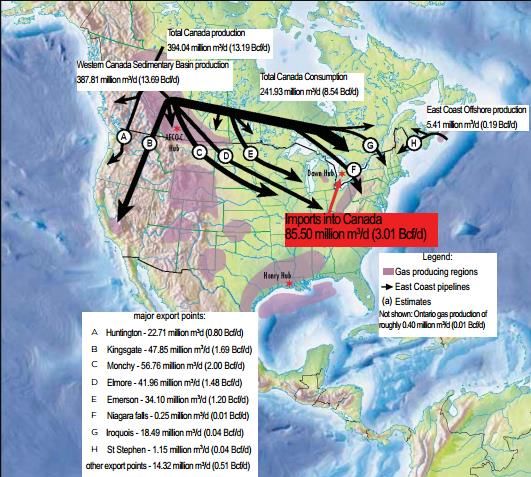
About the Author

Ieda Gomes is a Senior Visiting Research Fellow at the Oxford Institute for Energy Studies. Her areas
of expertise include natural gas and LNG market fundamentals as well as energy pricing, policy and
regulation particularly in developing countries in South Asia, the Middle East, Africa and Latin
America. Ieda’s career in the gas and energy industry spans more than 30 years. She worked for
nearly 14 years at BP plc as Vice President for new ventures and market development on several
international assignments and for 19 years at the largest gas distribution company in Brazil, Comgas.
She has been a key participant and shaper of events in Brazil’s gas industry – from the introduction of
natural gas supplies in Sao Paulo to the negotiating and signing of the domestic and Bolivian gas
supply agreements, the privatisation of Comgas and the establishment of the Brazilian Association of
Gas Distribution Companies (ABEGAS). Ieda is based in the UK and sits on the board and advisory
council of various companies, think tanks and associations. She writes a bimonthly column for Brazil
Energia. Ieda holds a BSc in chemical engineering and an MSc in energy and environmental
engineering.

                                                                                                     iii
  May 2015: Natural Gas in Canada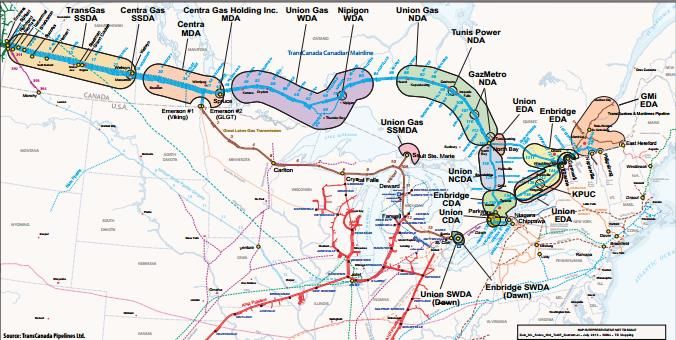
Preface

With US shale gas dominating the headlines of the energy media for the past several years, Canadian
gas has been somewhat overshadowed. While gas industry followers outside of North America may
have been aware of the reduction in Canadian gas exports to the US, they will likely have missed the
complex interaction of lower cost US shale invading regional Canadian markets formerly supplied by
Canadian gas. This situation has been further exacerbated as Canadian transportation tariffs have
been raised to compensate for lower throughput. Ieda Gomes provides a comprehensive analysis of
the dynamics of these and other key elements of the Canada’s gas fundamentals and how they have,
and will continue to evolve.
The loss of Provincial and Federal tax and royalty take due to lowered exports, production growth and
prices is another important factor which leads to an assessment of potential new market segments
such as natural gas and LNG vehicles and Tar Sands sectors (currently impacted by low oil prices).
This inevitably leads to the exploration of the obvious replacement for the lost pipeline export
volumes, namely LNG exports.
Readers will already be aware of the numerous proposed LNG export projects on Canada’s West and
East Coasts. Ieda provides a succinct description of each of these and details at the individual project
level, and in overview, the significant challenges to be overcome; both physical in terms of
transportation distances and greenfield construction (in a region of insufficient skilled resources), and
political in terms of the myriad, overlapping approval and consent processes to be satisfied prior to
construction start. Uncertainties on the LNG-specific fiscal framework add yet another uncertainty
layer.
The final hurdle is of course the relative competitiveness of Canadian LNG projects relative to US Gulf
Coast brownfield and Australian expansion projects at a time when: global demand for LNG over the
next decade appears to have declined and the window for new supply requirement appears to have
moved back to the early 2020s, and Asian buyers appear set on moving away from oil-indexed long
term contract prices.
The OIES Gas Programme aims to address key elements of the global gas market, especially those
pertaining to its future evolution. Although the conclusions of this paper set out the scale of the
challenges Canadian gas and LNG face, rather than their immediate solution, it develops a detailed,
objective and fascinating perspective of a huge gas resource, overall favourably located relative to the
Asian growth markets and the dilemmas to be addressed if this is to be successfully monetised

Howard Rogers

Oxford

                                                                                                       iv
  May 2015: Natural Gas in Canada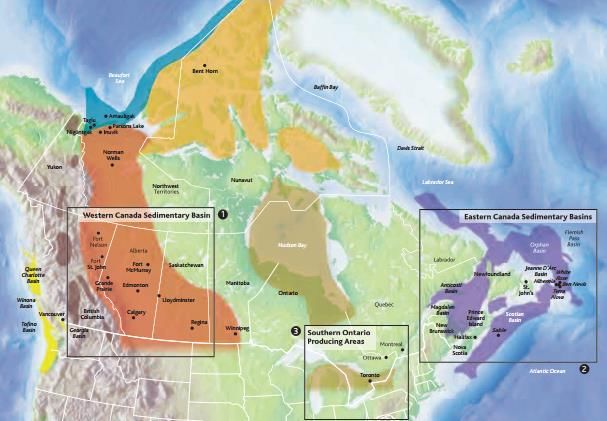
Contents
Acknowledgements .............................................................................................................................. ii
About the Author .................................................................................................................................. iii
Preface .................................................................................................................................................. iv
1. Introduction ....................................................................................................................................... 1
2. Canada Energy Fundamentals ........................................................................................................ 2
3. Natural gas resources and reserves ............................................................................................... 6
   Shale Gas............................................................................................................................................ 8
4. Natural Gas Fiscal Regime ............................................................................................................... 9
   British Columbia fiscal regime ........................................................................................................... 10
   Alberta fiscal regime .......................................................................................................................... 10
5. Production, Supply and Demand .................................................................................................. 11
6. Canada domestic gas market ........................................................................................................ 13
   Natural gas demand in oil sands operations ..................................................................................... 15
7. Other potential demand levers in the domestic market .............................................................. 16
   Small Scale LNG ............................................................................................................................... 17
   Petrochemicals .................................................................................................................................. 17
   Natural Gas in the transportation sector ........................................................................................... 18
   Cogeneration ..................................................................................................................................... 19
8. Gas Hubs in Eastern Canada and Northeast US ......................................................................... 20
9. Canada’s Natural Gas Pipeline System ........................................................................................ 22
10. The Changing Dynamics in Canada’s Gas Exports .................................................................. 25
   Imports and Exports .......................................................................................................................... 27
11. Gas Prices ...................................................................................................................................... 28
12. Natural gas prices and liquid content ......................................................................................... 30
13. Export Scenarios and Gas Price Sensitivities ........................................................................... 31
14. LNG exports: a key monetisation option for Canada’s natural gas ........................................ 34
   Foreign Oil Companies' acquisition of Canada gas resources ......................................................... 34
   LNG Export Licenses Applications .................................................................................................... 35
15. West Coast LNG Projects ............................................................................................................. 35
   Kitimat LNG ....................................................................................................................................... 36
   LNG Canada ..................................................................................................................................... 37
   Pacific Northwest LNG (PNWLNG) ................................................................................................... 37
   BC LNG (Douglas Channel) .............................................................................................................. 38
   Prince Rupert LNG ............................................................................................................................ 38
   WCC LNG ......................................................................................................................................... 38
   Woodfibre LNG ................................................................................................................................. 38
16. East Coast LNG Projects .............................................................................................................. 39
   St John LNG (former Canaport LNG Regasification) ........................................................................ 39
   Goldboro LNG ................................................................................................................................... 39
   GNL Quebec Inc. (Energie Saguenay LNG) ..................................................................................... 40
   Bear Head LNG Corp. (Bear Head) .................................................................................................. 40
17. Pipelines to LNG plants ................................................................................................................ 40
   Kitimat area ....................................................................................................................................... 40
   Rupert area ....................................................................................................................................... 41
   Squamish area .................................................................................................................................. 41
18. Markets for Canadian LNG ........................................................................................................... 42

                                                                                                                                                           v
    May 2015: Natural Gas in Canada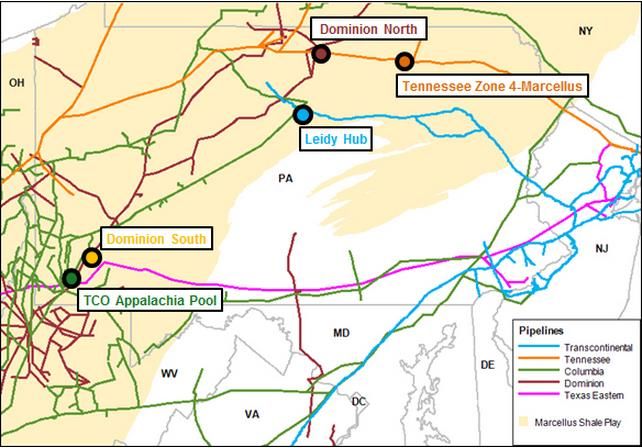
19. Key issues and barriers for the implementation of LNG projects in Canada ......................... 44
  Costs, price structure and competition with US and Australian projects .......................................... 44
  Labour market ................................................................................................................................... 45
  Regulatory Challenges ...................................................................................................................... 45
  First Nations ...................................................................................................................................... 46
  Gas Transportation Issues: Lack of Pipeline Capacity and Toll Fees. ............................................. 48
  Project Costs and Execution ............................................................................................................. 49
  Fiscal Uncertainty .............................................................................................................................. 49
20. LNG pricing and competitiveness ............................................................................................... 51
21. A return to S-Curves? ................................................................................................................... 54
22. Conclusions and Insights ............................................................................................................ 55
Units ..................................................................................................................................................... 58
Conversion factors ............................................................................................................................. 58
Glossary/Acronyms ............................................................................................................................ 58
Bibliography ........................................................................................................................................ 59
Company & Government Websites ................................................................................................... 61
Appendix 1 – Calculation of Alberta and British Columbia Royalties ........................................... 62
  British Columbia ................................................................................................................................ 62
  Alberta ............................................................................................................................................... 63
Appendix 2 – Status of Proposed LNG Projects in Western Canada ............................................ 64
Appendix 3 – Canada LNG Projects: Status of the Export and Environmental Applications ..... 65
Appendix 4: Stages of BC Environmental Assessment Office (BC EAO) Environmental
Assessment (EA) Process: ................................................................................................................ 66
       Pre-Application Stage: ................................................................................................................... 66
       Application Review Stage: ............................................................................................................. 66
       Decision Stage: .............................................................................................................................. 66

Figures
Figure 1: Canada Primary Energy Supply – 2012 (Total: 251 Mtoe) ...................................................... 3
Figure 2: Final Energy Demand in Canada - 2012 ................................................................................. 4
Figure 3: Evolution of Canada Energy Exports (US$ billion) .................................................................. 4
Figure 4: Electricity Generation Capacity by Fuel – 2013 (Total 137 GW) ............................................ 5
Figure 5: Canada Power Output Mix – 2013 (%) .................................................................................... 5
Figure 6: Main Hydrocarbon Basins in Canada ...................................................................................... 7
Figure 7: Evolution of Canada's Proven Gas Reserves.......................................................................... 7
Figure 8: Natural gas resource base as of December 2013 ‐ Canada (Total 1,093 Tcf) ....................... 8
Figure 9: US and Canada Shale Plays ................................................................................................... 9
Figure 10: Alberta Natural Gas Reference Price Calculation (October 2014) ...................................... 11
Figure 11: Natural Gas Production and Consumption in Canada......................................................... 11
Figure 12: Natural Gas Production, Import and Export Points – 2013/2014 ........................................ 12
Figure 13: Natural Gas Consumption by Market Segment – 2013 (Total: 103 Bcma) ......................... 14
Figure 14: Electricity Generation Capacity Forecast by Fuel Type – 2035 (Total: 164 GW) ................ 14
Figure 15: Natural Gas Consumption in Oil Sands Operations ............................................................ 15
Figure 16: Medium Term Natural gas demand forecast 2014-2016 ..................................................... 16
Figure 17: Evolution of Natural Gas Liquids Prices .............................................................................. 18

                                                                                                                                                           vi
    May 2015: Natural Gas in Canada
Figure 18: Historical and forecast generation capacity additions and retirements - Alberta ............... 20
Figure 19: Markets served by Union Gas' Dawn Hub ........................................................................... 20
Figure 20: Natural Gas Price Hubs in Northeast US ............................................................................ 22
Figure 21: Natural Gas Transportation Pipelines in Canada ................................................................ 23
Figure 22: TransCanada Mainline System Map.................................................................................... 24
Figure 23: TransCanada Mainline Prairies Segment Throughput vs. Capacity .................................... 25
Figure 24: Historical evolution of gas sales in Alberta and British Columbia ........................................ 26
Figure 25: Canadian Natural Gas Imports and Exports ........................................................................ 27
Figure 26: Average Canadian Gas Exports to US Regional Markets (Bcma) ...................................... 27
Figure 27: Natural gas net royalty revenues - Alberta .......................................................................... 28
Figure 28: Alberta natural gas price forecast ........................................................................................ 29
Figure 29: Average Natural Gas Quarterly Spot Prices in US and Canada ......................................... 30
Figure 30: AECO and HH price forecast ............................................................................................... 30
Figure 31: Dry Gas and NGL Breakeven Prices ................................................................................... 31
Figure 32: Natural gas production forecast in Canada under two market scenarios ............................ 32
Figure 33: Natural Gas Marketable Production vs Price Scenarios ..................................................... 33
Figure 34: Canada Natural Gas Supply vs Demand Forecast .............................................................. 33
Figure 35: Proposed LNG Projects in BC ............................................................................................. 36
Figure 36: Proposed East Coast LNG Projects .................................................................................... 39
Figure 37: Existing and Proposed Pipelines - West Canada LNG Projects ......................................... 41
Figure 38: Worldwide LNG Supply and Demand Forecast ................................................................... 43
Figure 39: Example of Calculation of LNG Income Tax for a 5-year Period ......................................... 50
Figure 40: Comparison of Cost Plus vs Oil Indexed LNG prices .......................................................... 53
Figure 41: Netback gas price to Western Canada producer vs Brent price ......................................... 53
Figure 42: Comparative DES Asia Prices of Canadian and USGC Brownfield LNG Projects ............. 54
Figure 43: Coefficient on LNG “S-Curve” Price Formula for a Generic Canada LNG Project. ............. 55
Figure 44: Evolution of US Imports of Canadian Natural Gas .............................................................. 56
Figure 45: Evolution of US gas exports to Canada ............................................................................... 57
Figure 46: Alberta incentive programmes for natural gas exploration and drilling ............................... 63
Figure 47: Proposed LNG Projects in Western Canada (As of December 2014) ................................. 64
Figure 48: Regulatory Status of Proposed Canadian LNG Projects ..................................................... 65

Tables

Table 1: Canada's Main Hydrocarbon Resource Basins ........................................................................ 6
Table 2: Small Scale LNG projects in Canada...................................................................................... 17
Table 3: Price Scenarios for 2014-2016 Natural Gas Marketable Production ...................................... 32
Table 4: Canada LNG Projects Weaknesses and Strengths ................................................................ 44
Table 5: Cost plus estimate – Generic Canadian LNG DES Japan ..................................................... 52
Table 6: LNG DES oil-indexed price scenarios..................................................................................... 52

                                                                                                                                      vii
   May 2015: Natural Gas in Canada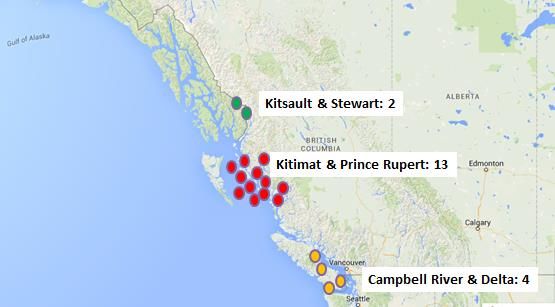
1. Introduction
Canada is at a crossroads: from being a domestic and regional gas player to becoming an LNG
exporter. Despite its large reserves of conventional and unconventional gas, domestic gas production
has been stagnant since 2009 as Canada has lost domestic and export markets to US shale gas.
Production stood at 154.8 Bcma in 2013, a 15% decrease when compared to the levels of 2007.
The drop in production in Canada is due to increased US shale gas production in the Northeast and
Midwest (Marcellus, Utica, and Bakken) which has replaced traditional US markets supplied by
Canada and is also displacing large volumes of Canada Western Basin gas in the eastern Canadian
domestic markets.
Due to its connection and intrinsic inter-dependence with the US gas market, the gas industry in
Canada is very sensitive to supply, demand and price changes in the US and has been doubly
hammered by a reduction in export markets and a decline in prices, with gas prices at Alberta’s AECO
hub falling considerably over the last seven years. As a consequence royalty revenues have also
fallen significantly.
The loss of important domestic and export markets has pushed the country to look for alternative
markets. New domestic markets are not likely to be significant and would take time to develop;
therefore the development of LNG export projects, aiming at premium markets in North Asia, seems a
natural next step to counter the decline of traditional export markets.
There are 18 LNG export terminals being proposed in the Province of British Columbia (BC) and four
proposed LNG schemes in the East Coast.
Investors in BC projects are attracted by the potential high price differential gained by supplying the
oil-indexed premium-priced LNG markets in Asia, for which Canada is advantageously located, when
compared to US Gulf Coast projects.
Although West Canada producer prices are traded at a discount to Henry Hub, the greenfield nature
of the Canadian LNG projects will result in higher liquefaction and transportation costs and also face
additional challenges such as obtaining environmental permits, engaging the support of communities
and First Nations, and developing price structures to entice North Asian buyers.
Canada is a late joiner to the LNG export club and the proposed Canadian LNG export projects are
not without challenges, namely:
Higher CAPEX costs when compared to US brownfield projects.
Expensive pipeline infrastructure requirements.
Challenges associated with securing long term oil-indexed supply agreements at a time when
Asian buyers are looking to move away from the traditional JCC price formulae.
Balancing the concern of all stakeholders especially the native communities, politicians and timing
to reach key Asian markets.
Insufficient qualified engineering resources and fast-rising labour costs for skilled resources,
broader and more costly scope in projects (higher cost locations and large infrastructure costs).
Perceived red tape on environmental permitting and taxation.
Over the last 5 years, a few Asian companies started acquiring Canadian gas resources, to secure
and diversify gas supplies to their domestic markets, and major oil companies are involved in large
scale projects in the West Coast.
1
May 2015: Natural Gas in Canada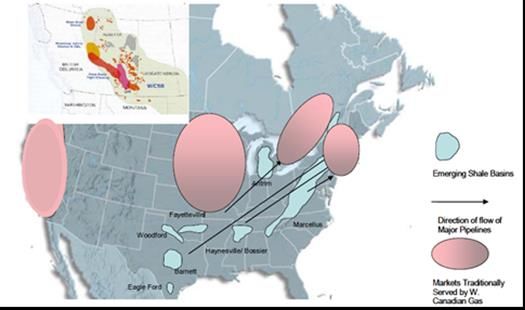
Land-locked gas regions such as Alberta face additional challenges because they are further away
from the LNG export projects than British Columbia producers, and also because their traditional
Eastern Canada and Midwestern US markets have been taken by US shale producers.
Similarly to other large oil and gas producing economies, Canada is already feeling the impact of fast
falling oil prices which raises the level of uncertainty for greenfield projects and is causing the deferral
of investment decisions for LNG and oil sand projects.
At his Opening Statement at the press conference following the release of the Financial System
Review in Ottawa, in December 2014, the Governor of the Bank of Canada, Stephen Poloz declared:
“The recent weakness in oil ... is likely to boost global growth but to moderate growth and
inflation in Canada, even though the effects should be tempered by exchange rate
depreciation and stronger non-energy exports.”1
As of January 2015, the IMF reduced its 2015 outlook for the Canadian economic growth to 2.3% -
down from its former prediction of 2.4% - and its outlook for 2016 is also down to 2.1%, against a
previous forecast of 2.4%2.
The Canadian gas industry is also looking for alternatives to foster other gas applications in the
domestic market such as gas to liquids, ethane crackers, propylene derivative plants, methanol-to-
olefins, small LNG plants, and natural gas for transportation including Compressed Natural Gas
(CNG) and LNG trucking.
The dilemma for Canada is to develop natural gas export projects, in particular LNG, in a limited time
window in competition with US brownfield LNG projects, which are cheaper to build and faster to
implement and with Australian LNG expansion projects, which are viewed as more expensive, but
are also location advantaged for the premium Asian markets. Due to the retreat in investment
decisions caused by the drop in oil prices in early 2015, it appears that the 2020 market window is
already lost for Canadian LNG projects.
This research paper looks into Canada’s energy and natural gas market fundamentals, the
alternatives for gas monetisation being currently considered, costs of supply, key risks for
implementation and political and environmental constraints. It also provides an overview of the status
of proposed LNG projects and its timing to market vis-à-vis 2020-2025 world LNG demand. The
paper also compares price alternatives for Canadian LNG delivered into Asian markets; including oil
indexed and cost plus/hub pricing.
The paper also raises the question on whether a return to LNG pricing S curves could be a tool to
align buyers and sellers whilst the markets adapt to the current and unpredictable low oil price era.

2. Canada Energy Fundamentals

Canada is one of the largest economies in the world, with a nominal GDP of approximately US$ 1.7
trillion in 20133. With an area of 9,984,670 km², Canada is the second largest country in the world
after Russia. As of October 2014 the population of Canada totalled 35.7 million inhabitants with nearly
30% of the country’s population living in 10 cities. Canada is a parliamentary democracy with
lawmaking shared among the federal government, ten provincial and three territorial governments.

1
    Bank of Canada, (January 2015)
2
    http://www.ctvnews.ca/business/imf-drops-forecast-for-canadian-economic-growth-1.2197318#ixzz3PZp1Vu5N
3
    Bank of Canada, (January 2015)

                                                                                                             2
     May 2015: Natural Gas in Canada
Canada is endowed with abundant energy resources, including natural gas, oil, coal and a large
hydroelectric potential. Primary energy production in Canada increased 3.3% in 2013 to 428 Mtoe4.
In 2013 approximately 41% of the primary energy produced in Canada was exported, primarily to the
United States, with a remaining total internal energy supply of 251 Mtoe5. Canada exported 75% of its
crude oil production and slightly above 52% of its marketable natural gas in 2013. Other sources of
renewable energy represent only 5% of the primary supply.
Figure 1: Canada Primary Energy Supply – 2012 (Total: 251 Mtoe)
Source: (IEA, 2015)
Canada’s recoverable coal reserves totalled 6.6 billion tonnes in 2013, approximately the same size
as Colombia’s6. On a world scale Canada coal reserves are not very significant, particularly when
compared with the USA, which holds 237.3 billion tonnes. More than 90% of Canada’s coal deposits
are located in the western provinces and approximately 45% of Canada’s coal production is exported
to international markets.
The provinces of Ontario, Quebec and Alberta account for 75% of the country’s energy consumption,
with the latter showing a steady increase since 2009, partially related to the increase in oil sands
production, which require large amounts of steam for in-situ production.
Proven natural gas reserves reached 71.4 Tcf at the end of 2013, and consumption exceeded 100
Bcma, ranking the country as the 6th world largest gas consuming nation. Natural gas has a large
share of the country’s final energy consumption, approximately 31% in 2012 whereas oil products
account for 38%.
4
Statistics Canada, (2013)
5
IEA,(2015).
6
BP, (2014)
3
May 2015: Natural Gas in CanadaFigure 2: Final Energy Demand in Canada - 2012
Source: (Canadian Gas Association, 2015a)
In 2013 the contribution of the energy industry to Canada’s GDP and to Canadian export revenues
was 9.6% and 23.3% respectively. In 2013, net energy exports totaled nearly CAD 70 billion, led by
crude oil and crude bitumen at about CAD 55 billion, with natural gas, refined petroleum, electricity
and other energy products contributing about CAD 7 billion, CAD 1.8 billion, CAD 2.0 billion and CAD
3.5 billion, respectively 7 . The contribution from natural gas to Canada’s exports has been falling
steadily since 2009, when it represented nearly one third of the total exported, CAD 16 billion (circa
US$ 13 billion).
Figure 3: Evolution of Canada Energy Exports (US$ billion)
Source: (National Energy Board, 2013b)
In 2013 the oil and gas industry invested CAD 74 billion (US$ 59 bn), of which 94.5% was in oil sands
and other Western Basin oil and gas projects.
7
Canadian Association of Petroleum Producers, (2014), National Energy Board, (2013b)
4
May 2015: Natural Gas in CanadaIn 2013 Canada’s power generation capacity stood at 137 GW, with hydroelectricity playing the
primary role with a share of 56%, followed by natural gas at 15%. The other renewable sources
accounted for 7%, of which 3.8% was wind power.
Figure 4: Electricity Generation Capacity by Fuel – 2013 (Total 137 GW)
Source: (National Energy Board, 2013a)
On a world scale Canada is second only to China in hydro power generation. In 2013 Canada’s hydro
generation output accounted for 63% of the country's power production of 611 TWh. Canada
electricity exports stood at 62.6 TWh in 2013, whereas imports totalled 10.7 TWh.
Figure 5: Canada Power Output Mix – 2013 (%)
Source: (National Energy Board, 2013b), (BP plc, 2014)
Electricity consumption in Canada in 2013 stood at 590 MWh; the industrial sector accounted for
38.8% followed by the residential and commercial sectors, with respectively 29.5% and 26.4%. 8
8
Electricity Canada, (2014)
5
May 2015: Natural Gas in Canada3. Natural gas resources and reserves
The Canadian oil industry was born around 1850 in south Ontario 9, after geologist Thomas Sterry
Hunt of the Geological Survey of Canada reported seepages of crude oil in the area. Following Hunt’s
discovery, businessman Charles N. Tripp founded the International Mining and Manufacturing
Company, the first oil company registered in North America to exploit asphalt beds and oil springs. He
sold his company to James Miller Williams, dubbed the “founding father of Canada’s oil industry”, who
soon started producing oil in larger quantities, which was transported 200 km away and refined in
Hamilton to produce lighting oil.
Onshore natural gas was discovered in 1859 in New Brunswick, but initially flared as a waste product.
In the west, natural gas was discovered in 1883 near Medicine Hat, Alberta, followed by other gas
finds in the same basin. Although available since 1880, natural gas only reached the large cities one
hundred years later, with the construction of long distance pipelines. In 1947 Imperial Oil discovered
oil in Alberta, which was a major game changer for Canada. The discovery of large amounts of
natural gas in Alberta was the enabling factor for the construction of gas transportation pipelines to
the east coast area in the 1950s.
Canada has seven major hydrocarbons resources regions, as illustrated in
Table 1: Canada's Main Hydrocarbon Resource Basins below.
Table 1: Canada's Main Hydrocarbon Resource Basins
Basin (% of conventional hydrocarbon
resources)
Western Canada Sedimentary Basin (WCSB) 57%
Atlantic Margin 18%
Arctic Cratonic 10%
Arctic Margin 6%
Pacific Margin 4%
Intermontane 3%
Eastern Cratonic 2%
Source: Bott, (2004)
Figure 6 below shows the regions of Western and Eastern Canada that account for the vast majority
of Canada’s crude oil and natural gas production.
The Western Canada Sedimentary Basin (WCSB) is the most productive hydrocarbon area in the
country and includes most of the provinces of Alberta and Saskatchewan, parts of British Columbia,
Manitoba, Yukon and the Northwest Territories. Approximately 90% of Canada’s natural gas reserves
are in Western Canada. Western Canadian shale gas can be found along the Alberta/British
Columbia (BC) border and into northeastern B.C.
9
Bott, (2004)
6
May 2015: Natural Gas in CanadaFigure 6: Main Hydrocarbon Basins in Canada
Source: Bott, (2004)
Canada ranks as the 16th largest proven gas reserve holder in the world. Natural gas reserves have
remained almost flat in the period 2000-2009, rising to around 2 TCM (71.4 Tcf) in 2010, with a
Reserves/Production ratio (R/P) of 13 years10.
Figure 7: Evolution of Canada's Proven Gas Reserves
Source: BP,(2014)
10
BP (2014)
7
May 2015: Natural Gas in CanadaConventional gas represents less than 8% of the total technically recoverable resources, with shale
gas and tight gas estimated at respectively 222 and 530 Tcf according to the National Energy
Board11, which estimates Canada’s total gas resources at approximately 1093 Tcf.
Figure 8: Natural gas resource base as of December 2013 ‐ Canada (Total 1,093 Tcf)
Source: Canadian Gas Association (2015a), (National Energy Board, 2014b)
According to consulting group Ziff Energy’s evaluation of North American and Canadian gas
resources, as of January 1, 2014 Canada had an Ultimate Potential of 922 Tcf, 198 Tcf already
produced and 723 Tcf of remaining technically recoverable gas resource - of which 666 Tcf is to be
found in Western Canada12. The same authors estimate that the remaining resources are split as
follows:
7% proved reserves
38% conventional and tight gas
31% shale gas
1% Coal Bed Methane
Shale Gas
There are different ranges of estimates of Canada’s shale resources. The Geological Survey of
Canada estimates that Canada has 4,995 Tcf of shale gas in place. The Canadian Society of
Unconventional Resources (CSUR) defines marketable gas as “the volume of gas that can be sold to
the market after allowing for removal of impurities and after accounting for any volumes used to fuel
surface facilities”. The CSUR estimates that the range of marketable Canadian shale gas is around
343 Tcf- 819 Tcf, whereas a study by the National Energy Board in collaboration with the
governments of Alberta and British Columbia estimates that the Montney play, located in Alberta and
B.C., contains 449 Tcf of marketable gas 13 . The US Energy Information Administration (EIA)
estimates that 573 Tcf of Canadian shale gas is technically recoverable 14.
The main shale and oil formations are the Horn River Basin, the Cordova Embayment and the Liard
Basin (located in British Columbia and the Northwest Territories); the Doig Phosphate Shale (located
in both
British Columbia and Alberta); the Banff/Exshaw, Duvernay, Nordegg, Muskwa formations and the
Colorado Group in Alberta; the Williston Basin’s Bakken Shale in Saskatchewan and Manitoba; the
11
Sourced from Canadian Gas Association, (2015a)
12
Ziff Energy (2014)
13
Chong, (2014)
14
Energy Information Administration- DOE, (2013)
8
May 2015: Natural Gas in CanadaUtica Shale in Quebec and the Horton Bluff Shale in Nova Scotia. Western Canada also contains the
large Montney and Doig Resource Plays, spread across British Columbia and Alberta which are
categorised primarily as tight sand and siltstone reservoirs 15.
Figure 9: US and Canada Shale Plays
Source: (Canadian Association of Petroleum Producers, 2014a)
The large shale potential resource base located in the Liard Basin, Horn River Basin, Cordova
Embayment, and deeper portions of the Montney Formation is almost all dry gas.
4. Natural Gas Fiscal Regime
Approximately 90% of oil and gas resources in British Columbia (B.C.) and 81% in Alberta are owned
by the Crown (the Province). The Provinces grant exploration and production rights to the industry in
exchange for the payment of royalties, bid bonus payments and rents. The remaining 10% and 19%
respectively are owned by the Government of Canada in national parks or held on behalf of the First
Nations, individuals or corporations as a result of land grants made by Canada in the 1800s.
The oil and gas sector is a significant source of revenue for B.C. and Alberta provincial budgets.
These revenue streams are used to fund health, education and infrastructure. In the fiscal year
2009/10, government B.C. revenues from oil and gas, including petroleum and natural gas rights
sales, totalled $1.35 billion – almost 60% of total direct revenues from B.C.’s resource industries and
4% of total provincial revenues. Federal and provincial taxes are applicable across Canada using the
same base but different rates.
In addition to the established royalty framework that applies to the production and sale of natural gas
in B.C and Alberta, the Provinces also possess a comprehensive taxation system, including sales tax,
fuel tax, carbon tax and a property tax system.
15
Energy Information Administration- DOE, (2013)
9
May 2015: Natural Gas in CanadaBritish Columbia fiscal regime
Natural gas prices for royalty purposes (Producer Prices) are determined by the provincial Ministry of
Energy and Mines by averaging the actual selling prices for gas sales with certain common
characteristics for each company and deducting applicable costs16.
The result is a netback price, generally determined at the plant inlet, which is unique for each
producer/plant/month combination. If this price falls below a minimum price known as the Posted
Minimum Price (PMP), then the PMP becomes the price of the gas for royalty purposes (the
Reference Price). There are currently 5 PMPs calculated each month. Production behind each
processing plant is subject to one of these PMPs.
Gas in British Columbia is categorized firstly into conservation (associated) and non-conservation
(non-associated) gas. Non-conservation gas is further split into three categories: Base 15, Base 12
and Base 9 gas. The key feature of the natural gas royalty regime in British Columbia is that it is a
price-sensitive regime. That is, when the Reference Price is below the Select Price 17, the royalty rate
is fixed, while at prices above the Select Price, the rate increases as prices increase.
There are three marketable natural gas by-products associated with natural gas production: Liquefied
Petroleum Gas (LPG), Condensate, and Sulphur.
There are also flat royalty rates of 20% for natural gas liquids and condensates
The Sulphur rate is 16.667%
Allowances are made for the costs incurred by the producers to transport the gas to the gas
processing plants which are the royalty collection point. These allowances are known as Producer
Cost of Service (PCOS) and Gas Cost Allowances (GCA).
PCOS covers the cost of gathering, dehydration, and compression of the Crown share of gas,
GCA covers the cost of processing the Crown Share of gas into a marketable form. GCA is
only deductible for those producers whose gas is processed at a plant owned by a producer
(as opposed to a custom processing plant) since the prices determined by the ministry for all
other gas is net of the tolls charged by third parties for this service.
These allowances are deducted from the gross royalty to a maximum of 95% of the gross royalty 18.
The calculation of royalties in British Columbia is detailed in Appendix 1.
Alberta fiscal regime
The Alberta Department of Energy is responsible for the administration of the Mines and Minerals Act
which sets out the requirements for responsible development of Alberta’s non-renewable resources.
Royalties are set by a sliding scale formula containing separate elements that account for
price and well production.
Currently the royalty rate for natural gas ranges from 5 – 36%.
NGLs (natural gas liquids) have fixed rates of 30% for C 3 and C4 while C5+ is set at 40%.
Condensate royalty is calculated using the oil royalty formula.
There are various incentive programs in place to encourage drilling and exploration as detailed on
Appendix 1.
For the purpose of calculating the royalties paid by the oil companies the Alberta Department of
Energy established the Alberta Natural Gas Reference Price which is a monthly weighted average
16
Information provided by Paul Cheruvathur, Alberta Energy, 2014
17
A parameter used in the royalty rate formula. At a reference price lower than the select price the royalty rates are fixed, while
at higher prices, the royalty rates rise as prices rise (Government of British Columbia)
18
http://www.empr.gov.bc.ca/OG/oilandgas/royalties/NaturalGasDefinitionsand%20RateDetails/Pages/default.aspx
10
May 2015: Natural Gas in Canadafield price19 of all Alberta gas sales, determined through a survey of actual sales transactions and
adjusted for deductions and amendments.
For example, as of October 2014 the Gas Reference Price was CAD 3.57/GJ (US$ 3.06/MMBtu) and
calculated as follows:
Figure 9: Alberta Natural Gas Reference Price Calculation (October 2014)
Component CAD/GJ
Nova Inventory Purchase Price-Alberta Market 3.795
Price at NGX20 (A)
Intra-Alberta Transportation Deduction (B) 0.180
Price before Pipeline Factor (C=A-B) 3.615
Pipeline Fuel/Loss Factor (D) 0.989
Price before Amendments (E=C*D) 3.573
Special Amendments (F) 0
Prior Period RP Amendments (G) 0
Calculated RP (Price before rounding) (H) 3.573
Reference Price (rounded) 3.57
Adjusted Intra-Alberta Transportation Deduction 0.178
Source: http://www.energy.gov.ab.ca/xdata/gas/refprice/rp201410.pdf
5. Production, Supply and Demand
Canada is the 5th largest gas producer in the world, with production of 154.8 Bcma in 2013 21 , a
considerable drop from the 188 Bcma peak in 2006. Domestic gas consumption reached 103.5 Bcma
in 2013, an increase of 3.5% when compared to the previous year.
Figure 10: Natural Gas Production and Consumption in Canada
Source: BP (2014)
19
http://www.energy.alberta.ca/NaturalGas/725.asp
20
NGX is an exchange and clearing agency in Alberta and a registered Derivatives Clearing Organisation
21
BP (2014)
11
May 2015: Natural Gas in CanadaWestern Canada is the major gas producing region, accounting for 98% of the output, followed by
Nova Scotia and New Brunswick. The western provinces of Alberta and British Columbia are the first
and second largest gas producing regions in Canada. Other regions produce minor volumes. The
production activity continues to focus on the liquids-rich gas plays in Alberta and British Columbia. A
new EnCana offshore project Canada (Deep Panuke) started production in September 2013 in
Eastern Canada.
In 2011 shale gas accounted for an estimated 5% of Canada’s natural gas production and may
account for up to 20% by 2020.
Production of conventional non-tight gas has more than halved from 117 Bcma in 2000 to 55 Bcma in
2012, whereas tight gas production has more than doubled in the same period from 37 Bcma to 75
Bcma22.
From 1955 to 2013 the oil and gas industry drilled 545,618 wells, of which 205,590 were gas wells. In
2013 there were 809 drilling rigs involved in gas operation activities. In February 2014 the rig count
fell to 632, of which 210 are on gas operations, whilst in February 2015 the rig count dropped to 360,
of which 176 are drilling for natural gas. 23 The number of natural gas wells drilled dropped from
approximately 17,900 in 2004 to 1,800 in 2013.
Gas is transported from the Western Canada Sedimentary Basin (WCSB), to the domestic market and
to seven major export points to the USA with total export capacity of 87 Bcma.
Figure 11: Natural Gas Production, Import and Export Points – 2013/2014
Source: http://www.cga.ca/wp-content/uploads/2015/01/Natural-gas-trade_January-2015_EN.pdf
22
National Energy Board (2013b)
23
http://www.wtrg.com/rotaryrigs.html
12
May 2015: Natural Gas in CanadaThe Canadian domestic gas market is divided geographically at the Saskatchewan-Manitoba border
into Western and Eastern Canada demand. Western Canada demand includes gas volumes
withdrawn during the recovery of natural gas liquids at straddle plants 24. Approximately 85%-90% of
the gas exiting Alberta is processed through straddle plants, which extracts ethane, NGLs and heavier
components remaining after field processing.
The East Coast demand is concentrated mainly in Ontario, in the residential sector and large
petrochemical and heavy industries.
Historically Canada’s gas production continuously exceeded domestic demand with the surplus
production exported to the USA. Traditional markets for WCSB production include Ontario, Quebec
and the US Northeast, as well as the US Midwest and Pacific Coast. Declining natural gas prices
have reduced drilling activity for conventional gas in the WCSB in the last 8 years, with production
trending down since 2006. Production in Alberta, BC and Saskatchewan totaled 174.5 Bcma (16.9
bcfd) in 2006, declining to 142.1 Bcma (13.7 Bcf/d) by 2012. The increased production of shale gas in
Marcellus and Utica (northeast US) and in the Bakken formation in North Dakota deeply affected the
dynamics of the Canadian gas market. In the case of Marcellus shale, gas production rose from 7.6
Bcma (733 MMcfd) in early 2010 to 177 Bcma (17 bcfd) in March 2015 25. The main impacts on WCSB
exports are summarised below:
Canada east coast markets started importing natural gas from the USA as it became cheaper
than domestic gas produced in the WCSB and transported by long distance pipelines. Gas
imports from the US increased from 9.7 Bcma in 2006 to volumes around 30 Bcma in 2014, which
is roughly 30% of Canada’s domestic demand.
Increased shale gas production in the US reduced the need for Canadian exports to the
Northeastern region in the US. Canadian export volumes at the Ontario and Quebec borders fell
from 23.8 Bcma in 2006 to 9.3 Bcma in the first 10 months of 2014.
A number of export pipelines in Ontario have been converted to allow for bi-directional gas flow and
allow additional imports from the US, whereas the US shale producers are building additional
pipelines to evacuate dry gas production.
6. Canada domestic gas market
Canada and Saudi Arabia jointly hold the position of 6 th largest gas markets in the world, each one
consuming 103 Bcma in 201326. Natural consumption in Canada has been flat from 2003 to 2010
around 95-97 Bcma with a 3% growth in the period 2012-2013 due to a winter colder than average
which significantly increased natural gas demand for space heating and power generation, coupled to
increased demand for gas in the production of oil sands.
The industrial sector accounts for one third of the gas consumption in Canada, followed by oil field
operations/steam production and by residential demand. The power sector accounts for only 15% of
Canada’s gas consumption due to the abundance of hydroelectricity.
In 2013 there were 6.5 million domestic consumers of natural gas, of which 6 million are in the
residential sector and nearly 500,000 in the commercial and public sectors 27.
24
Straddle Plant: a gas processing plant located on or near a gas transmission line which removes residual NGLs that remain
in the sales gas.
25
EIA (2015), National Energy Board (2013b)
26
BP (2014)
27
Canadian Gas Association: http://www.cga.ca/wp-content/uploads/2011/02/Chart-17-Natural-Gas-Customers.pdf
13
May 2015: Natural Gas in CanadaPower generation was a key mechanism in balancing markets during the 2014 storage refill season in
North America with increased natural gas-fired power generation in the US and Canada at the
expense of coal-fired power generation.
Figure 12: Natural Gas Consumption by Market Segment – 2013 (Total: 103 Bcma)
Source: Canadian Gas Association (2015b)
The National Energy Board (NEB) forecast that Canadian electricity capacity will increase at an
average annual rate of 1% from 137 GW in 2012 to 164 GW by 2035, a total growth of 22% over the
projection period.
The NEB projects a shift in the generation capacity profile with renewable energy (non-hydro)
projected to increase its share from 4 to 13%, nuclear declining from 10% to 7% and natural gas
increasing its share to nearly 22%. Based upon NEB market projections, the demand for natural gas
in the power sector would rise by another 10 Bcma by 2035.
Figure 13: Electricity Generation Capacity Forecast by Fuel Type – 2035 (Total: 164 GW)
Oil 2013 TWH gas gas consumption
Gas demand for power = 2% 97.76 15.45
2035
156.5153 24.73569
Renewable Nat Gas
Nuclear 13% 22%
2013 7%611 Delta 10 bcma
2014 617.11 Coal/Coke
2015 623.2811 4%
2016 629.5139
2017 635.8091
2018 642.1671
2019 648.5888 Hydro
52%
2020 655.0747
2021 661.6254
2022 668.2417
Source: National Energy Board (2013b)
14
May 2015: Natural Gas in CanadaNatural gas demand in oil sands operations
A growing market segment for natural gas is its use in oil sands operations. There are two
predominant methods to extract hydrocarbons from oil sands: traditional pit mining on the surface and
in-situ drilling underground. Surface mining has been declining because approximately 80% of
bitumen reserves are situated too deep underground to be accessible by surface mining. In-situ
extraction injects steam into underground formations to soften the bitumen and pumps it to the
surface through wells. Natural gas is used to produce steam for injection and for producing in-situ
electricity. It is also used as a source of hydrogen to upgrade bitumen into synthetic crude oil. 28
In 2013 the production of oil sands was 1.98 MMb/d, and the consumption of natural gas in oil sands
operations reached 17 Bcma (1.6 Bcfd) in 2013, an increase of 6.8% when compared to 2012 (Figure
14).
According to the National Energy Board, in situ projects consume about 1,200 cubic feet (34 m 3) of
natural gas per barrel of bitumen whereas integrated mining projects require 700 cubic feet (20 m 3)
per barrel.
Figure 14: Natural Gas Consumption in Oil Sands Operations
Source: (National Energy Board, 2013b)
The medium term outlook for oil sands projects which have not yet started construction does not look
very promising under the current low oil prices. In October 2014, the International Energy Agency
(IEA) concluded that one in four new Canadian oil projects would be in jeopardy if crude prices fell
below US$80/bbl for any extended period of time. More recently IEA’s medium-term oil market
forecast, published in February 2015, predicted that Canada’s oil production will be cut by 430,000
barrels/day, which represents more than 10% of the current production, by 2020.
While Canadian oil sands projects that have already had capital commitments will go ahead, new
projects “are unlikely to be sanctioned and will likely be delayed,” the IEA said 29. “Companies will be
much more restrained in committing cash to fund expensive projects in the current price
environment.”
28
http://www.eia.gov/countries/cab.cfm?fips=ca
29
IEA (2015)
15
May 2015: Natural Gas in CanadaThe Canadian Association of Petroleum Producers estimated in January 2015 that oil sands capital
budgets will fall to US$20 billion in 2015, a decrease of $6.5 billion from 2014.
The demand for natural gas in oil sands operations is expected to grow to:
23.7 Bcma (2.3 bcfd) in 2015 for a production of 2.4 MMb/d of bitumen, assuming a 50%:50%
ratio for integrated and in situ projects.
27-31 Bcma by 2020, for a production of 3.1 MMb/d of bitumen, which already takes into account
a reduction of 430,000 b/d as per IEA projections.
7. Other potential demand levers in the domestic market
Apart from the oil sands business, the opportunity for natural gas to displace competing fuels in
traditional space-heating and industrial markets in Canada seems to be relatively limited. Other
potential sources for demand growth are the substitution of 4,120 MW of coal fired power generation
in Alberta30 and the use of gas for transportation and as feedstock for petrochemicals, but the latter
options require long lead time to become material. For example, Ziff Energy estimates that the use of
gas in the transportation sector would grow slowly from currently 1 Bcma to 3 Bcma by 2050, whereas
pipeline lease and fuel consumption would grow from 10 Bcma to 30 Bcma in the same period. Gas
for power generation would rise from 15 Bcma in 2013 to 55 Bcma by 2050.
In the short/medium term the National Energy Board forecast a domestic demand growth of 10 Bcma
in the period 2013-2016, which largely derives from the utilisation of natural gas in the oil sands
business. After balancing demand with the projected increase in supply, there is an exportable
surplus of 57 Bcma in 2013, which drops to 53 Bcma by 2016. The exportable surplus would be
sufficient to produce 36 mtpa of LNG after deducting the volumes of gas used as a fuel in the
liquefaction process (circa 10% of the feedgas) if there is no room to export via pipeline to the US.
Figure 15: Medium Term Natural gas demand forecast 2014-2016
Source: (National Energy Board, 2014b)
30
http://en.wikipedia.org/wiki/List_of_generating_stations_in_Alberta
16
May 2015: Natural Gas in CanadaYou can also read