Reducing emissions in the Mexican power sector: Economic and political feasibility analysis of policy mechanisms - Kth Diva ...
←
→
Page content transcription
If your browser does not render page correctly, please read the page content below
Reducing emissions in the Mexican power
 sector: Economic and political feasibility
 analysis of policy mechanisms

 Author: Camila Barragán
 Supervisor: Maria Xylia

 Master of Science Thesis
 KTH School of Industrial Engineering and Management
 Energy Technology EGI_2017-0087-MSC
 Division of Energy and Climate Studies (ECS)
 SE-100 44 STOCKHOLM
Master of Science Thesis EGI_2017-0087-MSC

 Reducing emissions in the Mexican power
 sector: Economic and political feasibility
 analysis of policy mechanisms
 Camila Barragán

Approved Examiner Supervisor
29.08.2017 Prof. Semida Silveira Maria Xylia
 Commissioner Contact person

Abstract
A comparative assessment of market-based climate policy instruments –carbon tax vs. ETS– for emission
reduction in the Mexican electricity sector is presented. Model-based scenarios of different tax and cap
levels were simulated on an existing Balmorel partial equilibrium model populated with data from the
Mexican electricity system. The simulation results served to compare the performance of both instruments
according to economic criteria. The analysis was further developed with the empirical evidence obtained
from international experiences with both instruments, allowing to conclude on the first-best normative
instrument based on an economic approach. The assessment was complemented with a political feasibility
perspective, through the development of an on-line survey and in-depth interviews with representatives of
the relevant stakeholder groups within the country. The first-best instrument was not favoured by the
stakeholders, but the study allowed to hint a second-best alternative with a better probability of being fully
implemented. The results of this project are useful to guide the necessary debate surrounding the selection
of the most appropriate carbon-pricing mechanism for emissions reduction in the country, in particular in
the electricity sector.
A wide-coverage carbon tax with no exemptions and with revenue-recycling mechanisms, gradually
increasing to 15 USD/tCO2 would be the first-best instrument from the economic perspective. However,
when complementing the analysis with the political feasibility perspective, the most appropriate instrument
for emissions reduction in the Mexican electricity sector is an emissions trading system with the cap set as
the conditional target of the INDCs, with auctioned allowance allocation and an auctioning floor-price, set
at a similar but lower value than the equivalent carbon tax. Such an instrument is in line with the priorities
of the stakeholder groups and would generate a stable price signal, allowing for the earmarking of carbon
revenue, and would avoid exempting natural gas from carbon pricing.

Keywords Mexico, market-based instruments, carbon-pricing, climate policy, electricity, political
economy, Balmorel
Acknowledgements
Thank you to Professors Semida Silveira and Sanna Syri for inspiring my interest in energy and climate
policy, and to Maria Xylia and Samuel Cross for your time, guidance and support.
Thank you to Dr. Enrique Ortiz Nadal for suggesting a research topic of relevance to Mexico.
Thank you to Dr. Lise-Lotte Pade for your trust and guidance during the initial phases of this thesis, to Dr.
Mikael Togeby for allowing me to use the Mexico Balmorel model, and special thanks to Amalia Pizarro
Alonso for your patience, time and support with the modeling tasks, without which this thesis would not
have been possible.
Thank you to all survey and interview respondents, as well as those friends who offered your network of
contacts to reach more experts.
List of Abbreviations
CCE Consejo Coordinador Empresarial (Enterprise coordination council)
CEL Certificados de Energías Limpias (Clean energy certificates)
CENACE Centro Nacional de Control de Energía (National TSO/ISO)
CFE Comisión Federal de Electricidad (State-owned electric utility)
CICC Comisión Intersecretarial de Cambio Climático (Inter-ministerial commission on
 climate change)
CONCAMIN Confederación de Cámaras Industriales (Confederation of industrial chambers)
COP Conference of the Parties, decision-making body of the UNFCCC
ETS Emissions Trading Scheme
GHG Greenhouse gases
INDC Intended Nationally Determined Contributions
INECC Instituto Nacional de Ecología y Cambio Climático (National institute for
 ecology and climate change)
IPCC Intergovernmental Panel on Climate Change
LGCC Ley General de Cambio Climático (General law on climate change)
NGO Non-Governmental Organization
PIE Productor Independiente Energía (Independent energy producer)
PRODESEN Programa de Desarrollo del Sistema Eléctrico Nacional (National electricity
 system development program)
RENE Registro Nacional de Emisiones (National emissions registry)
SEN Sistema Eléctrico Nacional (National electricity system)
SENER Secretaría de Energía (Mexican Ministry of energy)
SEMARNAT Secretaría de Medio Ambiente y Recursos Naturales (Mexican Ministry of
 environment and natural resources)
SHCP Secretaría de Hacienda y Crédito Público (Mexican Ministry of finance and
 public credit)
TSO/ISO Transmission System Operator/Independent System Operator
UNFCCC United Nations Framework Convention on Climate Change

List of Units
tCO2 / tCO2eq Metric ton of carbon dioxide / Concentration of a given mixture of GHG
 which would cause the same amount of radiative forcing as one tCO2
kt / Mt Kiloton (103 ton) / Megaton (106 ton)
GJ / TJ Gigajoules (109 joule) / Terajoules (1012 joule)
MW / GW Megawatts (106 watt) / Gigawatts (109 watt)
kWh / MWh Kilowatt·hour /Megawatt·hour (103 kWh)
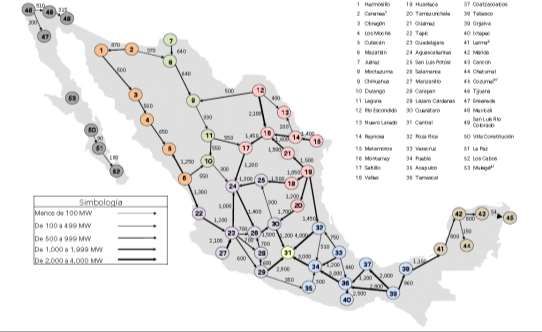
List of Figures
Figure 1. Social loss for a carbon tax (LT) and for an ETS (LE) when the marginal abatement costs (MAC)
curve is uncertain, for varying MAC and marginal abatement benefits (MAB) curve steepness. P*:
equilibrium price based on expected MAC curve; P**: real equilibrium price; PE: permit price in an ETS;
AT: abatement with a carbon tax; MAC*: expected abatement costs curve; MAC**: real abatement costs
curve. Based on (Baumol and Oates, 1988)........................................................................................................... 13
Figure 2. Diagram depicting the methods of the research ................................................................................. 16
Figure 3. Expected national electricity demand (2015-2030). Source: (SENER, 2016a) ............................... 18
Figure 4. Fuel price trends used for the model-based scenarios (2015-2030). Source: (SENER, 2017). .... 19
Figure 5. Cap and tax scenarios defined to the model-based simulations. ....................................................... 20
Figure 6. Structure of the Mexican electricity sector and participation of CFE subsidiaries. Adapted from
(International Energy Agency, 2016), (Comisión Federal de Electricidad, 2016). .......................................... 23
Figure 7. Share of energy sources in primary energy production (2015). Source: (SENER, 2015a) ............ 24
Figure 8. Secondary energy imports by type of energy carrier (2015), in PJ and %. Source: (SENER, 2015a)
....................................................................................................................................................................................... 24
Figure 9. Share of Mexican GHG emissions per sector (2013). Source:(“Tabla del Inventario Nacional de
Emisiones de Gases y Compuestos de Efecto Invernadero 2013,” 2013) ....................................................... 25
Figure 10. Historical GHG emissions (1990-2010), including LULUCF. Source: (UNFCCC, 2013) ......... 25
Figure 11. The 53 transmission regions in Mexico and their interconnections (2015). Taken from: (SENER,
2016a) ........................................................................................................................................................................... 26
Figure 12. CFE electricity sales by user type. Source: (SENER, 2015a) ........................................................... 27
Figure 13. Policy instruments impacting the electricity sector and its GHG emissions performance. ........ 31
Figure 14. Installed capacity by technology in year 2021, for the REF scenario and the PRODESEN 2016
and 2017. Source: Balmorel modeling, (SENER, 2016a) and (SENER, 2017). .............................................. 32
Figure 15. Installed capacity by technology in year 2030, for the REF scenario and the PRODESEN 2016
and 2017. Source: Balmorel modeling, (SENER, 2016a) and (SENER, 2017). .............................................. 32
Figure 16. Electricity generation by technology in year 2021, for the REF scenario and the PRODESEN
2016 and 2017. Source: Balmorel modeling, (SENER, 2016a) and (SENER, 2017) ..................................... 33
Figure 17. Electricity generation by technology in year 2030, for the REF scenario and the PRODESEN
2016 and 2017. Source: Balmorel modeling, (SENER, 2016a) and (SENER, 2017). .................................... 33
Figure 18. GHG emissions from the Mexican power sector (2018-2030), by scenario. ................................ 34
Figure 19. Tax level or emission permit price, by scenario. ................................................................................ 35
Figure 20. Installed capacity by technology (2018-2030), for the CAPH, TAXE and TAXM scenarios. ... 35
Figure 21. Electricity generation by technology (2018-2030), for the CAPH and TAXM scenarios........... 35
Figure 22. Shares of clean energy generation (2018-2030) for the REF, CAPH, TAXE and TAXM scenarios.
....................................................................................................................................................................................... 36
Figure 23. Supply and demand load curve for four representative weeks, for the REF scenario (2018). ... 36
Figure 24. Supply and demand load curve for four representative weeks, for the REF scenario (2030). ... 37
Figure 25. Supply and demand load curve for four representative weeks, for the TAXM scenario (2030).
....................................................................................................................................................................................... 37
Figure 26. Annualized investments in electricity transmission (2018-2030) for the different scenarios. .... 37
Figure 27. Annualized total system costs (2018-2030) for the REF scenario, in million USD. .................... 38

 5
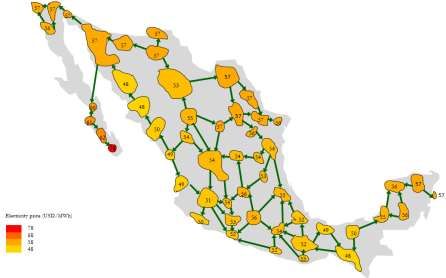
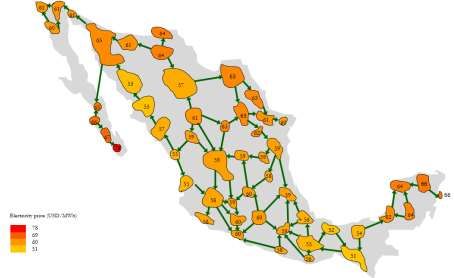
Figure 28. Annualized total system costs (2018-2030) for the CAPH scenario, in million USD. ................ 38
Figure 29. Annualized total system costs (2018-2030) for the TAXM scenario, in million USD. ............... 38
Figure 30. Annualized total system costs (2018-2030) for the TAXH scenario, in million USD. ................ 38
Figure 31. Average electricity prices (2018-2030) for the different tax and cap scenarios............................. 39
Figure 32. Average electricity prices for year 2030, per region. TAXM scenario. ........................................... 39
Figure 33. Average electricity prices for year 2030, per region. TAXH scenario ............................................ 40
Figure 34. GHG emissions in year 2030, for the REF, CAPH and TAXM scenarios, and a comparison with
a zero-level tax on natural gas. ................................................................................................................................. 40
Figure 37. Installed capacity in year 2030, for the REF, CAPH and TAXM scenarios, and a comparison
with a zero-level tax on natural gas. ........................................................................................................................ 41
Figure 38. Clean Energy generation shares for the TAXM with zero-level rate on natural gas scenario.... 41
Figure 39. Annualized total system costs for the REF, CAPH and TAXM scenarios, and a comparison with
a zero-level tax rate on natural gas, in million USD. ............................................................................................ 41
Figure 40. GHG emissions (2018-2030) for TAXM and CAPH scenarios with +/-10% projected electricity
demand. ....................................................................................................................................................................... 42
Figure 41. TAXM and emission permit price for the CAPH scenario with +/- 10% projected electricity
demand. ....................................................................................................................................................................... 42
Figure 42. Installed capacity by technology (2018-2030), for the CAPH scenario with +/- 10% projected
electricity demand. ..................................................................................................................................................... 43
Figure 43. Installed capacity by technology (2018-2030), for the TAXM scenario with +/- 10% projected
electricity demand. ..................................................................................................................................................... 43
Figure 44. GHG emissions (2018-2030) for TAXM and CAPH scenarios with +/-10% projected fossil fuel
prices. ........................................................................................................................................................................... 44
Figure 45. Emission permit price for the CAPH scenario with +/- 10% projected fossil fuel prices. ....... 44
Figure 46. Fuel consumption (2018-2030) for the CAPH scenario with +/- 10% fossil fuel prices........... 45
Figure 47. Installed capacity by technology (2018-2030) for the CAPH scenario with the existing and a low
discount rate (5%). ..................................................................................................................................................... 45
Figure 48. Electricity generation by technology (2018-2030) for the CAPH scenario with the existing and a
low discount rate (5%). ............................................................................................................................................. 46
Figure 49. GHG emissions (2018-2030), for the CAPH and TAXM scenarios with the existing and a low
discount rate (5%). ..................................................................................................................................................... 46
Figure 50. Annualized total system costs (2018-2030), for the CAPH scenario with the existing and a low
discount rate (5%). ..................................................................................................................................................... 46
Figure 51. Average electricity prices (2018-2030), for the CAPH and TAXM scenarios with the existing and
a low discount rate (5%). .......................................................................................................................................... 47
Figure 52. Installed capacity by technology (2018-2030) for the CAPH scenario with a ‘normal’ and a low
availability of natural gas. .......................................................................................................................................... 47
Figure 53. Installed capacity by technology (2018-2030) for the TAXM scenario with a ‘normal’ and a low
availability of natural gas. .......................................................................................................................................... 48
Figure 54. Electricity generation by technology (2018-2030) for the CAPH scenario with a ‘normal’ and a
low availability of natural gas. .................................................................................................................................. 48
Figure 55. Electricity generation by technology (2018-2030) for the TAXM scenario with a ‘normal’ and a
low availability of natural gas. .................................................................................................................................. 48

 6
Figure 56. GHG emissions (2018-2030), for the CAPH and TAXM scenarios with a ‘normal’ and a low
natural gas availability. ............................................................................................................................................... 49
Figure 57. Average electricity prices (2018-2030), for the CAPH and TAXM scenarios with a ‘normal’ and
a low natural gas availability. .................................................................................................................................... 49
Figure 58. Survey results: instrument preferences per interest group. .............................................................. 57
Figure 59. Survey results: preferences for the use of carbon revenue. .............................................................. 58
Figure 60. Survey results: evaluation of the existing carbon tax level per interest group............................... 58
Figure 61. Survey results: preferred tax level range (pesos/tCO2) per interest group. .................................. 58
Figure 62. Survey results: responses to “should a tax be levied on natural gas based on its carbon contents?”,
per interest group. ...................................................................................................................................................... 59
Figure 63. Survey results: preferences regarding allowance allocation to the electricity sector, by interest
group. ........................................................................................................................................................................... 59
Figure 64. Survey results: preferences regarding ETS design features. ............................................................. 60
Figure 65. Survey results: preferences regarding carbon-pricing instruments co-existence, per number of
survey responses......................................................................................................................................................... 60
Figure 66. Challenges to reducing GHG emissions from the Mexican power sector, per number of survey
responses. .................................................................................................................................................................... 61

 7
List of Tables
Table 1. Technology costs used for the model-based scenarios (2015-2030). Source: (International
Renewable Energy Agency, 2016; SENER, 2016a, 2017) ................................................................................... 19
Table 2. Sample description. Characteristics of the respondents. ...................................................................... 21
Table 3. Installed electricity generation capacity (2015), in MW. Source: (SENER, 2015a) ......................... 25
Table 4. Electricity generation by technology (2015), in GWh. Source: (SENER, 2015a) ............................ 26
Table 5. Fuels used for electricity generation in CFE power plants (2015), in PJ. (Note: Data from the table
is an energy balance). Source: (SENER, 2015a).................................................................................................... 27
Table 6. GHG emissions by the Mexican power sector for year 2013, by technology. Source: (“Tabla del
Inventario Nacional de Emisiones de Gases y Compuestos de Efecto Invernadero 2013,” 2013) ............. 27
Table 7. Number of users and average electricity consumption per CFE user group (2015). Source:
(SENER, 2015a)......................................................................................................................................................... 28
Table 8. Carbon tax for different fossil fuels as set in the IEPS. Source: (SHCP, 2013), (SHCP, 2014),
(SHCP, 2016) and (SEMARNAT, 2014). .............................................................................................................. 30
Table 9. System costs for the REF scenario and the PRODESEN 2017, in million USD. Source: Balmorel
and (SENER, 2017). .................................................................................................................................................. 34
Table 10. Comparison of the performance of a carbon tax and an ETS based on model-based scenarios of
the Mexican electricity sector. .................................................................................................................................. 50
Table 11. Learnings for ETS design based on international experiences. ........................................................ 55
Table 12. Comparison of the performance of a carbon tax and an ETS based on international experiences.
....................................................................................................................................................................................... 56

 7
Contents
Acknowledgements...................................................................................................................................................... 3
List of Abbreviations ................................................................................................................................................... 4
List of Units .................................................................................................................................................................. 4
List of Figures............................................................................................................................................................... 5
List of Tables ................................................................................................................................................................ 7
1 Introduction............................................................................................................................................................... 9
 1.1 Motivation................................................................................................................................................... 9
 1.2 Objective ................................................................................................................................................... 10
2 Theoretical background ................................................................................................................................... 11
 Policy instruments for GHG emissions reductions ........................................................................... 11
 Analytical framework for climate policy instrument assessment ..................................................... 12
3 Methods.............................................................................................................................................................. 16
 Model-based scenarios for policy implication analysis ...................................................................... 17
 Analysis of international experiences with carbon tax and ETS ...................................................... 20
 Online survey and semi-structured interviews for assessing political feasibility ........................... 21
4 The Mexican electricity system and climate policy: history and current state......................................... 22
 The institutional framework surrounding the electricity sector ....................................................... 22
 The electricity system .............................................................................................................................. 24
 The climate policy.................................................................................................................................... 28
5 Results................................................................................................................................................................. 32
 Modeling results ....................................................................................................................................... 32
 Analysis of international experiences ................................................................................................... 51
 Survey and interview results................................................................................................................... 57
6 Conclusions and policy design recommendations....................................................................................... 64
7 References .......................................................................................................................................................... 66
8 Appendix ............................................................................................................................................................ 73
 Questions to the on-line survey ............................................................................................................ 73
 Answers to the on-line survey ............................................................................................................... 76
 Guiding questions for the interviews ................................................................................................... 85
 List of interviewees.................................................................................................................................. 85

 8
1 Introduction
1.1 Motivation
Anthropogenic greenhouse gases (GHG) emissions and their atmospheric accumulation has been
increasing average global temperature since the mid-20th century. This change in climatic conditions impacts
upon natural and human systems, and threatens to cause substantial damages in the short, medium and
long-term (Intergovernmental Panel on Climate Change, 2014).
As global consensus is reached on the urgency of climate change mitigation, interest has gone to the policies
required to reduce GHG emissions. Climate change mitigation is more complex than traditional
environmental problem-solving: the impacts are global and long-term and there is a lot of uncertainty
surrounding its consequences. Furthermore, the costs and benefits of mitigation policies are unevenly
distributed both geographically and temporally (Goulder and Pizer, 2006). The Paris Agreement signed in
20151 at the United Nations Framework Convention on Climate Change (UNFCCC) Conference of the
Parties (COP) has set the world on track to international climate cooperation to keep the global average
temperature “well below 2°C” (United Nations, 2015).
Mexico was the second country in the world to adopt a comprehensive legislation package on climate
change, after the UK (International Energy Agency, 2016) (SEMARNAT, 2016a), and the first developing
country2 to set an absolute emissions reduction target for 2050 (ECOFYS and Climate Analytics, 2012).
There is good availability of emissions data and an institutional framework which provides a solid ground
for climate policy-making (ECOFYS and Climate Analytics, 2012). Mexico has been considered the country
with the highest mitigation capability among a group which also comprises Brazil, India, China and South
Africa, because it has “the highest GDP3 per capita, the highest HDI4, the lowest consumption share of
coal, and a relatively high proportion of the service sector” (Rong, 2010).
The power sector accounts for approximately 20% of the national emissions. The recent energy reform
(2013) structurally transformed the power sector and created an electricity market, offering the possibility
to introduce cost-efficient market-based instruments to reduce the GHG emissions from the electricity
generation. Timid attempts to introduce a carbon tax and a voluntary tradeable emissions’ permits system
have been made. However, the carbon tax is far below the optimal carbon price and the tradeable permits
system is currently in an exercise phase, prior to the pilot phase.
Economic research on climate policy instruments has traditionally been normative, focusing on selecting
and designing an instrument which will maximize the social welfare (Goulder and Pizer, 2006). Although
valuable, this approach lacks a positive evaluation of the political feasibility of such optimally designed
instruments, as political barriers frequently lead to selecting or designing sub-optimal alternatives to these
instruments (Jenkins, 2014).
The motivation for this thesis is to contribute to Mexico’s climate change mitigation efforts by providing
an assessment of two climate market-based instruments – a carbon tax and tradeable emission permits –
based on following complementary approaches: determine the normative ideal instrument given the
economical context and structure of the power sector, while assessing its political feasibility and exploring
the possible sub-optimally designed instruments which could emerge. This will guide the recommendations
on which of these instruments should and could, from the perspective of the electricity sector, become the
cornerstone of Mexican climate policy.

1 It was ratified in October 2016 and entered into force in November 2016.
2 A categorization based on a country’s basic economic conditions, as defined in the UN’s World Economic Situation and
Prospects report (United Nations, 2017).
3 Gross domestic product.
4 Human development index.

 9
1.2 Objective This project aims to assess and compare the cost-effectiveness of a carbon tax and an emissions trading scheme (ETS) for the Mexican electricity sector, as well as explore the political feasibility and most appropriate measures for introducing new policy instruments for emission reduction in the country. The research question is: Which policy instrument, carbon tax or ETS, is the most appropriate for reducing GHG emissions in the Mexican power sector, in terms of economic impacts and political feasibility? The research question can be elaborated in the following way: Which instrument (carbon tax/ETS) would provide the most cost-effective way of reducing GHG emissions in the Mexican power sector? Is it politically feasible to introduce a carbon tax or an ETS in Mexico? The factors determining the appropriateness of GHG emission reduction instruments for the Mexican power sector are identified through: (i) the development model-based scenarios of the different instruments in the Mexican electricity sector; (ii) a literature review of the empirical evidence of international experiences; and (iii) an on-line survey and in-depth interviews with representatives of the relevant stakeholder groups within the country. The results of the model-based scenarios’ and the empirical evidence of international experiences are analyzed per a set of economic effectiveness criteria. The interviews are analyzed according to a framework of political feasibility adopted from the political economy public choice approach. The report is organized as follows: The next chapter will introduce the policy instruments and the framework for their assessment. Chapter 3 will outline the methods of research, followed by Chapter 4 which describes the history and current state of the Mexican electricity system and climate policy. Chapter 5 presents the results. The final conclusions and policy recommendations are presented in Chapter 6. 10
2 Theoretical background
This section aims to introduce the objects of our analysis (emission trading system and carbon tax) by
placing them in the context of climate policy instruments taxonomy. Furthermore, it presents the analytical
framework with which the instruments will be assessed.
 Policy instruments for GHG emissions reductions
The problem of how to reduce or regulate the activities carried out by an entity or group of entities which
negatively affects others (for example by emitting GHG emissions) but simultaneously provides social
benefits (for example providing energy services) is a complex one. A range of instruments have emerged to
tackle this challenge. In its taxonomy of domestic policy instruments to tackle climate change, Stavins (1997)
divides them into two categories: command-and-control instruments and market-based instruments
(Stavins, 1997).
2.1.1 COMMAND AND CONTROL INSTRUMENTS
Command and control instruments “set standards and directly regulate the activities of firms and individuals” (Stavins,
1997). The goal set by the regulatory agency can take many forms: emission limits, bans, technology
standards, etc. (Stavins, 1997). Command and control instruments may achieve emission reductions, but
generally do so in an inefficient way, as little to no flexibility is given to firms. There are situations when
command and control instruments could be efficient relative to alternative instruments, particularly if the
latter have high transaction costs (Stavins, 1997).
2.1.2 MARKET-BASED INSTRUMENTS
Market-based instruments such as taxes and tradeable emission permits are preferred when there is
important variation in the marginal abatement costs across economic sectors and subsectors (as is the case
for GHG emissions), because these instruments equalize the costs and ensure emission reductions are
achieved in the most cost-efficient way (Hansjürgens, 2005).
A main difference between taxes and tradeable permits is the subject to whom they assign property rights.
If property rights over the environment are assigned to the government (Pigouvian approach), it has the
right to charge a fee, the tax, for its use (Convery, 2015). On the other hand, property rights can be allocated
to emitters and those affected by emissions (Coasian approach), expecting they will reach an optimal
emission reduction through bargaining (Coase, 1960); in practice, the government assigns limited property
rights over pollution to emitters and then facilitates the negotiation between them (Convery, 2015).
In the context of climate change mitigation, these two instruments are also called carbon pricing instruments,
as they price carbon either directly (carbon tax) or indirectly (emissions trading system, ETS) (World Bank
Group, 2016).
PIGOUVIAN TAX
A Pigouvian tax (in the context of GHG emissions reduction) is the amount of money per unit of emissions
which corresponds to the aggregate marginal damage imposed on society at the efficient emission level (i.e.
emission level corresponding to the crossing of the marginal abatement costs and marginal abatement
benefits curves) (Kolstad, 2000). The role of a Pigouvian tax is to “internalize the externalities”, by making
the emitting firm pay for the damage it imposes on others (Baumol and Oates, 1988). As emitting becomes
more expensive, demand for the “production of emissions” (either from the firm itself or from final
consumers) is reduced.
A tax can be applied at different points of the fossil fuel utilization chain, ranging from upstream fuel
extraction to mid-stream fuel-to-energy conversion to downstream end use (Stavins, 1997). The tax may be
levied on the energy content or on the carbon content, although for emissions reduction a tax on the carbon
content (carbon tax) is significantly less costly (Stavins, 1997). A very important component of carbon tax
design lays in the utilization of revenue: 1. The tax revenue can be directed towards specific earmarked
environmental programs, 2. the revenue can become part of the general government budget, or 3. the
revenue is used to reduce existing taxes (such as income-tax) or returned in the form of tax rebates, the tax

 11
system remaining overall revenue neutral 5 (Andersen, 2009; Carl and Fedor, 2016). The use of carbon revenue
in the majority of countries is a mix of these alternatives (Carl and Fedor, 2016). Switzerland is the country
with the largest share of revenue (33%) from its carbon tax to be earmarked for environmental spending
(Carl and Fedor, 2016). Examples of countries where carbon tax revenue goes to general spending are
Ireland and Iceland (Carl and Fedor, 2016). Nordic countries (Sweden, Denmark, Finland, Norway)
launched their revenue neutral environmental tax reforms (ETR) in the 90s (Bosquet, 2000), and the most
recent example of such kind of carbon revenue utilization is presented by the British Columbia carbon tax
(Murray and Rivers, 2015).
TRADEABLE PERMITS
In an emission permits trading system an emissions quota is set and permits to emit are allocated to the
actors within the scheme (Baumol and Oates, 1988). The emitting entities decide – based on the market-
clearing shadow price that naturally sets as a function of supply and demand – whether to introduce new
abatement measures or to buy emission permits (Hansjürgens, 2005). Entities with high abatement marginal
costs will prefer to buy permits, whereas entities with lower abatement marginal costs will chose to abate
and sell the excess permits; emissions are reduced where it is cheaper to do so (Hansjürgens, 2005). Under
such system, and as opposed to a carbon tax, emissions can never go over the threshold, independently of
economic growth or inflation (Baumol and Oates, 1988).
Emission trading systems can be of two forms: credit-based or cap-and-trade (Hansjürgens, 2005). A credit-
based system has a strong command-and-control component: all entities must comply with a specific
emissions standard set by the regulatory agency, and can trade with the emission permits that are above this
threshold (Hansjürgens, 2005). A cap-and-trade system is fully market-based: all of the entity’s emissions
can be traded (Hansjürgens, 2005). “First generation” emission trading systems (Lead Trading Program and
a variety of air quality policies in the 1970s in the U.S.) were credit-based systems (Hansjürgens, 2005). The
first cap-and-trade system was introduced with the SO2 allowance trading program in the U.S. (1995), and
was for long the “most important experience in emissions trading” [11]. The European Emission Trading
Scheme (ETS) was the first cap-and-trade system to deal with GHG emissions (Hansjürgens, 2005).
Emission trading systems may also be categorized according to the type of cap: absolute or relative
(Weishaar, 2007). An absolute cap, as the name suggests, simply means to express a cap in terms of
maximum allowed emissions in the system (Weishaar, 2007). A relative cap is expressed in terms of
emissions per GDP (Zeng et al., 2016). Emission permits may be allocated to firms for free or through an
auction (Morgenstern, 2005). Free permits can be allocated according to historical emissions (usually called
grandfathering) or based on relative production standards (Weishaar, 2007). As with the carbon tax, emissions
can be capped at different points of the fossil fuel chain (Morgenstern, 2005).
It has been argued that real-world emissions trading systems are likely subject to extreme price variations
(Borenstein et al., 2015). A well designed price-collar reduces the risk of price volatility (Schmalensee and
Stavins, 2015). A price floor ensures a stable price signal for low-carbon investments, effectively dealing
with economic crisis as well as with the interaction with other climate policies (International Carbon Action
Partnership, 2017). An alternative stability mechanism is a quantity collar (price and ceiling on the amount
of allowances available in the market), such as the market stability reserve (MSR) which has been proposed
for the EU ETS (International Carbon Action Partnership, 2017).
 Analytical framework for climate policy instrument assessment
The assessment of climate policy instruments is traditionally performed through a normative economic
approach: what is the most cost-efficient instrument, which optimally distributes the costs and benefits of the policy? Such an
assessment can be complemented with a positive6 political economy evaluation of the instruments in terms
of its political feasibility. In this line, Stavins (1997) argues that the most important assessment criteria for
climate policy instruments are efficiency, distributional effects, and political feasibility (Stavins, 1997). A
similar framework will be used in this research, assessing the instruments from the economic and political
feasibility approaches, using the criteria described below.

5 Proponents of a revenue neutral aim for an environmental tax reform which shifts the taxation burden from ‘goods’
(income) to ‘bads’ (emissions) (Andersen, 2009).
6 Normative theory defines what should be, positive reality describes what is in a neutral way.

 12
2.2.1 ECONOMIC APPROACH
Economic efficiency comes into play in various stages of the pollution control policy design. Initially, a
desirable efficient amount of pollution must be determined – a level of pollution which balances the benefits
obtained by society from the goods and services produced by the emitting entity against the benefits
obtained from protecting the environment from such pollution (Kolstad, 2000). Once this level of pollution
has been set, the responsibility for emissions control must be allocated to the emitting entities in an efficient
way (Kolstad, 2000): equalizing marginal abatement costs (Russell, 2001). The latter is one of the most
compelling arguments for using market-based instruments. However, efficiency is not the sole economic
metric, and the relevant economic perspective criteria are defined as follows:
STATIC EFFICIENCY
In a static setting, it is assumed that there is an constant number of emitters with a fixed level of production,
and that competition among the producers is perfect (Russell, 2001). To be efficient in this context simply
means maximizing social welfare, and more specifically reducing emissions in the most cost-effective way
using existing abatement technology (Duval, 2008). If the marginal cost and benefit curves of emissions
abatement are known, it is possible to obtain the optimal point of static efficiency, around which a policy
instrument should be designed. The analysis of welfare maximization is usually performed with the Pareto
criterion, which states that resource allocation is efficient “if there is no feasible reallocation that can raise the welfare
of one economic agent without lowering the welfare of some other economic agent” (Black et al., 2009).
In a situation of perfect foresight and certainty, there would be no fundamental difference between the
instruments, as the carbon tax and the carbon shadow price set by the market in an ETS are equivalent
(Baumol and Oates, 1988; Speck, 1999). However, uncertainty in both the marginal abatement cost and
benefits curves is the norm, and deviations from the optimal level of tax or of cap are to be expected. It
has been shown (see Figure 1) that in such situations a tax is to be preferred for steep marginal cost curves
and flat marginal benefit curves (social loss associated with an ETS is larger than for the tax), while the
opposite is true for an ETS (Baumol and Oates, 1988; Weitzman, 1974).

 $/unit $/unit
 PE MAC**

 MAC*

 LT LE
 MAC* P* MAC**
 P**
 P* P** LE
 MAB* PE LT

 MAB*

 0 Abatement 0 Abatement
 AT A** A* A* A** AT
 (units) (units)
Figure 1. Social loss for a carbon tax (LT) and for an ETS (LE) when the marginal abatement costs (MAC) curve is uncertain, for
varying MAC and marginal abatement benefits (MAB) curve steepness. P*: equilibrium price based on expected MAC curve; P**: real
equilibrium price; PE: permit price in an ETS; AT: abatement with a carbon tax; MAC*: expected abatement costs curve; MAC**: real
abatement costs curve. Based on (Baumol and Oates, 1988).

ENVIRONMENTAL EFFECTIVENESS
In response to the uncertainty in costs and benefits which surrounds GHG emission abatement policy-
making, the criterion of environmental effectiveness will be included in the present assessment. This is

 13
particularly important when assessing a carbon tax, since even a tax set at a theoretically optimal level could
result in lower emission abatement than intended, posing a serious threat of not achieving the national
emissions target.
IMPACTS ON INDUSTRY COMPETITIVENESS
The risk of a loss of international competitiveness of the energy-intensive industries has been a core concern
of environmental policy-making since the initial environmental tax reforms (ETR) in the beginning of the
90s (Andersen et al., 2007). This fear has been extended to other carbon pricing mechanisms such as the
ETS. A change in the international competitiveness of a company can be defined as a “change in operating
margin resulting from a change in output, and/or a change in costs, and/or a change in prices” (European Commission
Directorate General for the Environment et al., 2006). However, this refers only to individual impact on
companies. If used as a criterion for policy mechanism evaluation, it is important to consider the overall
impact on the country (Andersen et al., 2007). A better indication of competitiveness decrease is a
modification in investment decisions or in trade patterns at national level (Reinaud, 2008).
DYNAMIC EFFICIENCY
In a dynamic setting the number of emitters, their level of production, their abatement technologies, etc.,
are changing in reaction to endogenous (climate policy) or exogenous (changes in consumer preferences)
factors (Russell, 2001). Economic growth and inflation have an additional dynamic effect (Hansjürgens,
2005). It is difficult to define an optimal course of action leading to dynamic efficiency (Russell, 2001);
however, an assessment of the dynamic efficiency of a policy instrument can be approximated by
determining the level up to which it provides R&D and technology diffusion incentives (Duval, 2008).
DISTRIBUTIONAL EFFECTS
Distributional effects refer to how the costs and benefits of a policy instrument are distributed through
different segments of society (Fullerton, 2008). Instruments are said to be regressive if the poorer segments
of society bear higher costs and lower benefits than richer segments of society, the opposite being true for
a progressive instrument (Black et al., 2009). As far as the distributional effects are concerned, a progressive
instrument is better than a regressive instrument.
The nature and design of an instrument will strongly impact how progressive or regressive the instrument
is. A tax which increases the price of energy (such as a carbon tax) would traditionally be thought to be
regressive, since goods such as electricity make up a higher share of a low-income budget (Fullerton, 2011).
However, recent research shows that revenue generating policies can be progressive if revenue is used to
reduce labor or income-taxes (as part as of revenue-neutral tax reform) (Andersen and Ekins, 2009) or to
provide lump-sum rebates for low-income households (Murray and Rivers, 2015).
A climate instrument may also be regressive if it induces firms to invest in capital-intensive abatement
technologies, lowering the demand for labor with respect to capital (Fullerton, 2008). Climate policy can
also, by restricting the emission levels and thus forcing them to reduce output, create an artificial scarcity
for the goods whose production is emission-intensive – when this causes prices to go up, a scarcity rent is
generated which can be captured by the government (as revenue, when a tax is in place) or by firms (as
private profit, when an ETS is in place) (Fullerton, 2008). This situation is regressive as benefits go to high-
income firm owners.
2.2.2 POLITICAL FEASIBILITY APPROACH
Dror (1969) argues that political feasibility is an important criterion for policy assessment, stating two main
reasons: 1. One must identify whether a policy instrument has a “reasonable probability” of implementation
(within a defined time range) to avoid pursuing efforts on irrelevant alternatives; 2. There are political risks
and costs associated with the political feasibility of an alternative. However, caution should be exercised
about making political feasibility a “dominant” criterion (Dror, 1969). Having an economic first-best policy
option helps makes more transparent the costs associated with choosing a second-best (politically feasible)
alternative (Karplus, 2011).
There is a widely recognized gap between normative theory and positive reality (Ellerman, 2015). Despite
knowledge of the economically preferable market-based instruments, command-and-control regulation has
traditionally been the main instrument of choice (Ellerman, 2015). Similarly, ETS instruments have recently

 14
gained in popularity over their the theoretically more efficient7 carbon tax (Ellerman, 2015). Knowledge of
the superior economic effects of a policy instrument is thus insufficient to hypothesize on whether an
instrument will be selected (Hahn and Stavins, 1991).
The public choice approach of political economy applies the principles of economics to political science
(del Río and Labandeira, 2009). The selection of a policy instrument is characterized as a struggle between
policy-makers and various stakeholder groups acting in their own self-interest, the outcomes of which will
be determined by the preferences and the relative power of each group (Munaretto and Walz, 2015). The
relevance of actors in the policy-making process changes according to the country (Munaretto and Walz,
2015) or the subject matter of the policy which is discussed. The bargaining between the actors impacts
both the instrument choice (del Río and Labandeira, 2009) and the design and parameters (carbon price,
abatement level) of the instrument (Gawel et al., 2014; Jenkins, 2014), which may potentially deviate from
the normative “ideal” instrument (del Río and Labandeira, 2009). To evaluate the climate policy instruments
from a political feasibility perspective, the public choice approach will be used; the stakeholder groups
whose preferences and relative power are relevant to the selection of the instruments are described below.
ACTORS INVOLVED IN CLIMATE POLICY INSTRUMENT CHOICE
The public choice approach to environmental policy generally categorizes the actors who impact policy-
making into four main groups: politicians (seeking re-election), voters, regulated industries and public
bureaucrats (Kirchgässner and Schneider, 2003). Keohane et al. (1997) further divides voters into
consumers, workers and environmentalists, and adds interest groups such as environmental groups and
trade associations (Keohane et al., 1997). In their public choice analysis of the reluctance of Spanish policy-
makers to introduce market-based climate policies, Del Río and Labandeira (2009) focus on policy-makers,
abatement lobbies, voters, media, and industry. In their assessment of the political feasibility of climate
policy instruments for the European Union, authors Munaretto and Walz (2015) have divided the interest
groups into: bureaucrats (not subject to re-election), politicians (subject to re-election), environmentalists,
industry, research community and emissions trading constituencies (for example carbon market business
intermediaries). The latter is relevant only in a situation where an emissions trading system is in place.
In the context of the current analysis, namely the Mexican electricity sector, the relevant actors are:
The public sector, includes both elected politicians and non-elected public officials. Elected politicians are
usually characterized as seeking re-election, so they can be said to indirectly represent their voters’ opinions
during the decision-making process (Kirchgässner and Schneider, 2003). This doesn’t mean that they will
necessarily maximize social welfare; rather, they will aim to cultivate support from particular (relatively
powerful) subgroups from the electorate (Gawel et al., 2014). Public officials are constrained by the national
legislation and international commitments in terms of GHG emissions reduction.
Within the scope of this study, electricity generators are those directly responsible for the emissions. Generators
may own fossil fuel-based and renewable-based generation. Industry represents the largest consumer of
electricity, and is thus indirectly responsible for the emissions. It should be noted that industry is also a
direct emitter (in processes such as cement or steel production), so their interest in influencing climate
policy is two-fold. Industry provides goods and services to the consumers and employment to the workers,
and is usually well organized into interest groups, which gives it strong impact in the political arena
(Kirchgässner and Schneider, 2003).
Environmental NGOs seek more ambitious climate policy. The research community is particularly important in
the context of market-based instruments selection, as it will inform the policy-makers on the effects of the
policies and it tends to have credibility from the public. The research community can be divided into
academia, and consulting (and other services) companies, the latter being a closer ally of the business community.

7 Assuming a relatively flat marginal abatement benefits curve.

 15
3 Methods To carry out a comprehensive evaluation of climate market-based instruments using the economic and political feasibility approaches described in Section 2.2, a combination of quantitative and qualitative methods was used. The quantitative method utilized was the modeling of different carbon tax and ETS scenarios on a partial equilibrium model previously populated with data from the Mexican electricity system. Results from the simulations, such as the emission abatement, total costs, renewable generation installed capacity or electricity prices, help compare the cost-effectiveness of a carbon tax and an ETS as well as give a preliminary value at which the tax rate or the ETS cap should be set. Then, a qualitative analysis of international experiences with carbon tax and ETS was performed, to understand the more complex economic impacts which a deterministic static equilibrium model is unable to capture. The economic effects are assessed using the criteria defined in the Section 2.2.1: environmental effectiveness, effects on industrial competitiveness, dynamic efficiency and distributional effects. The modeling together with the qualitative analysis of international experiences allow to recommend the first- best instrument (either carbon-tax or ETS, including some broad design features) according to the normative economic approach. Finally, a qualitative analysis of the political feasibility of the instruments and their design is performed through an on-line survey, as well as semi-structured interviews whose respondents were representatives from the different interest groups involved in the Mexican electricity sector (see Section 2.2.2). Together, these two tools help understand the preferences and the relative power of the different interest groups regarding market-based climate policy instruments. As an outcome of the political feasibility approach, the instrument with a greater probability of being implemented is identified. The described methods of research (see Figure 2) allow to determine the most appropriate instrument for reducing GHG emissions in the Mexican power sector; an instrument which is suitable from an economic perspective (although perhaps not the first choice), but also with enough probability of being implemented. The methods are described in further detail below. Normative economic Positive political approach feasibility approach Model-based scenarios for On-line survey and in- policy implication analysis depth interviews for feasibility assessment Emission abatement Outcomes: Outcomes: Total costs Interest group’s preferences Renewable capacity Interest group’s relevance in the policy-making process Electricity prices Qualitative analysis of international experiences with carbon tax and ETS Outcomes: Environmental effectiveness Industrial competitiveness Dynamic efficiency Distributional effects Figure 2. Diagram depicting the methods of the research 16
You can also read