He Tirohanga Mokopuna 2021 - The Treasury's combined Statement on the Long-term Fiscal Position and Long-term Insights Briefing - The Treasury New ...
←
→
Page content transcription
If your browser does not render page correctly, please read the page content below
B.10

He Tirohanga
Mokopuna 2021
The Treasury’s combined Statement
on the Long-term Fiscal Position and
Long-term Insights Briefing

ISBN: 978-1-99-004530-1 (Online)
© Crown Copyright
                    This work is licensed under the Creative Commons     He Tirohanga Mokopuna was first used in the title of the
                    Attribution 4.0 International licence. In essence,   2016 Statement. It conveys the sense of a future outlook
                    you are free to copy, distribute and adapt the       and taking a long-term view. The term mokopuna is used
work, as long as you attribute the work to the Crown and abide by
the other licence terms.                                                 conceptually to signify a new generation; our mokopuna
                                                                         are the future and we have the responsibility today to
To view a copy of this licence, visit: https://creativecommons.org/      leave New Zealand a better place for them in the
licenses/by/4.0/
                                                                         decades ahead. He Tirohanga Mokopuna also
Please note that no departmental or governmental emblem, logo or         underscores the unique relationship between the Crown
Coat of Arms may be used in any way which infringes any provision        and Māori under the Treaty of Waitangi as an imperative
of the Flags, Emblems, and Names Protection Act 1981. Attribution
                                                                         in lifting living standards for New Zealanders.
to the Crown should be in written form and not by reproduction of
any such emblem, logo or Coat of Arms.                                   The purapurawhetū design element on the cover comes
The URL for this publication on the Treasury website at                  from tukutuku panels adorning the Treasury's wharenui,
September 2021 is: https://www.treasury.govt.nz/publications/            Ngā Mokopuna a Tāne. It symbolises the many people
ltfp/he-tirohanga-mokopuna-2021                                          of a nation and likens them to the myriad of stars.
                                                                         We have used it here to represent equitable distribution
Cover image: Waimairi Beach, Canterbury / Leigh Pearson (2020)           of wellbeing outcomes.

Acknowledgements
We thank submitters and those we met with as part of our consultation on the scope and the
draft of this document. A summary of the feedback we received can be found on our website:
www.treasury.govt.nz/news-and-events/reviews-consultation/long-term-fiscal-challenges

A note on He Tirohanga Mokopuna 2021 – the
Treasury's combined Statement on the Long-term
Fiscal Position and Long-term Insights Briefing
The analysis and conclusions in the consultation draft                   • How fiscal strategy affects living standards.
were finalised before new data releases were
                                                                         • Golden years – understanding the New Zealand
incorporated and the modelling updated. Additionally,
                                                                           Superannuation Fund.
we reviewed and considered all feedback we received
through the consultation. As a consequence the analysis                  • The economic impacts of an ageing population
and conclusions presented in this final version differ                     in New Zealand.
slightly from those presented in the consultation draft                  • Demographic, economic and fiscal assumptions
published in July. While we have been unable to fully                      and logic in the 2021 Long-term Fiscal Model.
reflect all the feedback received on the draft, this
feedback will still help to inform our ongoing policy                    • Long-term projections of the New Zealand
advice and development of our future stewardship                           Government’s interest rate.
reports.                                                                 • Labour productivity growth in the Treasury’s fiscal
Underpinning the analysis and conclusions are a number                     projections.
of background papers. We intend to publish these papers                  • Shocks and scenarios analysis using a stochastic
by the end of September 2021:                                              Neoclassical Growth Model.
Contents
The Treasury’s regular stewardship reports....................................................................... 3
Foreword ..................................................................................................................... 4
Executive summary........................................................................................................ 5
1 New Zealand’s long-term fiscal position ..................................................................... 8
1.1 New Zealand’s current fiscal position................................................................. 8
1.2 Demographic change...................................................................................... 12
1.2.1 Drivers of demographic trends in New Zealand......................................... 12
1.2.2 Economic impacts of an ageing population............................................... 13
1.2.3 Fiscal impacts of an ageing population.................................................... 13
1.3 New Zealand’s long-term fiscal position............................................................. 15
1.3.1 Our approach to projecting the public finances......................................... 15
1.3.2 Historical trends scenario......................................................................18
1.3.3 Alternative scenarios............................................................................18
1.4 Uncertainties and risks in the long-term fiscal position........................................23
1.4.1 The impact of different interest rates.......................................................23
1.4.2 The impact of long-term economic growth.............................................. 26
1.4.3 Economic shocks................................................................................. 28
1.4.4 An earthquake.................................................................................... 30
1.4.5 What do shocks and uncertainty mean for our projections?....................... 30
1.5 The fiscal impacts of climate change.................................................................32
1.5.1 Adapting to the impacts of climate change...............................................32
1.5.2 The transition to a low-emissions economy..............................................37
2 Responding to long term fiscal trends........................................................................41
2.1 Framework for wellbeing analysis of policy options............................................ 42
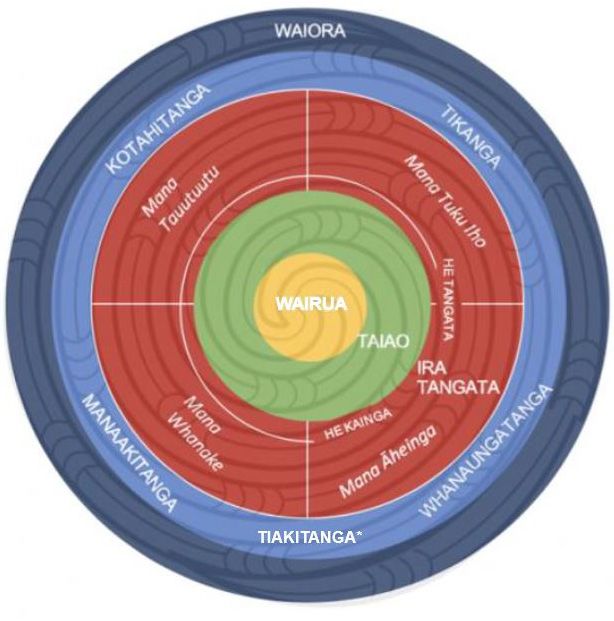
2.1.1 He Ara Waiora..................................................................................... 42
2.1.2 Living Standards Framework................................................................. 43
2.1.3 How are these frameworks being applied?.............................................. 43
2.2 How much, and when, should we adjust fiscal policy?......................................... 44
2.2.1 Fiscal sustainability and prudent debt.................................................... 44
2.2.2 The size of the policy adjustment........................................................... 45
2.2.3 The timing of the policy adjustment....................................................... 46
THE TREASURY HE TIROHANGA MOKOPUNA 2021 12.3 Managing healthcare expenditure.................................................................... 48
2.3.1 Healthcare in New Zealand...................................................................... 48
2.3.2 Reforms to New Zealand’s health system................................................... 51
2.3.3 Alternative pathways for health expenditure under current settings...............52
2.3.4 Impacts and trade-offs of lower health spending growth............................. 54
2.4 Responding to demographic change.................................................................55
2.4.1 New Zealand’s retirement income system................................................55
2.4.2 Raising the age of eligibility for NZS........................................................ 58
2.4.3 Reducing the rate at which NZS payments grow........................................61
2.4.4 Other options to reform NZS ................................................................. 65
2.5 Raising tax revenue........................................................................................ 67
2.5.1 The role of tax in supporting New Zealand’s wellbeing.............................. 67
2.5.2 New Zealand’s tax system..................................................................... 68
2.5.3 Options to raise additional revenue from income tax................................ 70
2.5.4 Other options to raise revenue................................................................73
2.6 Modernising the public finance system..............................................................75
2.6.1 New Zealand’s public finance system.......................................................75
2.6.2 Modernising New Zealand’s public finance system.....................................75
2.7 Bringing it all together.....................................................................................77
Appendix one...............................................................................................................78
Alternative paths for net debt..................................................................................78
Appendix two.............................................................................................................. 83
Neoclassical Growth Model (NCGM)........................................................................ 83
Appendix three........................................................................................................... 86
LTFM projection assumptions.................................................................................. 86
Appendix four............................................................................................................. 88
How have the LTFM results changed since 2016?........................................................ 88
Appendix five.............................................................................................................. 90
Assumptions for earthquake disaster....................................................................... 90
2 THE TREASURY HE TIROHANGA MOKOPUNA 2021The Treasury’s regular
stewardship reports
With recent changes to the Public Finance Act and the new Public Service Act, the
Treasury must regularly produce four reports: a Statement on the Long-term Fiscal
Position (Long-term Fiscal Statement) and a Long-term Insights Briefing (combined
in the current report) as well as an Investment Statement and a Wellbeing Report.
Long-term Fiscal Statement (LTFS): every four years, the Investment Statement: every four years the Minister of
Treasury must prepare a statement on the long-term fiscal Finance must present to the House of Representatives a
position. The LTFS must relate to a period of at least statement prepared by the Treasury that describes the state
40 consecutive financial years. The LTFS indicates possible and value of significant assets and liabilities; how those have
trends in spending, revenue, the operating balance and changed in value over time; how they are forecast to change
debt over the relevant period, based on current policy over at least the next two years; and changes since the last
settings and recent history. statement.
Long-term Insights Briefing: every three years the Treasury Wellbeing Report: every four years the Minister of Finance
provides to the Minister of Finance a report, the aim of must present to the House of Representatives a report
which is to make publicly available (1) information about describing, with the use of indicators, the state of wellbeing
medium- and long-term trends, risks and opportunities that in New Zealand; how this has changed over time; and the
affect or may affect New Zealand, and (2) information and sustainability of, and any risk to, the state of wellbeing in
impartial analysis, including policy options (but not New Zealand.
recommendations) to respond to these trends, risks and
opportunities. This report must be done independently of Publication Schedule
Ministers. The public must also be consulted on the scope 2021: Long-term Fiscal Statement/Long-term Insights Briefing
and a draft of the briefing. For this briefing, we have
decided to focus on the fiscal outlook in the context of 2022: Wellbeing Report; Investment Statement
COVID-19. This does not imply that there is not a wide range
of other significant issues for New Zealand. However, given 2024: Long-term Insights Briefing
our role, the fiscal outlook was a logical topic.
THE TREASURY HE TIROHANGA MOKOPUNA 2021 3Foreword
Kia ora koutou
The Treasury’s Māori name, Te Tai Ōhanga, represents the Through ongoing engagement with Māori and external
role we play in overseeing the ‘tides’ of the New Zealand stakeholders, we aspire to improve and deepen the quality
economy. Charting the tides of New Zealand’s fiscal of this analysis over time and ensure its relevance for all
position over the coming 40 years is the role of the New Zealanders.
Long-term Fiscal Statement.
In preparing this report we sought input and submissions
This year we have combined the Long-term Fiscal from key subject matter experts on topics such as
Statement with the Treasury’s first Long-term Insights superannuation, demographics and climate change to
Briefing. This has provided us with the opportunity to help shape its contents and our analysis.
analyse key trends and their potential long-term fiscal
impacts directly alongside a range of policy options Like so much else in New Zealand, this work has been
available to address them. affected by the COVID-19 pandemic. We originally intended to
publish this report in March 2020 but decided to wait so we
We deliberately kept the name ‘He Tirohanga Mokopuna’, could evaluate the effects of the pandemic, at least in its
from the 2016 LTFS because the concepts underpinning early stages. As we finalised the draft of this document we
the name (the need to take an intergenerational view, the went into lockdown again, illustrating that COVID-19 remains
importance of mokopuna and whānau and the potential a big challenge.
for the Māori-Crown relationship under Te Tiriti o Waitangi
to act as an enabler in lifting living standards for all Welcome to the Treasury’s 2021 Long-Term Fiscal Statement
New Zealanders) are even more salient now in 2021. We and Long-term Insights Briefing. I hope you find it illuminating
are making greater use of our Living Standards Framework and thought provoking.
to ensure we take a broad and rigorous view of how fiscal
sustainability contributes to wellbeing now and in the Ngā mihi nui
future. For this Statement, we have introduced a te ao
Māori perspective, drawing from He Ara Waiora, which is a
waiora (wellbeing) framework built on te ao Māori
knowledge and perspectives of wellbeing.
Caralee McLiesh
Secretary to the Treasury
4 THE TREASURY HE TIROHANGA MOKOPUNA 2021Executive summary
The impacts of the COVID-19 pandemic cast a shadow While the fiscal response to the COVID-19
over the fiscal position of the Government and will do so
for years to come. There is considerable uncertainty pandemic has caused net debt to
about its future effects. We still don’t know when the increase significantly, the Treasury views
world’s borders will re-open and the new ‘normal’ our this response and current debt levels to
economies will return to.
be prudent
However, it is not only the COVID-19 pandemic that we
must consider. Other economic and societal matters, such The most recent forecast for net debt is that it will peak
as climate change and population ageing, must also be at 48% of GDP in 2023. Though more recent fiscal and
factored into the long-term fiscal position of New Zealand. economic data indicates that the net debt position is
more favourable than forecast. In any event, the
In this report we look at some of the economic and Government’s fiscal response has helped prevent a
societal factors most likely to affect New Zealand now deeper and longer-lasting recession, which could have
and into the future. We then look at our current had long-term impacts on New Zealand’s wellbeing.
economic situation, analyse the possible future impacts
of current trends, and discuss some options for The Treasury's judgement is that there is currently no
moderating these impacts. need to reduce debt levels. The fiscal response to
COVID-19 is largely temporary. Deficits will shrink as the
Where possible we have incorporated the impacts of temporary fiscal measures put in place since March 2020
COVID-19 on key economic variables such as interest to support the public health response to the pandemic
rates, labour productivity, migration and trend growth. end, putting less upward pressure on net debt.
However, it is still too early to accurately assess the
longer-term impacts on important drivers of the Current debt levels are also unlikely to limit our ability to
economy, including migration and tourism. borrow further if required. New Zealand’s debt level
remains low relative to its peers and the interest rate and
composition of debt are much more favourable than
COVID-19 – the when net debt peaked at 55% of GDP in 1992.
immediate challenge Other key factors at play
The COVID-19 pandemic has demonstrated
Climate change will have significant
the importance of a strong and sustainable
economic and fiscal impacts both now and
fiscal position
into the future. The scale of these impacts
New Zealand was well positioned to respond to
COVID-19. Prior to the pandemic, net core Crown debt
remains uncertain, partly because many
(net debt) was 19% of GDP. This strong fiscal position policy decisions are still to be taken
allowed the Government to respond to the COVID-19
Climate change will impact the fiscal position through
pandemic with significant fiscal support, which has been
both the physical impacts of a changing climate, such as
critical to maintaining relatively low unemployment and
more frequent and severe weather events, and the
enabling a swift economic recovery from the initial shock.
transition to a net zero emissions economy by 2050.
This complemented the national health response and
Climate change has started to impact New Zealand today,
monetary policy stimulus.
but the long-run effect is highly uncertain at this stage.
While New Zealand’s health and economic responses to
More frequent and severe extreme weather events and the
COVID-19 have supported living standards to date, the
gradual increase in temperature and sea levels will have
economy has still faced a significant shock, uncertainty
economic and fiscal impacts in the future, which
remains, and some groups have been more negatively
adaptation policy today could reduce. Governments will
affected than others. Sectors such as retail, trade and
also face trade-offs when choosing the pace of emissions
accommodation have been the most impacted by
reduction and the policy levers to achieve it.
pandemic-related disruption. This affected a
disproportionate number of young people, Māori, Pacific
Peoples and women, exacerbating pre-existing inequities
in labour market outcomes.
THE TREASURY HE TIROHANGA MOKOPUNA 2021 5New Zealanders are, on average, living Any long-term projections are uncertain,
longer and healthier lives. This is a good and there will be shocks in the future
thing, but combined with ongoing Uncertainty about the path of the economy through the
increases in health spending it is likely COVID-19 pandemic heightens the already significant
uncertainty associated with long-term projections. The
to put pressure on public finances over projections are sensitive to many factors, including the future
the long-term path of interest rates and the starting point for economic and
fiscal projections. Built up over time, small initial differences in
Driven by lower average fertility rates and improvements in
demographic, social and natural trends can lead to very
life expectancy, 26% of the population is projected to be
different future economic and fiscal positions. Additionally,
over 65 years old by 2060, compared to 16% in 2020. This is
governments will change policies and technological advances
expected to increase superannuation expenditure under
will surprise us, and some factors will eventuate that we are
current settings. In addition, we expect healthcare costs will
not aware of, like the COVID-19 pandemic.
likely continue to grow over time, with an ageing population
projected to make up around one third of the increase. Therefore, the long-term projections in this Statement should
be viewed as an illustration of the trajectory of the fiscal
This ageing population will also change the demographics of
position under a set of assumptions rather than a forecast.
New Zealand as ageing varies considerably by ethnicity.
Even optimistic changes to those assumptions do not change
Māori and Pacific Peoples are on average significantly
the fact that New Zealand will face significant long-run fiscal
younger than other New Zealanders. By 2043 Māori are
pressures. However, lower interest rates will provide more
projected to account for 21% of the total population and
time to make policy adjustments as debt-financing costs will
only 11% of the 65+ population.
be lower (and these adjustments will be relatively smaller).
Beyond COVID-19 and climate change, there are other
New Zealand will face shocks in the future such as recessions,
significant trends or issues which will impact New Zealand
earthquakes, and further pandemics. They are expected to
– including technology and the changing global strategic
add to fiscal pressures in the long-term. By ensuring that
context. We have not considered these in this document.
enough capacity exists in the public finances to respond to
these shocks, the wellbeing of the future populations that have
Looking to the future to manage them can be supported.
Fiscal sustainability helps maintain and Options and choices
improve intergenerational wellbeing
Governments have choices about the level of
Fiscal sustainability ensures governments can continue to
pay for the services and transfers they provide into the
debt to target in the future, and when they
future. This helps ensure that governments can respond to make policy adjustments to achieve this
unexpected negative shocks to protect living standards and
While the Treasury’s judgement is that there is currently no
future generations are not unfairly burdened by the current
immediate need to reduce debt, policy action will be
generation through higher taxes or a lower level of
necessary to achieve and maintain a sustainable debt
government services.
trajectory over time. This will ensure that New Zealand is
resilient to future shocks, and that future generations do
Net debt is likely to be on an not face an unduly large burden of debt. Governments will
unsustainable trajectory if expenditure need to decide how large an adjustment is necessary, and
and revenue follow historical trends at what time. Both judgements are complicated by
uncertainty in the near term due to COVID-19, the future
Our projections indicate that the gap between expenditure path of interest rates, and international debt levels, while
and revenue will grow significantly as a result of fiscal policy will need to be flexible to be able to respond to
demographic change and historical trends, in the absence a range of scenarios.
of any offsetting action by governments. This will cause net
debt to increase rapidly as a share of GDP by 2060. For the The Public Finance Act 1989 requires governments to
first time, the Treasury has also modelled the economic ‘reduce debt to prudent levels’ and maintain it at those
impact of alternative scenarios where governments take levels. Defining ‘prudent’ requires both analytical and value
action to stabilise net debt instead of allowing it to judgements, including considering the value of additional
increase. This modelling can help inform the policy expenditure, how decisions to allocate resources affect
trade-offs future governments will face. current and future wellbeing (which can be done using the
Treasury’s Living Standards Framework and He Ara Waiora),
how much fiscal resilience New Zealand needs to respond
to future shocks, and the impact of higher debt on future
generations. The Government views current debt levels as
prudent, an assessment the Treasury supports.
6 THE TREASURY HE TIROHANGA MOKOPUNA 2021However, long-term expenditure trends mean that, Health reform now under way provides an opportunity to
without any policy adjustments, net debt will likely breach improve fiscal sustainability over the long-term through
the prudent upper limit at some future point either within enhanced productivity and efficiency, although the extent of
or beyond the projection period. In this report, we this is uncertain. It is unlikely, however, to achieve a
consider some of the possible policy adjustments, but permanent and significant reduction in healthcare spending
these are by no means an exhaustive list of all the options. growth given the upfront investment required, the ambitious
focus of reform (for example, improving equity of access)
Although the increased uncertainty as a result of COVID-19 and the underlying drivers of health expenditure.
makes it difficult to calculate the exact speed of adjustment,
considering changes to improve the long-term fiscal position Reforms to our public finance system will give
now is likely to be beneficial. Small and gradual changes in governments more tools to improve fiscal management
the near term could help minimise the cost of fiscal and sustainability. While these tools are unlikely to deliver
pressures across generations, preventing higher debt and a significant fiscal savings, they will help governments focus
larger, relatively more costly adjustment in the future. on the quality of expenditure and value for money through
better collaboration, multi-year Budget cycles and
Policy choices on the level of debt, speed spending reviews. Maximising the quality and value of
of adjustment, and policy options present expenditure will be critical to enhancing social capital in
an increasingly constrained fiscal environment. It will also
trade-offs for current and future wellbeing ensure that governments are investing in expenditure that
in several ways will contribute to current and future wellbeing, help build
our future resilience to shocks and deliver long-term gains
The Treasury’s Living Standards Framework, which in both outcomes and cost.
recognises that environmental, social, human, and
physical and financial capital need to be developed and There are options to increase tax revenue,
sustained in order to achieve wellbeing, and He Ara
Waiora are both useful frameworks for considering the although the impact would depend on the
wider wellbeing implications of fiscal objectives and the tax lever chosen
means of achieving them.
The Treasury has considered options to increase tax
These frameworks consider the distributional impact of revenue and modelled the impact of increasing revenue
policies on different groups. They help ensure that from the personal income tax system. Raising additional
policies are fair and consistent with tikanga Māori. This is revenue has economic costs, as it reduces individuals’
achieved by working in the spirit of kotahitanga (unity) and businesses’ ability or incentives to work, save, or
with those most affected by any policy changes, and by invest in businesses, the economy, themselves, or their
considering the intergenerational impact of the choices whānau, which could reduce financial and human capital.
we make to support our tiakitanga (stewardship) or mana The net impact on New Zealand’s wellbeing depends on
whanake (intergenerational prosperity). who ends up paying and how additional revenue is spent.
Future governments could manage the There are many ways in which governments could seek to
raise additional revenue from existing and new tax bases
growth in expenditure over time, beyond personal income tax. All have trade-offs; there is
supported by a drive to improve the no perfect way to raise revenue, and different levers have
different economic and social impacts.
quality of public spending
We have considered options to manage the growth of health A comprehensive package will be
expenditure or to change the policy settings for New Zealand necessary over time to stabilise net debt,
Superannuation such as increasing the age of eligibility and
changing the rate at which payments are increased. Both but the balance of policy measures is
would contribute to a more sustainable trajectory for debt, largely a value judgement for governments
and could have broader macroeconomic benefits, but would
come with trade-offs particularly for groups of the Changing tax rates or restricting expenditure growth can
population who already face challenges accessing health help close the growing gap between revenue and
services or an adequate income in retirement. expenditure. However, analysis in this Statement shows
that one policy change by itself is unlikely to stabilise debt
The context for retirement income policy has now changed over the long run. This means that future governments
given, for example, COVID-19, home ownership patterns over will likely need to draw on multiple levers and consider
the past decade, and the changing nature of work. This trade-offs across different policy options in responding to
needs to be taken into consideration when analysing the our fiscal challenges.
costs and benefits of New Zealand Superannuation options.
Further, any changes should be signalled in advance.
THE TREASURY HE TIROHANGA MOKOPUNA 2021 71
New Zealand’s long-
term fiscal position
1.1
New Zealand’s current fiscal position
New Zealand’s strong fiscal position when In the year to June 2019 net debt was 19% of GDP. The
Government’s strong fiscal position allowed a significant fiscal
the COVID-19 pandemic hit allowed the response to the COVID-19 pandemic, which has been critical
Government to support the wellbeing of to minimising the rise in unemployment and supporting a
swift economic recovery from the initial shock.
New Zealanders through an extraordinary
New Zealand’s fiscal response was large by international
shock, which has prevented a deeper and standards (see figure 1).1 Discretionary COVID-19 fiscal
longer-lasting hit to living standards. measures totalled $62.1 billion. Automatic fiscal stabilisers
and existing discretionary fiscal policy initiatives have also
While the impact of COVID-19 on annual provided support to the economy.2
borrowing is largely expected to be That fiscal support complemented the health response and
action taken by the Reserve Bank of New Zealand (RBNZ) to
temporary, net core Crown debt (net debt) support the economy. New Zealand’s elimination strategy
in New Zealand has increased substantially resulted in generally fewer domestic movement restrictions
after May 2020 than those seen in many other parts of the
and is expected to peak at 48% of GDP in world, and the RBNZ eased monetary policy to support the
2023. Though more recent fiscal and economy using both existing and new monetary policy
tools. As a result, New Zealand’s health and economic
economic data indicates that the net debt responses to COVID-19 have helped support living
position is more favorable than forecast. standards3. Consistent with this, most New Zealanders
continue to enjoy high levels of life satisfaction.4
Increasing net debt is an appropriate policy Nevertheless, some groups have been more negatively
response to COVID-19, and while the impacted by the pandemic than others. Business owners and
individuals working in retail, trade and accommodation have
Treasury considers there is currently no been the most impacted by pandemic-related labour market
need to reduce the level of net debt, disruption. This affected a disproportionate number of young
people, Māori, Pacific Peoples and women, which has
governments will need to ensure that it is on exacerbated pre-existing inequities in labour market
a sustainable trajectory in the long-term. outcomes.5 In addition, house prices have increased sharply.
1 While New Zealand’s fiscal spending has been large by international standards, the scale of equity loans and guarantees has been at the low end.
2 Spending and forgone revenue from automatic fiscal stabilisers is forecast to total around $5.8 billion over the three years to June 2022, and the Government had
committed to $12 billion of infrastructure-based fiscal stimulus (the New Zealand Upgrade Programme) in January 2020, shortly before the impacts of COVID-19
became apparent.
3 See: https://www.treasury.govt.nz/sites/default/files/2020-08/dp20-02-covid-19-impacts-on-wellbeing-v2.pdf
4 See: https://www.stats.govt.nz/information-releases/wellbeing-statistics-december-2020-quarter
5 See page 17 of the following link for information on the distributional impacts of COVID-19 in the labour market:
https://www.treasury.govt.nz/system/files/2020-12/hyefu20.pdf
8 THE TREASURY HE TIROHANGA MOKOPUNA 2021This has exacerbated housing affordability challenges, Figure 1: Discretionary public spending and forgone
particularly for those seeking to buy their first home, and revenue in response to COVID-19
placed further pressure on intergenerational equity. % of GDP
30
There is a risk that COVID-19 may have longer-lasting
economic costs. A growing body of evidence shows that 25
recessions can have a long-lasting effect on the earning and 20
employment potential of workers – particularly those who
15
lose their job – and reduce investment and innovation in the
economy.6 The size of the long-run impact is uncertain; 10
however, the relatively small increase in unemployment and 5
the fast economic recovery following lockdowns provide
0
reasons to be optimistic.
Czech Republic
Switzerland
Belgium
France
United States
Sweden
Finland
Korea
Norway
Spain
Netherlands
Italy
Germany
Canada
United Kingdom
Japan
Australia
Singapore
Denmark
New Zealand
In the absence of a strong fiscal response to COVID-19, the
economic and fiscal position and outlook could have been
much worse, and those permanent impacts more likely.
Lower spending, lower investment and lower employment Source: IMF
could have fallen into a vicious cycle, resulting in a deeper
Figure 2: Net core Crown debt9
and longer-lasting recession.7 Fiscal policy needed to play a
$ billions % of GDP
larger than usual role in supporting the economy, given both 200 60
Forecast
the nature of the shock and the limits on monetary policy. A 180
smaller fiscal response may have required the RBNZ to use 160
50
new monetary policy tools more aggressively to meet their 140
40
120
economic objectives, which would be more difficult to target
100 30
and would not have supported the economy as quickly as, for 80
example, the Wage Subsidy Scheme. 60
20
40
10
However, the fiscal response has shifted New Zealand’s debt 20
position significantly – net debt is now forecast to peak at 0
2011 2013 2015 2017 2019 2021 2023 2025
0
48% of GDP in 2023 (see figure 2).8 The change in net Year ending 30 June
debt-to-GDP as a result of COVID-19 is largely attributable to Net core Crown debt
% of nominal GDP (RHS)
the increase in debt, rather than changes to forecast GDP. Net % of nominal GDP (without FLP)(RHS)
worth, another measure of government balance sheet
Source: The Treasury’s 2021 Budget Economic and Fiscal Update
strength, has also deteriorated (see figure 3).
The fiscal response to COVID-19 is largely temporary. Figure 3: Total Crown net worth
Current and future forecast deficits are largely being $ billions % of GDP
160 60
caused by one-off COVID-19 expenditure or revenue Forecast
140
measures. Deficits will shrink as the temporary fiscal 50
120
measures put in place since March 2020 to support the 40
100
public health response to the pandemic end (see figure
80 30
4), putting less upward pressure on net debt.
60
20
The Treasury views this temporary increase in borrowing and 40
the increase in net debt as an appropriate response to the 20
10
significant shock that COVID-19 represented. 0 0
2011 2013 2015 2017 2019 2021 2023 2025
Year ending 30 June
Total Crown net worth
% of nominal GDP (RHS)
Source: The Treasury’s 2021 Budget Economic and Fiscal Update
6 For example, see: http://motu-www.motu.org.nz/wpapers/17_12.pdf
7 This cycle would see households’ reluctance to spend reduce demand for goods and services produced in New Zealand; this makes the outlook more challenging for
businesses, who then become more reluctant to hire new staff or retain existing employees. This, in turn, makes households even more reluctant to spend as they
face lower incomes and more uncertain employment prospects.
8 The debt forecasts are based on the 2021 Budget Economic and Fiscal Update: https://www.treasury.govt.nz/sites/default/files/2021-05/befu21.pdf. Since then, the
economy has performed more strongly than expected and debt levels are now expected to be somewhat lower. The appropriateness of the net debt definition is
currently being reviewed as part of a broader review of fiscal indicators, which is expected to be completed during 2021/22.
9 Excluding the Funding for Lending Programme (FLP), the level of net core Crown debt is lower across the forecast period and is expected to increase to $171.5 billion
(41.4% of GDP) in the final year of the forecast.
THE TREASURY HE TIROHANGA MOKOPUNA 2021 9Furthermore, compared to the previous debt peak in 1992 These factors inform the Government’s view that current
(at 54.8% of GDP), interest rates and the composition of levels of debt are prudent, as articulated in the Budget 2021
debt are much more favourable: Fiscal Strategy Report. The Treasury supports this
assessment and considers that there is currently no need to
• Interest rates are at near historical lows, with the reduce debt levels, and as appendix one shows, there
90-day yield at 0.54% (as at August 2021) compared to could be significant economic costs to reducing debt from
around 6% in August 1992. its current level too quickly.
• All long-dated debt is New Zealand dollar denominated
However, that does not mean that higher debt today, and
(NZD), with only a small amount (just under NZD $2 billion
long-term fiscal trends, are not important or that they will
or 1.25% of total debt) of short-dated United States dollar
not require policy action in the future. Sections 1.3 and 1.4
denominated debt at the end of January 2021, whereas in
describe how those trends could develop under different
1992 foreign currency denominated debt comprised
policy scenarios. Section 2 of this report explores how New
around 40% of total debt based on the best data we have
Zealand could respond to those trends, including how the
available. NZD denominated debt has a lower exposure to
Treasury views prudent debt and fiscal sustainability, and the
exchange rate changes.
potential scale of policy adjustment required. The remainder
• New Zealand’s debt is relatively low compared to its of section 2 sets out policy options for governments to make
peers (figure 5). that policy adjustment and achieve fiscal sustainability.
10 THE TREASURY HE TIROHANGA MOKOPUNA 2021Figure 4: Operating balance before gains and losses (OBEGAL)
% of GDP
6
Forecast
4
2
0
-2
-4
-6
-8
-10
2007 2009 2011 2013 2015 2017 2019 2021 2023 2025
Year ending 30 June
Source: The Treasury’s 2021 Budget Economic and Fiscal Update
Figure 5: IMF general government net debt10
% of GDP
110
100
90
80
70
60
50
40
30
20
10
0
-10
-20
1990 1995 2000 2005 2010 2015 2020 2025
United Kingdom European Union Finland Denmark
Advanced Economies Australia New Zealand
Source: IMF (April 2021 database)
Note: Forecasts are included in the graph.
10 The IMF’s general government net debt definition is different to the net core Crown debt measure that the Treasury produces. The difference reflects variations in
accounting frameworks, entity coverage, and the financial assets included within the respective net debt measures. For example, the IMF measure includes the
financial asset portfolios held by ACC and the NZ Superannuation Fund. Over the forecast period, this produces a relatively lower net debt figure. The financial assets
coverage attributes a large portion of the difference between the two measures.
THE TREASURY HE TIROHANGA MOKOPUNA 2021 111.2
Demographic change
Stats NZ projects that people aged 65+ The New Zealand population is growing and ageing. It is
expected to reach 6.5 million by 2060, and people aged 65+
will make up 26% of the population in are projected to account for more than a quarter of the
2060, compared to 16% in 2020. This is total population by 2060, compared to 16% in 2020.
partly because people are, on average, This demographic change is an important driver of
long-term fiscal trends. This section analyses the drivers
living longer and are in better health. and impacts of New Zealand’s ageing population.
This is a positive thing for New Zealand.
1.2.1 Drivers of demographic trends in
These population projections differ by New Zealand
ethnicity and region and so will change The three key factors driving these projections are fertility,
the demographics of New Zealand. mortality, and net migration.
Despite longevity also increasing for Māori • Fertility – people are having fewer children:
New Zealand’s fertility rate has been below the
and Pacific Peoples, their average age will ‘replacement rate’ of 2.1 since 2013.11 Stats NZ assumes
increase more slowly than European and the fertility rate will stabilise at 1.65 from 2021.
Asian ethnic groups, largely because of • People are living longer, healthier lives: since the
1950s, New Zealand’s life expectancy at birth has
higher fertility rates and lower life increased by around 12 years for both males and
expectancy. females. Stats NZ projects that it will continue to
increase gradually, reaching 89 years for females and
There is uncertainty about how an ageing 86 years for males by 2060, up from 84 and 81 years
respectively in 2021.
population will affect the economy. One
• The effect of migration: New Zealand had relatively
of the more certain outcomes is that, on high rates of migration before COVID-19. We expect
average, labour supply growth will be that this could slow population ageing, but the impact
is unlikely to be significant over the long term. While
lower, although by how much is less migrants tend to be younger, they also age and there is
certain. As people get older, they are less international evidence that over time migrant
populations tend to shift towards having similar
likely to work, and if they do work it is numbers of children as native-born populations.
generally for fewer hours. However, this Fertility and life expectancy differ by ethnic group.12
may be partly offset by an increase in Therefore, not all population groups in New Zealand will
age at the same pace. In particular, Māori and Pacific
labour force participation by women and Peoples have higher fertility rates than European and
if elderly people work more than Asian ethnic groups, and while Māori and Pacific Peoples'
longevities are increasing, they remain below those of
expected. We make assumptions about other ethnic groups.13,14 This is likely to change the
these effects in the projections. demographics of New Zealand over time:
11 Replacement level fertility is the average number of children every woman must theoretically have in order for the population to exactly replace itself from one
generation to the next. In most countries, the replacement fertility level is roughly 2.1, as not everyone reaches child-bearing age, but the exact number depends on
gender ratios at birth and infant and child mortality rates. Migration trends are not taken into account.
12 Ethnic groups are not mutually exclusive, since some people identify with more than one ethnicity.
13 In 2019 life expectancy for Māori males and females was approximately 7.7 and 7.4 years less than males and females respectively in the European or Other (including
New Zealander) ethnic group. In 2043 the gap in life expectancy is expected to close to 5 and 4.8 years for males and females respectively. In 2019 life expectancy for
Pacific males and females was approximately 6.0 and 5.4 years less than males and females respectively in the European or Other (including New Zealander) ethnic
group. In 2043 the gap in life expectancy is expected to close to 2.3 and 2.1 years for males and females respectively.
14 Some of these differences in life expectancy are driven by inequities in health outcomes; for example, obesity rates are particularly high for Pacific Peoples and Māori.
If these can be improved, this will lead to lower mortality rates, as well as having other positive economic and social impacts.
12 THE TREASURY HE TIROHANGA MOKOPUNA 2021• By 2043, Māori are projected to account for 21% of the • Changes in savings and investment decisions: as more
total population and 11% of the 65+ population. Pacific of the population moves into retirement, this may
Peoples are projected to account for 11% of the total lower overall savings rates and shift savings towards
population and 5% of the 65+ population. lower-risk investments. However, as outlined in section
1.4.1, there is a high level of uncertainty about what
• European New Zealanders are projected to have a
savings and interest rates will be in the long-term.
substantially greater proportion of their population aged
65+ relative to the 15-64 year age group compared with The economic impacts of an ageing population
other New Zealanders (figure 6). will also differ across the population
The social and economic impacts of these trends in Māori In particular, it is likely that the labour force participation
and Pacific Peoples demographics – and of their rates will differ across ethnicities. However, these economic
divergence from trends in the rest of the New Zealand impacts may also differ owing to historical inequality among
population – are explored in the interviews with Māori ethnic groups. For example, labour force participation rates
leaders and experts that we conducted as part of this tend to be lower and unemployment higher among Māori
work.15 These trends have implications for labour market and Pacific Peoples compared to other New Zealanders.
dynamics and policy settings.
Table 1 provides a breakdown of population projections
1.2.3 Fiscal impacts of an ageing population
by ethnicity and some key economic variables under Section 1.3 of this Statement provides our projections on
historical trends. how an ageing population could affect the long-term fiscal
position. This shows three trends:
1.2.2 Economic impacts of an ageing • Rising New Zealand Superannuation expenditure:
population the number of people eligible to claim New Zealand
Understanding the potential economic impacts of an ageing Superannuation will increase, and so expenditure will
population is an important part of the long-term fiscal increase.
sustainability story given that tax revenue is closely linked • Rising healthcare expenditure: older individuals will
to economic growth. An ageing population can affect the require more healthcare services than younger
economy in four main ways:16 individuals, on average. Therefore an ageing
• Reduction in labour supply growth: as people get population will increase the cost of a healthcare
older, they are less likely to participate in the labour system providing an equivalent level of service to
force, and if they do participate they generally work today. However, this is only around one third of
fewer hours. For this reason, the labour force expected growth in healthcare spending in the future,
participation rate is projected to fall by around five as general increases in demand for, and cost of,
percentage points between 2020 and 2060.17 healthcare services are also projected to rise.
• Changes in labour productivity: the impact of an • Reduced tax revenue: lower labour force participation
ageing population on productivity is ambiguous. will likely reduce real GDP growth, which will place
Hourly earnings tend to decrease as people get older, downward pressure on tax revenues.
which suggests that their productivity declines. Figure 6: Ratio of 65+ to 15-64 population by ethnicity
However, studies on this subject provide ambiguous
%
results and the declining wages for older workers could 50
be driven by other factors such as prejudice against
older workers or older workers stepping out of 40
higher-paying jobs.18 30
• Shifts in demand for different types of goods and
20
services: both the level and composition of
consumption will look different as New Zealand’s 10
population ages. Sectors that might grow their shares
of GDP as the population ages include health, old-age 0
1996 2001 2006 2011 2016 2021 2026 2031 2036 2041
care, financial services, and retail trade. Year
European Asian
Total Pacific
Māori
Source: Stats NZ
15 See: https://www.treasury.govt.nz/publications/research-and-commentary/rangitaki-blog/conversations-about-future
16 See background paper: The economic impacts of an ageing population in New Zealand: https://www.treasury.govt.nz/publications/strategies-and-plans/long-term-
fiscal-position
17 Working-age population is the resident population aged 15 years and over.
18 In addition, the impact of population ageing on labour productivity will be affected by investment, technology and innovation over time. These impacts are uncertain,
and as a result the Treasury assumes that ageing has no effect on productivity when making its long-term projections.
THE TREASURY HE TIROHANGA MOKOPUNA 2021 13Table 1: Population (million) and economic variable projections
Variable 2020 2030 2043 2060
Population total 5.1 5.6 6.1 6.5
Māori population 0.9 1.0 1.2 -
Pacific Peoples population 0.4 0.5 0.6 -
Asian New Zealander population 0.9 1.2 1.6 -
European population 3.5 3.7 3.9 -
Working-age population 4.1 4.6 5.1 5.6
Labour force participation rate 70.4% 68.4% 67.1% 65.2%
Source: Stats NZ
Note: Ethnic groups are not mutually exclusive. Projections by ethnicity only go to 2043.
14 THE TREASURY HE TIROHANGA MOKOPUNA 20211.3
New Zealand’s long-term fiscal position
To illustrate the scale of potential changes 1.3.1 Our approach to projecting the
to New Zealand’s long-run fiscal position, public finances
we present spending growing at historical In alignment with previous Statements, we present
projections for key classes of government spending and
rates assuming no response from the revenue based on historical trends (the historical trends
government or individuals, which shows scenario). In addition, this Statement for the first time
introduces a new model where we more explicitly model
net debt rising unsustainably. behavioural and policy responses of governments to
stabilise debt, households, and businesses and how
The most significant spending pressures their decisions might affect the economy as a whole
come from a combination of healthcare and (the alternative scenarios).19
NZ Superannuation, which we project will These approaches are complementary. Simply projecting
forward historical trends summarises the scale of the
increase by 6.4% of GDP from 2021 to 2061. fiscal pressures we face – but it is an unrealistic
scenario. The alternative scenarios inform the economic
We examine the macroeconomic effects of trade-offs that governments will face in the future by
illustrative policy choices to stabilise net looking at the impact of stylised adjustment scenarios
that differ in the type of adjustment – spending or tax –
debt, which can help inform trade-offs and the timing of adjustment.
that governments will need to make Both the historical trends scenario and alternative
between the economic and social impacts scenarios are projections that illustrate the broad fiscal
trends that could happen in the future. They are
of tax and spending choices. underpinned by up-to-date information and near-term
forecasts. However, they are not detailed forecasts of
what we expect to happen. Section 1.4 sets out how
these projections may change if some of our key
assumptions about the future turn out differently.
19 The historical trends scenario uses the Treasury’s Long-term Fiscal Model (LTFM). The background paper titled Demographic, economic and fiscal assumptions and logic
in the 2021 Long-term Fiscal Model explains the LTFM in more detail. The alternative scenarios uses the new Neoclassical Growth Model (NCGM) – see appendix two for a
technical summary of this model. A background paper titled Shocks and scenarios analysis using a stochastic Neoclassical Growth Model, explains the NCGM in more detail.
For background papers, see: https://www.treasury.govt.nz/publications/strategies-and-plans/long-term-fiscal-position
THE TREASURY HE TIROHANGA MOKOPUNA 2021 15Box 1: How do these projections compare to those presented alongside the
Government’s fiscal strategy?
In May the Government published projections of the annual allowance. In the Budget projections, only
fiscal position over the next 15 years (see Wellbeing New Zealand Superannuation and indexed welfare
Budget 2021, p49), meeting the requirements of expenditure is assumed to grow as the economy and
section 26L of the Public Finance Act. Aside from the population grow over time, and interest costs grow as
time period covered, those projections differ in some a function of debt levels and interest rates. All other
important aspects from the scenarios shown in this growth in operating expenditure – including health,
section. This leads to different results: the Budget education, and most other government services –
projections show net debt falling steadily to reach is assumed to be met from within an operating
28% of GDP in 15 years, and OBEGAL returning to allowance which begins at $2.0 billion in Budget 2025
surplus by 2026/27. in the central projection, growing at 2% per annum
thereafter.
The modelling approach used in the Budget
projections is very similar to that used in the historical The projections follow different approaches because
trends scenario. Both projections use the 2021 Budget they serve different purposes. The projections in this
economic and fiscal forecasts as a starting point. Both Statement aim to neutrally present the likely impacts
projections use the same long-run economic and tax of current and future governments acting (or not
revenue assumptions based on historical trends or acting) in certain ways to inform policy choices now
levels, and assume a gradual transition towards those and in the future. This is the same methodology used
levels from the end of the forecast period. In neither in previous Statements. The projections published in
model is there any feedback loop between the level of Budget 2021 are intended to demonstrate how the
government expenditure and economic growth. current Government intends to achieve its fiscal
strategy – in this instance, by controlling non-welfare
They differ in that, while the historical trends expenditure growth to remain below its historical
projections presented here assume that government rates. The impact of these different assumptions on
spending grows in line with historical trends, the core Crown primary expenses (expenses excluding
Budget projections assume that the majority of debt-financing costs) is shown in figure 7.
government expenditure will be constrained by an
16 THE TREASURY HE TIROHANGA MOKOPUNA 2021Figure 7: Core Crown primary revenue and primary expenses (LTFM and 2021 Budget projections using the FSM)20
% of GDP
40
Forecast Projection
35
30
25
2021 2026 2031 2036 2041 2046 2051 2056 2061
Year ending 30 June
Core Crown primary revenue – main LTFM projection
Core Crown primary expenses – main LTFM projection
Core Crown primary expenses – main FSM projection
Source: LTFM, Fiscal Strategy Model (FSM)
Table 2: Key assumptions in long-term fiscal projections
Historical trends scenario Alternative scenarios
Real interest rate on Transitions to 2.3% by 2045 Model determines rate that ensures the
government borrowing demand for government debt meets the
supply of government debt
Labour productivity growth 1% per year Model determines based on households’
willingness to work/invest and response to
taxes
Labour supply Based on population projections and Model determines based on workers’
assumed participation per age preference between work/leisure, based on
returns to labour net of taxes
Real GDP Grows each year in line with labour supply Model determines stock of capital and hours
and productivity worked based on inputs (e.g. tax rates)
Government policy Health, education and New Zealand Government adjusts tax rates or spending
Superannuation (NZS) spending and the to stabilise net debt
main working-age benefits spending grow in
line with historical and demographic trends.
Other operating spending is kept constant
at its historical level as a % of GDP.
Government investment Property, Plant and Equipment for the core Government investment is assumed to
Crown is assumed to stabilise at 14% of GDP, equal 5.1% of GDP (the average between
and at 54% for the total Crown 1994 and 2019)
20 For more information on how the projections in this Statement differ from the Budget projections see: https://www.treasury.govt.nz/publications/fsm/fiscal-strategy-
model-befu-2021
THE TREASURY HE TIROHANGA MOKOPUNA 2021 17You can also read