Electric vehicles A guide to - Government of Western Australia
←
→
Page content transcription
If your browser does not render page correctly, please read the page content below

A guide to
electric vehicles

www.wa.gov.au
Contents

      Introduction and background                         3

      Purpose of the document                             3

      The global drive towards zero emissions transport   4

      EV launch commitments by vehicle manufacturers      6

      An introduction to electric vehicles                8

      Electric vehicle availability                       9

      Evaluating electric vehicles for your fleet         11

      Small passenger vehicles                            11

      Medium passenger vehicles                           12

      Small SUVs                                          13

      Medium SUVs                                         13

      Sustainability of EVs                               14

      Plug types and applications                         15

      AC charging vs DC                                   17

      Charging infrastructure                             18

      Charger selection criteria                          19

      Charging and demand management                      20

      Charging at home                                    21

      Public charging                                     22

      Western Australia electric vehicle charger map      23

      Maintenance and roadside assistance                 24

      Heavy vehicles                                      25

      List of abbreviations                               26

                                                               2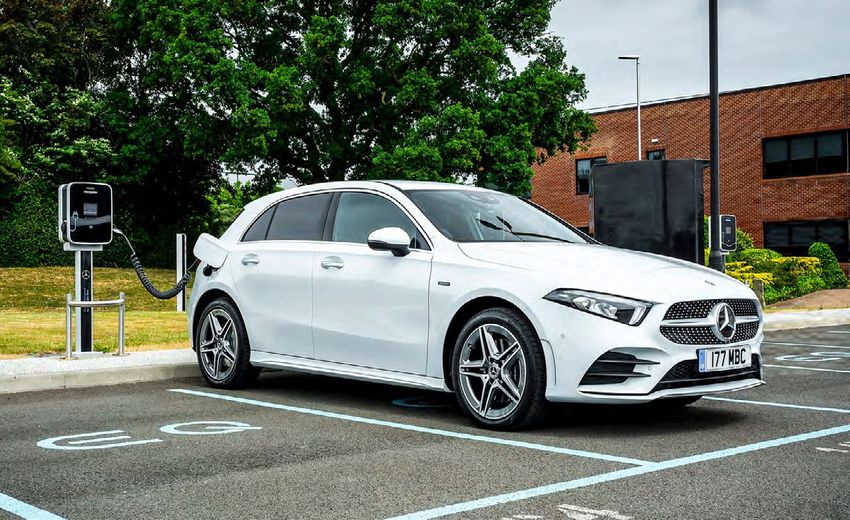
Introduction and
background
The Government of Western Australia has committed to working with all sectors of the economy to achieve net zero
emissions by 2050 for a prosperous and resilient low carbon future. The Western Australian Climate Policy outlines its action
around six key themes including “Lower-carbon transport”.1

Globally, electric vehicle (EV) uptake is on the rise. This recent decade has witnessed about 10 million electric cars on the
road with a 41% increase of EV registrations in 2020. A further acceleration in uptake is expected as EV prices reach parity
with conventional vehicles. Governments around the world are supporting the transition to EVs as a fundamental action
in achieving their emission reduction goals.2 The EV market also presents a significant opportunity for industry in Western
Australia. With some of the world’s largest reserves for all the critical battery minerals, Western Australia is already capturing
economic and employment benefits, and has the skills, infrastructure and standards to become a key player in the global
battery value chain.3

As part of its commitment to a low-carbon future, the Western Australian Government developed a State Electric Vehicle
Strategy for Western Australia in 2020, accompanied by a $21 million investment. This strategy sets out a roadmap to a
cleaner, more efficient and sustainable transport future. In addition to EV uptake, the strategy focuses on the development
of charging infrastructure; standards, guidelines, and planning approval requirements; and industry development.

The charging infrastructure program outlined in the Electric Vehicle Strategy will deliver Australia’s longest electric vehicle
fast charging network. This will provide electric vehicle owners with confidence that they can access fast charging stations
along major travel routes, as well as tourism locations across Western Australia. The network will reach north from Perth to
Kununurra, south to Esperance, and east to Kalgoorlie. The Strategy also targets a minimum 25 per cent EV acquisition for
the government fleet within eligible fleet segments by 2025-26.4

Efforts are being made to raise EV awareness so that the introduction of this technology can be accelerated and provide
environmental, health and economic benefits within Western Australia. While the State EV Strategy also covers fuel cell EVs
(FCEVs), this brochure focuses on battery EVs (BEVs) and plug-in hybrids (PHEVs) because of their market readiness.

                                                                                      Purpose of the
                                                                                      document
                                                                                      The purpose of this brochure is to provide practical
                                                                                      information for fleet managers about features and benefits
                                                                                      of EVs particularly in the context of WA to support their
                                                                                      adoption.

                                                                       Environment
                                                                          Minister
                                                                       Amber-Jade
                                                                        Sanderson
                                                                       with a Nissan
                                                                        Leaf AZEO

1 www.wa.gov.au/sites/default/files/2020-12/Western_Australian_Climate_Policy.pdf
2 www.iea.org/reports/global-ev-outlook-2021?mode=overview
3 www.wa.gov.au/government/publications/western-australias-future-battery-industry-strategy                                                   3
4 www.wa.gov.au/sites/default/files/2020-11/State_Electric_Vehicle_Strategy_for_Western_Australia_0.pdf
The global drive towards zero emissions
transport
With global commitments to address climate change and limit the rise in global temperatures to 1.5°C, zero emissions
vehicles are becoming a critical part of a lower-carbon society.

Transport contributes 16% of Western Australia’s greenhouse gas emissions. Transport emissions continue to increase and
are now 45% higher than in 20055. Petrol and diesel internal combustion engine (ICE) vehicles also produce nitrogen oxide
(NOx) and particulate matter emissions that cause adverse health impacts. A recent study showed that in Australia, of those
surveyed, 36% said that they had become more interested in air quality issues, versus 7% who said they had become less
interested since the start of COVID-196.

On average, Western Australians drive about 11,400 kilometres every year, each generating over 3 tonnes of carbon dioxide
(CO2)7.

The global drive towards zero-emissions transport
Many countries have now set dates for the phase out of ICE vehicle sales. End dates range from 2025 in Norway (which
already has EV share of new car sales above 50%).

5 Australian Government Department of Industry, Science, Energy and Resources, 2021, National Greenhouse Gas Accounts 2019,
www.industry.gov.au/data-and-publications/national-greenhouse-accounts-2019/state-and-territory-greenhouse-gas-inventories-2019-emissions
6 Source: 5th Annual Global Mobility Study by Vision Mobility, CuriosityCX and LEK Consulting                                               4
7 rac.com.au/about-rac/advocating-change/sustainability/vehicle-emissions

Country                                                  Key policy measures and targets

                  Canada                                  Target: 825,000 ZEV passenger LDV stock by 2025, 2.7 million by 2030 and 14
                  (EV30@30 signatory)                     million by 2040.

                                                          Target: 20% share of passenger NEV sales by 2025.
                  China
                                                          Ambition: 70% of passenger vehicles electrified (of which 40% NEVs) in 2025
                  (EV30@30 signatory)
                                                          and 100% in 2035 (of which 50% NEVs and 95% of those are BEVs).

                  European                                Target: 13 million passenger ZEV stock by 2025 (based on CO2 emissions
                  Union                                   standard for LDVs)

                  France                                  Target: 1.8 million passenger PHEV and 3 million passenger BEV and FCEV
                  (EV30@30 signatory)                     stock and 500,000 light commercial BEV and FCEV stock by 2028.

                  Germany
                                                          Ambition: 7-10 million passenger electric LDV stock by 2030.
                  (EV30@30 signatory)

                                                          Target: 2 million passenger EV stock and 13 million electric motorcycle stock by
                  India
                                                          2030.
                  (EV30@30 signatory)
                                                          Ambition: 30% share of EVs in passenger LDV sales in 2030.

                                                          Target: 6 million passenger electric LDV stock (including 4 million BEVs) by
                  Italy
                                                          2030.

                  Japan                                   Target: 20-30% shares of BEVs and PHEVs, 30-40% share of HEVs and 3% of
                  (EV30@30 signatory)                     FCEVs in passenger LDV sales by 2030.

                                                          Ambition: 100% (electrified, CNG, LPG or biofuel-fuelled vehicle) stock for all
                  Malaysia
                                                          private transport by 2030 and 40% in public transport (across all modes).

                                                          Target: 100% sales of urban buses to be ZEVs by 2025 and 100% stock by
                  New Zealand
                                                          2035.

                  Norway
                                                          Target: 100% ZEV sales in passenger LDVs by 2025.
                  (EV 30@30 signatory)

                  Singapore                               Target: phase out passenger ICE vehicles by 2040.

                  Sweden
                                                          Proposal: ban on new petrol or diesel cars sales after 2030.
                  (EV 30@30 signatory)

                  United Kingdom                          Ambition: phase out petrol and diesel passenger LDV sales by 2030. All sales of
                  (EV30@30 signatory)                     passenger LDVs to be BEVs or FCEVs by 2035.

                                                          Target: 3.3 million ZEVs in LDV stock in eight US states combined by 2025.
                  United States                           (California, Connecticut, Maryland, Massachusetts, New York, Oregon, Rhode
                                                          Island and Vermont.)

*Led by the Clean Energy Ministerial, the EV30@30 campaign redefines the ambition of the CEM’s Electric Vehicles Initiative (EVI), setting the objective to reach
a 30% sales share for EVs by 2030. (http://www.cleanenergyministerial.org/campaign-clean-energy-ministerial/ev3030-campaign)
                                                                                                                                                                    5
EV launch commitments by vehicle
manufacturers
With the success of new electric vehicle OEMs, such as Tesla, incumbent vehicle manufacturers, who deal with long
product to market lead times, have had to react. Many have now made electrification announcements and set targets to
phase out production of ICE vehicles. Many billions of dollars are being spent globally to develop new technologies for
BEVs, as well as PHEVs and FCEVs. This global shift will have significant implications on Australia’s transportation future.

                                                                                  Almost all OEMs have made electrification
                                                                                  announcements including future goals to cease
                                                                                  production of ICE vehicles.

                                                                                  •     Volvo announced that every new car they launch from
                                                                                        2019 onwards will have an electric motor.7 By 2030,
                                                                                        Volvo will only sell fully electric cars.8

                                                                                  •     Ford announced US$ 22 billion investment in EVs
                                                                                        through 2026. They also target to use 100% locally
                                                                                        sourced renewable electricity for all manufacturing
                                                                                        plants by 2035.9

                                                                                  •     Hyundai aims for eco-friendly vehicles to comprise 25%
                                                                                        of its total sales by 2025.10

                                                                                  •     Honda announced its commitment to strive for carbon
                                                                                        neutrality by 2050. To reach the zero environmental
                                                                                        impact objective by 2050, their target is to increase EVs
                                                                                        sales ratio to 40% by 2030, to 80% by 2035, and to
                                                                                        100% by 2040.11

                                                                                  •     Toyota aims to sell more than 5.5 million electrified
                                                                                        vehicles including more than 1 million ZEVs by 2030.12

                                                                                  •     General Motors committed to bring 30 new EVs by
                                                                                        2025 with a $35 billion investment in EV and AV product
                                                                                        development between 2020 and 2025.13 GM’s net zero
                                                                                        commitment: General Motors plans to become carbon
                                                                                        neutral in its global products and operations by 2040. 14

                                                                                  •     BMW has a goal to reduce emissions by 200 million
                                                                                        tonnes with 50% sales from fully electric models by
                                                                                        2030.15

7 group.volvocars.com/company/innovation/electrification
8 www.media.volvocars.com/global/en-gb/media/pressreleases/277409/volvo-cars-to-be-fully-electric-by-2030
9 media.ford.com/content/fordmedia/feu/en/news/2021/03/31/building-a-better-world--ford-announces-steps-towards-carbon-neu.html
10 www.hyundai.news/eu/articles/press-releases/hyundai-and-canoo-to-co-develop-all-electric-platform.html
11 global.honda/newsroom/news/2021/c210423eng.html
12 www.toyota-europe.com/world-of-toyota/feel/environment/environmental-challenge-2050/2030-global-mid-term-targets
13 www.gm.com/electric-vehicles.html
14 media.gm.com/media/us/en/gm/home.detail.html/content/Pages/news/us/en/2021/jan/0128-carbon.html                                             6
15 www.bmwgroup.com/en/company/news.html#ace-1312289094
The following table shows the exponential
                                                                                                           growth in choice of BEV and PHEV models
                                                                                                           and provides insight into the European
                                                                                                           market proving to be representative of
                                                                                                           other key markets.

Total number of new BEV models by year in Europe16
180

160                                                                                                                                   FCA*
                                                                                                              Mazda
140
                                                                                                              Suzuki                  Toyota-Lexus
120
                                                                                                              Honda                   BMW Group
100
                                                                                                              Tesla                   Renault-Nissan
80
                                                                                                              Ford                    Daimler
60

40
                                                                                                              Jaguar Land Rover       PSA**

20                                                                                                            Volvo-Geely             Volkswagen

0                                                                                                             Hyundai-Kia
     2012 2013 2014 2015 2016 2017 2018 2019 2020 2021 2022 2023 2024 2025

Total number of new PHEV models by year in Europe17
180

160                                                                                                            Mazda               Renault-Nissan
140
                                                                                                               Subaru              PSA**
120
                                                                                                               Honda               BMW Group
100
                                                                                                               Ford                Toyota-Lexus
80
                                                                                                               Hyundai-Kia         FCA*
60

40
                                                                                                               Daimler             Volkswagen

20                                                                                                             Volvo-Geely

0                                                                                                              Jaguar Land Rover
     2012 2013 2014 2015 2016 2017 2018 2019 2020 2021 2022 2023 2024 2025

* Fiat Chrysler Automobiles      ** Peugeot Societe Anonyme Group
16,17 www.transportenvironment.org/sites/te/files/publications/2019_07_TE_electric_cars_report_final.pdf                                             7
An introduction to electric
vehicles

                               Conventional                     Hybrid                   Plug-in hybrid           Electric         Hydrogen

 Source of energy

       Consumption

 Tailpipe emission

Comparison of tailpipe emissions of conventional vehicles (ICE), hybrid (HEV), plug-in hybrid (PHEV), Electric (BEV), and
Hydrogen (FCEV)18

             ICE                               HEV                              PHEV                         BEV                   FCEV

               ICE                               ICE                               ICE
           Regenerative                      Regenerative                      Regenerative                Regenerative             Regenerative
             Braking                           Braking                           Braking                     Braking                  Braking

                                               Electric                          Electric                    Electric                 Electric
                                                Motor                             Motor                       Motor                    Motor

                                                                                 Battery
            petrol /                           Battery                                                       Battery                  Battery
           DIesel Tank
                                                petrol/                           petrol/                                            HYDROGEN
                                              DIesel Tank                       DIesel Tank                                          FUEL CELL

 Opportunities to utilise  Strong transitional     Electric range of 40-   Can be zero carbon                                Can be zero carbon
 biofuels such as E10, option with broadening       50 km may reduce       emissions and zero                                 emissions and zero
 B5 and B10 to reduce       availability in the     emissions and be       NOx if charged with                                NOx. Technology is
    particulates (20-     passenger segment.     more practical in some     renewable energy.                                 expensive over the
30%19), GHG emissions                           instances in the coming    Most practical zero                               coming decade. May
  reduction (1.5-5%).                             few years. If regularly emissions option in the                            work sooner in heavy
                                                driven more than 50 km        next 10 years.                                 vehicle applications.
                                                  the emissions benefit
                                                  reduces significantly.

18 www.wa.gov.au/sites/default/files/2020-11/State_Electric_Vehicle_Strategy_for_Western_Australia_0.pdf
19 CSIRO 2008
                                                                                                                                                   8
Electric vehicle
availability
There are now 31 EV models (BEV and PHEV)20 ranging in price from $41,000 - $260,000 available in Australia, with another
13 models coming in 2021-22.21

Globally, about 370 EV models are available as of 2020 (235 BEV models and 133 PHEV models).22 Companies have made
announcements to introduce 200 new EV models over the next five years.23

The following tables present EVs under $100,000 currently available in the Australian market. Vehicle pricing is subject to
change and also may vary under fleet contracts. State Government entities should note that not all models in the tables
listed below are available for lease through State Fleet, Department of Finance.

Battery Electric Vehicles available now in the Australian market under $100,000

                                                                   ANCAP rating            CO2 (g/km                               Entry Price            Battery
          Make                 Model            Segment                                                     Range (km)**
                                                                      (stars)               tailpipe)                                (AUD)               Size (Kwh)

            BMW                   i3        Small passenger      5                     0                   310                  $71,990              33

            Hyundai             Ioniq       Small passenger      5                     0                   311                  $49,970              38.3

            Hyundai            KONA            Small SUV         5                     0                   484                  $62,000              64

            Kia                  Niro          Small SUV         5*                    0                   450                  $62,490              64

            Mazda               MX30           Small SUV         5                     0                   224                  $70,559              35.5

            Mercedes            EQA            Small SUV         5                     0                   426                  $76,800              80

            MG                  ZS EV          Small SUV         5                     0                   262                  $40,990              44

            MINI               Electric     Small passenger      5                     0                   233                  $55,650              32.6

            Nissan               Leaf       Small passenger      5                     0                   270                  $49,990              40

                                            Light commercial
            Renault          Kangoo ZE                           4                     0                   214                  $50,290              33
                                               van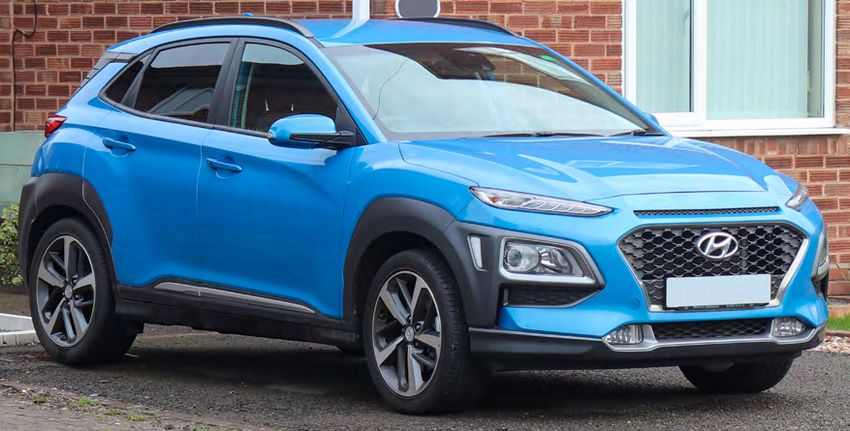
PHEVs available now in the Australian market under $100,000

                                                    ANCAP rating        CO2 (g/km                      Entry Price    Battery Size
      Make             Model         Segment                                          Range (km)**
                                                       (stars)           tailpipe)                       (AUD)           (Kwh)

                                     Medium
        BMW             330e                        5              48                59              $84,900         12.4
                                    passenger

        Hyundai         Ioniq     Small passenger   5              26                63              $47,950         8.9

        Kia             Niro        Small SUV       5*             29                58              $49,990         8.9

        Mercedes
                       A250e      Small passenger   5              34                61              $64,800         15.6
        Benz

        Mercedes                     Medium
                       C300e                        5              46                43              $84,472         13.5
        Benz                        passenger

        Mercedes
                     GLC-300e      Medium SUV       5              46                43              $93,800         13.5
        Benz

        MG               HS        Medium SUV       5^^            39                52              $43,000^        16.6

        Mini         Countryman     Small SUV       5              54                61              $67,818         9.6

        Mitsubishi    Outlander    Medium SUV       5              43                54              $47,990         13.8

                       XC40
        Volvo                       Small SUV       5              50                44              $66,990         10.7
                      Recharge

                      XC60 T8
        Volvo                      Medium SUV       5              50                44              $95,333         10.4
                      Polestar

                                                                                                                                 10
Evaluating electric vehicles for
your fleet
The following tables provide information to evaluate vehicles for your own fleet. Key considerations will be the range of the
vehicle in your driving environment, the time it will take to charge, purchase price and the total cost of ownership (TCO) per
km against alternative choices.
Other factors that will impact on the TCO will be how long you hold the vehicle for (longer is generally better with EVs) and
how many kilometres you travel each year (those that drive further achieve a better payback).
Notes on the tables below:
Electric range is based on standard testing
The time to charge is based on the time
conditions. Range will vary by over 20%
to fill battery to full from empty. This is
depending on driving conditions, for
assuming an average charging efficiency
example highway or city and whether you
of 88%.
use air-conditioning.
For more information on available cars in Australia, visit fleets.chargetogether.org and consider signing up to Australia’s
first online free electric vehicle transition platform - BetterFleet.
Costs in the tables below are intended as a guide only and State Government entities wishing to lease an EV through
State Fleet, Department of Finance, should refer to the on-line e-decision aid for total operating costs relevant for State
Fleet vehicles.
Small passenger vehicles
Operational Purchase TCO/
Type of vehicle Model Electric range Time to charge CO2/km^
costs price km*
Annual $970 AC household power
Including: City 59 km point 2.3 kW 26 hrs Tailpipe - 26g
Small
Hyundai IONIQ Servicing $305 Highway 47 km AC wall charger Well-to-Wheel
passenger $47,950 $0.64
Premium Tyres $188 WLTP 63 km 7.4 kW 8:42 hrs - 83g
PHEV
Fuel $162 NEDC 75 km DC fast charger
Electricity $293 50 kW 02:12 hrs
AC household power
Annual $778 point 2.3 kW 17.75
City 293 km Tailpipe - 0g
Small Including: hrs
Hyundai IONIQ Highway 233 km Well-to-wheel
passenger Servicing $280 AC wall charger $49,970 $0.63
Elite WLTP 311 km - 103g
BEV Tyres $188 7.4 kW 05:30 hrs
NEDC 373 km
Electricity $310 DC fast charger
50 kW 1.5hrs
AC household power
Annual $839 City point 2.3 kW 17:23
Small Including: 255 km hrs Tailpipe - 0g
passenger Nissan LEAF Servicing $277 Highway 202km AC wall charger $49,970 $0.64 Well-to-wheel
BEV Tyres $188 WLTP 270 km 7.4 kW 06:06 hrs - 150g
Electricity $374 NEDC 324 km DC fast charger
50 kW 48 min
Annual $2,253
Tailpipe -
Including:
Small Hyundai i30 176g
Servicing $299 N/A N/A $30,220 $0.50
passenger ICE Elite Well-to-wheel
Tyres $188
- 216g
Fuel $1,766
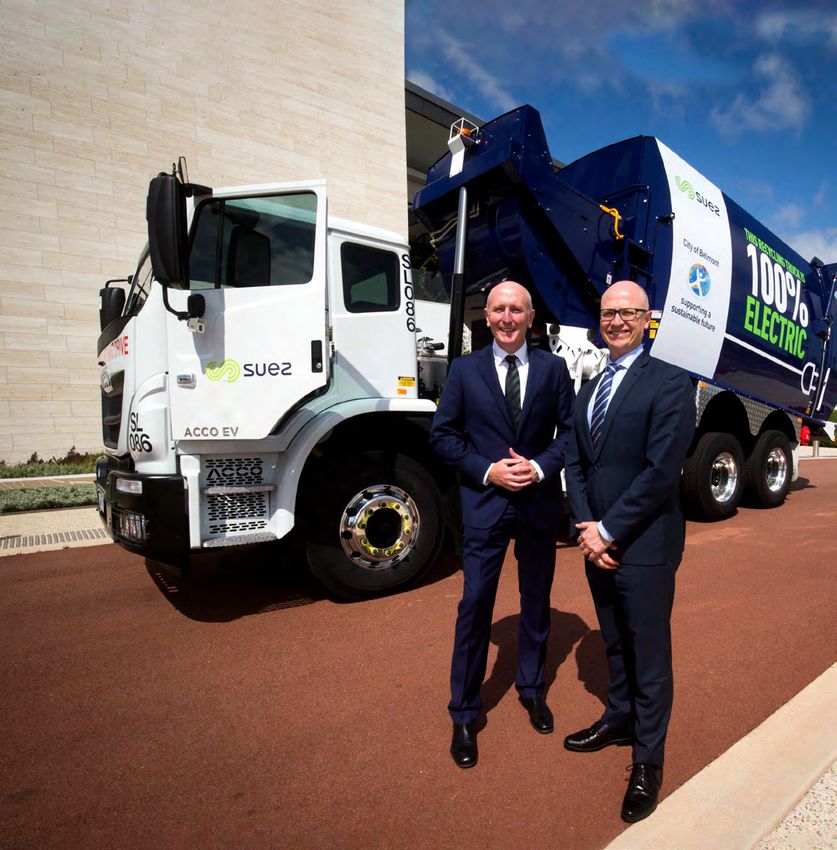
11The Western Australian
Department of Finance’s 2020
Hyundai Electric Ioniq is the
department’s most utilised pool
vehicle being booked 65%
more than the average pool
vehicle. It is charged using a
22 kW wall-charger installed at
the department’s main office
Western Power’s 10 PHEV building.
Outlanders cost 40% less to
maintain and service compared
with its diesel Outlanders.
The running cost of the PHEV
Outlanders is $0.03 per km
compared with $0.07 per km for
the diesel Outlanders
Medium passenger vehicles
Operational Purchase TCO/
Type of vehicle Model Electric range Time to charge CO2/km^
costs price km*
Annual $1,664 AC household power
City 391.51 km
Including: point 2.3 kW - 22 hrs Tailpipe - 0g
Medium Tesla Model Highway 311 km
Servicing $359 AC wall charger Well-to-
passenger 3 Standard WLTP 415 km $59,990 $0.74
Tyres $188 7.4 kW 4.6 hrs wheel - 116g
BEV Range NEDC 510 km
Fuel $557 DC fast charger
Electricity $560 50 kW 1:55 hrs
Annual $2,495 Tailpipe -
Including: 197g
Medium Toyota Camry
Servicing $176 N/A N/A $45,290 $0.74 Well-to-
passenger ICE SL Sports
Tyres $188 wheel - 239g
Fuel $2,131
* Tesla does not require annual servicing.Estimate is based on
periodic replacement of parts as recommended.
12Small SUVs
Operational Purchase TCO/
Type of vehicle Model Electric range Time to charge CO2/km
costs price km*
AC household power
Annual $722
City 424 km point 2.3 kW 26hrs
Including: Tailpipe - 0g
Small SUV Hyundai Kona Highway 336 km AC wall charger
Servicing $165 $62,000 $0.76 Well-to-wheel
BEV Electric WLTP 449 km 7.4 kW 08.7hrs
Tyres $188 - 115g
NEDC 561 km DC fast charger
Electricity $369
50 kW 2.1hrs
AC household power
Annual $819
City 248 km point 2.3 kW 19:18 hrs Tailpipe - 0g
Including:
Small SUV MG ZS EV Highway 197 km AC wall charger Well-to-wheel
Servicing $192 $40,990 $0.58
BEV Essence WLTP 263 km 7.4 kW 06:42 hrs - 143g
Tyres $188
NEDC 328 km DC fast charger
Electricity $439
50 kW 54 min
Annual $2,227
Tailpipe -
Including:
Hyundai Kona 153g
Small SUV ICE Servicing $319 N/A N/A $30,600 $0.55
Elite Well-to-wheel
Tyres $188
- 179g
Fuel $1,719
Medium SUVs
Operational Purchase TCO/
Type of vehicle Model Electric range Time to charge CO2/km^
costs price km*
Annual $1,664 City 50.94 km AC household power
Including: H i g h w a y point 2.3 kW 06:00 hrs
Tailpipe - 43g
SUV medium Mitsubishi Servicing $359 40.47 km AC wall charger
$47,990 $0.65 Well-to-wheel
4X4 EV Outlander Tyres $188 7.4 kW 2.1hrs
- 142g
Fuel $557 WLTP 54 km DC fast charger
Electricity $560 NEDC 67 km 50 kW 1-2 hrs
Annual $2,345
Tailpipe -
SUV medium Mitsubishi Including: 166g
N/A N/A $34,690 $0.63
petrol Outlander Servicing $479 Well-to-wheel
Tyres $188 - 198g
Fuel $1,678
*TCO/km based on a 5 year term, 14K per year annual distance. This figure is based
on assumptions as provided at https://fleets.chargetogether.org/assumptions/. Every
fleet’s operating condition is different so you should refer to your own operating
history when calculating these figures.
WLTP - The WLTP is a global harmonized standard for determining the levels of
pollutants, CO2 emissions and fuel consumption of traditional and hybrid cars, as
well as the range of fully electric vehicles.
NEDC - The New European Driving Cycle is a driving cycle designed to assess the
emission levels of car engines and fuel economy in passenger cars.
^ Well to wheel includes emissions from electricity used to charge EV/PHEV. Actual
emissions will vary depending on renewable energy % and for PHEVs the % of time
driving on fuel vs electric. Data sourced from https://www.greenvehicleguide.gov.
au/Vehicle/QuickCompareVehicles and based on combined cycle and full lifecycle
values.
13Sustainability of
EVs
Lifecycle emissions
Although BEVs do not produce tailpipe emissions,26 there are greenhouse gas (GHG) emissions associated with the
production of the vehicles and the generation of electricity to charge the vehicles. However, when considered over the
whole life cycle, EVs have lower GHG emissions than ICE vehicles.27 EV emissions can be reduced further by using clean
renewable energy in battery production and vehicle charging.
• A 100% BEV deployment can result in 63%-65% emissions reduction over the lifetime usage.28
• An average BEV charged using power from WA’s SWIS produces 30% less GHGs than an average ICE in Australia.29
• There are no operational GHG emissions if the BEVs are charged by electricity generated by renewable energy, or if
FCEVs are powered by renewable hydrogen.
Noxious tailpipe emissions
The transport sector is a major contributor to poor air quality because of noxious emissions generated during vehicle
operation. The major pollutants (i.e., NOx, SOx, COx, HCs, VOCs, PM) associated with fuel combustion in vehicles are
known to cause respiratory illness, cardiovascular diseases, and cancer.30
Unlike conventional ICE vehicles, EVs create no noxious tailpipe emissions, contributing to cleaner air and better health.
Recycling of batteries
The recycling of batteries is an essential part of EV end-of-life management, not only for environmental and safety reasons
but also for the security of resource supply. The global EV battery recycling market is expected to exhibit 19% compound
annual growth rate between 2019-25 with the total value of about US$ 3 billion by 2025. Companies around the world are
extracting valuable materials from batteries by recycling. For example, Li-cycle, a Canadian company, is already recycling with
a current capacity of 10,000 tonnes of Li-ion batteries per year achieving 95% recovery of battery
grade materials.33,34 The State Government is assessing opportunities for the development of
a local battery recycling industry in Western Australia.
26 www.epa.gov/greenvehicles/explaining-electric-plug-hybrid-electric-vehicles
27 www.transportenvironment.org/sites/te/files/downloads/T%26E%E2%80%99s%20EV%20life%20cycle%20analysis%20LCA.pdf
28 www.mdpi.com/2071-1050/11/16/4328/htm
29 www.climateworksaustralia.org/resource/the-state-of-electric-vehicles-in-australia-second-report/
30 www.eea.europa.eu/publications/explaining-road-transport-emissions
31 link.springer.com/chapter/10.1007/978-3-319-69950-9_12
32 www.marketresearchfuture.com/reports/electric-vehicle-battery-recycling-market-8326
33 li-cycle.com/ 14
34 spectrum.ieee.org/energy/batteries-storage/lithiumion-battery-recycling-finally-takes-off-in-north-america-and-europePlug types and applications There are specific chargers made for home, work or public charging, with options available for faster and more convenient charging. Many fleet applications install 7.4 kW chargers; however, some are starting to consider 22 kW (AC) charge stations. Although some vehicles cannot charge at this speed yet, they can be similar in cost to 7.4 kW chargers once installed and they are more ‘future proof’ for advancements in electric vehicle maximum charge rates. At this stage in the market it may be advantageous to install one charger per vehicle, until organisations become more comfortable with electric vehicles. The Federal Chamber of Automotive Industries (FCAI) created a de facto standard in Australia when it endorsed the Type 2 (Mennekes) plug for AC charging and both the CCS and ChaDeMo for DC charging. For AC charging, the ‘Type 2’ connector is currently used by all EV manufacturers and is now the standard for EVs in Australia. For DC charging, there are two plug types: 1. CHAdeMO: used internationally by Japanese manufacturers Mitsubishi, Nissan and Toyota. In Western Australia, 20.3% of EVs have CHAdeMO plugs, including the Nissan Leaf. 2. Combined Charging System (CCS): allows AC and DC charging using the same plug. This plug is mandated in Europe and is becoming the standard in all 220-240V 3-phase countries (except China). In Western Australia, about 80% of EVs have CCS plugs or adapters to enable charging using CCS plugs. Most Australian EVs35 are supplied with Type 2 (Mennekes), and either ChaDeMo or CCS sockets. There are also adaptor cables available, for example to convert Type 1 to Type 2 inlets. 35 The Mitsubishi Outlander PHEV has a Type 1 plug, but a Type 1 to Type 2 converter is readily available. Tesla X and S require a relatively cheap CSS converter. 15
Charger speeds, types, applications and potential costs*36

   Common            Power       Charge                     Time to charge                                     Cost Per
                                               Power                                  Application                             Apperance        Typical location
    Name             Level        Type                      100km of range                                     Station37

                                                                                                                                              Any location with a
                                   Wall                                                                        Installation                  normal power point:
 Slow charging     Level 1                     2.3 kW         8 hrs or more          Home charging
                                  socket                                                                           only                      apartments, houses,
                                                                                                                                                   buildings

                                                                                     Dedicated or
                                               3.5 kW          5 hr 43 min
                                                                                  scheduled charging
                                                                                                                 $2,000
                                                                                                                    -
 AC fast                           AC                                                                                                        Houses, buildings and
                   Level 2                     7.4 kW          2 hr 42 min            Heavy duty                $10,000
 charging                        charger                                                                                         Type 2          parking lots.
                                                                                     dedicated or                              (Mennekes)
                                                                                  scheduled charging
                                              22.1 kW             54 min

                                                                                     Multi-purpose
 DC fast                                                                               charging,                $5,000 -
 charging                        DC wall                                              opportunity               $20,000
                                                25 kW             48 min
 or rapid                        charger                                               charging
 charging

                                                50 kW             24 min                                                                     Public roads, petrol
                   Level 3                                                           Public journey                                          stations and parking
 Tesla super-
                                               100 kW             12 min              enablement,                                                     lots
 charging                          DC                                                                          $75,000 -
                                                                                      Heavy duty
                                 charger       120 kW             10 min                                       $400,000        Combined
                                                                                      opportunity                               Charging
                                                                                        charging                              System (CCS)
 Ultra-fast
                                              < 350 kW       less than 10 min
 charging

                                                                                                                                “Charge
                                                                                                                               de Move”
                                                                                                                              (CHAdeMO)

 *For vehicle with driving energy efficiency of 20 kWh/100 km

*Costs can be highly variable and will reduce on a per unit basis with scale.

36 Costs include hardware, software, civil and electrical works
37 DC fast chargers commonly come in dual-port configurations. Costs shown here are for the complete charger                                                      16
AC charging
vs DC
There is a fundamental difference between AC and DC chargers that enables DC chargers to deliver higher power and thus
shorter charge times. Ultimately, the battery of an electric vehicle must be charged with a direct current (DC) power source.
This is shown by the red arrows in the diagram below.
DC charging vs AC charging
17Charging infrastructure
This section will outline how each component of the charging station contributes to the overall cost of a charging station
installation. When installing charging stations you will need to consider the charger itself, electrical, civil, site works and
connectivity.
Key cost components of installing charging infrastructure
Item Component
Electric vehicle supply equipment
• The charger unit, connectors, pole mount
(EVSE)
• Cable, conduits, distribution board
• Metering (Class 1)
Electrical
• Transformer*
• Labour
• Trenching, tunnelling, boring
Civil • Repairing
• Labour
• Signs, bollards
Site works • Road markings
• Labour
• 4G/5G; Ethernet Cable (fibre / copper), WiFi
Connectivity
• Software installation
It is important to note that the charging infrastructure cost
estimates in this brochure are indicative only and current
only at the date of publication. Each location will require
a site inspection for an accurate installation cost estimate
before the roll out of the EVSE solution. Civil and electrical
costs are derived from case studies and industry analysis.
Electricity network connection fees can vary by an order of
magnitude if network augmentation or upgrade is required.
The ChargeTogether website provides information on
charging infrastructure suppliers in Western Australia
and further detail on the installation process. Visit fleets.
chargetogether.org
18Charger selection
criteria
Cost for components of electric vehicle supply equipment
Component Description Cost
DC chargers are inherently more expensive than AC
AC cost range:
chargers because of the additional hardware, called a
$1,500 to $10,900
rectifier, required to convert the current from AC to DC.
Type: AC or DC
The purpose of this design is to deliver a higher power to
DC cost range:
the vehicle, so DC chargers are heavier duty, with thicker,
$20,000 to $35,000+
heavier and stiffer connectors which all add to the cost.
EVSE with higher power delivery does so by utilising a higher
amperage current. Most AC EVSE delivers power at either 3-phase power delivery
Power output 16 A or 32 A, with a 3-phase supply facilitating higher power incurs a 5% increase in
at the same amperage. Commercial-grade chargers are charger unit cost
equipped for both 16 A and 32 A.
Double port versions
can cost 17% more than
Some EVSE are available in single and double port versions
single port versions.
(i.e. capable of charging two vehicles). While the double port
Number of ports However, on a per-port
version is more expensive, on a per-port basis, it is cheaper
basis, a double port
than installing two single-port versions.
version costs 42% less
than a single port version.
Pedestal-mounted EVSE is generally more expensive than
wall-mounted EVSE for several reasons:
Overall costs for pedestal
Mount type: Wall or designs are between
• The pedestal mount itself has a material cost
pedestal 20% and 30% more
• For pedestal-mounted EVSE, the electrical circuit must
expensive.
pass underground. The civil work involves trenching/
tunnelling and repairing
19Charging and
demand management
The energy delivery of EV charging consists of two components:
The rate at which charging happens, The amount of energy required to charge
or charge level. Measured in kilowatts the battery. Measured in kilowatt-hours
(kW) (kWh).
As a business introduces more electric vehicles, the level of charging (kW) is increased and may lead to some additional
site infrastructure requirements. This can be managed to a degree through smart charging (systems optimising energy
consumption between vehicles and other loads as well as time of day), solar installations or local battery storage.
Installing smart-enabled or capable chargers now can reduce future costs by enabling participation in future grid services
or use of charging control to assist reduction in overall electricity costs.
Innovations are also occurring in vehicle to home and vehicle to grid which may enable your fleets to further reduce power
bills and provide some local reliability services to your facilities. In addition, some EVs are equipped with vehicle to load
functionality and are able to charge electric devices such as power tools and laptop computers.
The benefits of connectivity
Having chargers with an internet connection provides a number of benefits. Firstly, this allows for more dynamic demand
management, potentially lowering power bills. It also allows for more sophisticated billing and can simplify monitoring for
maintenance, as well as being able to facilitate driver or vehicle identification, which can assist in cost apportionment.
Nissan
LEAF e+
20Charging at home
Home charging for fleets can require a process to recoup costs for employees. There are several key benefits of home
charging, including:
Reducing the Taking advantage of Ensuring that all Reducing the
need for public the lower household electric vehicles are demand for fleet
charging electricity costs at fully charged for the facility infrastructure
night next day investments
Typically, at home, people can install a 3.5 or 7.4 kW charger; however, it is also possible to charge from a standard 2.3
kW wall plug.
Cost reimbursement
Reimbursements for infrastructure and electricity costs for home-based charging of fleet EVs can be considered as follows:
1. Infrastructure
If the fleet decides to allow for home charging, then clear policy guidelines can ensure that home charging installation costs
are fully reimbursed - including labour, electrical upgrades, charger installation and network service fees.
2. Electricity
When fleet vehicles are charged at home, there may be a need to track and reimburse electrical expenditures. Electricity
consumption from EV charging can be measured in a variety of ways:
Odometer readings: a corporate cost per km could be established, which is seen as a fair reflection of the
average cost per km. This would be the simplest way to manage the issue, given that employees may also
charge at public charging stations.
Telematics devices: Making use of fleet vehicle telematics enables the company to track energy consumption
by vehicle rather than charger. Setting up charging reports by location guarantees that the amount of electricity
consumed at home can be tracked.
Smart or networking-based charging stations: Smart charging stations that are networked have the capacity
to track electricity usage and provide reimbursement. Some networks enable for company accounts, allowing
for use reports to be delivered directly to the company administrator. Additional capabilities such as access
control and charge management may be available with networked stations.
Monitoring through digital meters: Electricity meters are commonly used to assess energy consumption for
invoicing and/or monitoring purposes. The meter must be dedicated to the EV charging circuit or integrated
with a smart home monitoring system in order to track only the EV load. However, there are some restrictions to
this approach. If the charger is ever used by non-fleet vehicles, or if the meter is not connected to a dedicated
EV-only circuit, consumption data for the fleet vehicle will not be accurate.
The correct electricity rate must be applied to the energy consumed for proper reimbursement. This may
include varying time-of-use tariffs.
21Public
charging
Existing chargers:
22 kW or less 50 kW 75 kW 120 kW or higher
Metropolitan Existing South West Existing Wheatbelt Existing Goldfields-Esperance Existing
22 kW or less 90 22 kW or less 39 22 kW 15 22 kW or less 16
50 kW 6 50 kW 12 50 kW 2
Total 16
120 kW or higher 1 120 kW or higher 8 Total 17
Total 97 Total 59
Gascoyne Existing Great Southern Existing
22 kW or lower 9 22 kW or less 12
Total 9 50 kW 3
Total 15
Kimberley
Pilbara
Gascoyne
Mid West
Goldfields-Esperance
Wheatbelt
Perth
Metropolitan
South Great
West Southern
For all available charging stations, refer to
22
plugshare.comWestern Australia electric vehicle
charger map
Intended charging station locations as part of the Western Australian Government’s
electric vehicle fast charging network.
23Maintenance and roadside
assistance
The low complexity of electric vehicles results in only a small number of moving parts throughout
the entire vehicle. In the powertrain this is represented by the stator/rotor, which is zero contact and
does not wear out in a meaningful way, and the motor bearings. Cooling circuits are largely sealed
or lubricated for life, with software updates, brake fluid, wiper fluid, wiper blades, tyre and wheel
alignment and care, air-conditioning servicing and the cabin air filter being the only maintenance
items typically requiring attention.
Major service issues such as motor bearing failure and battery degradation are generally not issues
that arise in the operational life of electric vehicles, though are known to occur on occasion and
are warranty-covered items. Given the relatively recent introduction of these technologies to fleets,
vehicle manufacturers often offer extended warranty on these drivetrain components for peace of
mind. Overall, the cost of maintaining an EV is less than that of an ICE.
Roadside assistance is provided by some EV manufacturers, as well as companies such as the
Royal Automobile Club WA.
24Heavy vehicles
Many fleets include heavy vehicles. Examples of heavy fleets include garbage trucks, tipper trucks or delivery trucks.
Because heavy vehicles often consume a large amount of fuel, moving to zero emissions alternatives can have significant
environmental benefits, and although the purchase prices are much higher, could have a positive payback because of lower
operating costs.
It is important to note that the range of heavy vehicles can be lower than passenger vehicles because of the heavy loads, so
it is particularly important to understand the performance requirements of the vehicles and to independently verify that the
manufacturer’s specifications will be fit for purpose in your own specific operating environment.
25List of abbreviations
Abbreviation Definition
BEV Battery electric vehicle
COx Oxide of carbon
EV Electric vehicle - including BEV, PHEV and FCEV
EVSE Electric vehicle supply equipment
FCEV Fuel cell electric vehicle
GHG Greenhouse gas
HC Hydrocarbon
HEV Hybrid electric vehicle
ICE Internal combustion engine
NOx Oxide of nitrogen
OEM Original equipment manufacturer
PHEV Plug-in hybrid electric vehicle
PM Particulate matter
SOx Oxide of sulphur
SWIS South West Interconnected System
VOC Volatile organic compound
ZEV Zero emission vehicle
2661
© Government of Western Australia
July 2021
This work is copyright. You may download, display, print and reproduce this material in unaltered form only
(retaining this notice) for your personal, non commercial use or use within your organisation. Apart from any use
as permitted under the Copyright Act 1968, all other rights are reserved. Requests and inquiries concerning
reproduction and rights should be addressed to the Department of Water and Environmental Regulation.
Disclaimer
This document has been prepared by Evenergi and published by the Department of Water and Environmental
Regulation. Any representation, statement, opinion or advice expressed or implied in this publication is made in
good faith and on the basis that the Department of Water and Environmental Regulation and its employees are
not liable for any damage or loss whatsoever which may occur as a result of action taken or not taken, as the
case may be in respect of any representation, statement, opinion or advice referred to herein. Professional advice
should be obtained before applying the information contained in this document to particular circumstances.
This publication is available at our website www.wa.gov.au or for those with special needs it can be made
available in alternative formats such as audio, large print, or Braille.
27www.wa.gov.au
If you lease a vehicle through State Fleet, Department of Finance, and would like more information on leasing
an EV, please contact the State Fleet team at state.fleet@finance.wa.gov.au
Department of Water and Environmental Regulation
Prime House, 8 Davidson Terrace
Joondalup Western Australia 6027
Locked Bag 10 Joondalup DC WA 6919
Phone: 08 6364 7000
Fax: 08 6364 7001
National Relay Service 13 36 77
dwer.wa.gov.auYou can also read