Efficiency of price competition in the telecommunications market
←
→
Page content transcription
If your browser does not render page correctly, please read the page content below
E3S Web of Conferences 159, 03003 (2020)                                 https://doi.org/10.1051/e3sconf/202015903003
BTSES-2020

                    Efficiency of price competition in the
                         telecommunications market

       Alex Borodin1,*, Makpal Zholamanova 2 , Galina Panaedova 3, Svetlana Frumina 4

       1Plekhanov Russian University of Economics, 36, Stremyanny lane, Moscow, Russian Federation
       2L.N. Gumilyov Eurasian National University, 11, Educational building No. 5, Nur-Sultan, Republic
       of Kazakhstan,
       3North-CaucasusFederal University, 1, Pushkin str., Stavropol, Russian Federation, E
       4Financial
                University under the Government of Russian Federation, 49, Leningradskij prospekt,
       Moscow, Russian Federation

                     Abstract. Over the past few years, the Russian telecommunications market
                     has shown one of the highest growth rates in the country. According to RBC
                     media holding, which, in turn, refers to the independent consulting Agency
                     TMT Consulting, in 2018, the market volume increased by 3.4% , 0.6
                     percentage points more than in 2017. The main driver of growth was the
                     mobile business, whose revenue grew by 5% . Among the most likely
                     reasons for such results, it is possible to identify the cancellation of most
                     tariffs that provided unlimited Internet access to subscribers, and the
                     termination of price competition. The rejection of tariff plans with unlimited
                     Internet access allows the operator to increase the ARPU, which also
                     reached a record high in 2018. The purpose of the article is to refute or prove
                     the possibility of using price dumping mechanisms in the oligopolistic
                     telecommunications market in Russia.

       Introduction
       It is considered that the telecommunications market has an oligopolistic structure in most
       countries. In rare cases, only one major operator operates on the market. And the Russian
       market is no exception: there are three main companies (MTS, MegaFon and Beeline) that
       own an overwhelming share of the market. The share of regional operators that operate within
       5 regions is less than 1% of total revenue. Such market structures are formed naturally,
       because the specifics of the industry do not allow a large number of companies to enter the
       market due to extremely high entry barriers. Among the characteristics of the

       *
           Corresponding author: aib-2004@yandex.ru

© The Authors, published by EDP Sciences. This is an open access article distributed under the terms of the Creative Commons
Attribution License 4.0 (http://creativecommons.org/licenses/by/4.0/).
E3S Web of Conferences 159, 03003 (2020)                        https://doi.org/10.1051/e3sconf/202015903003
BTSES-2020

      telecommunications market, it is also possible to identify the uniformity of goods and
      services: the big three operators provide approximately the same conditions to their
      subscribers, and the quality of communication is at the same level. Price competition between
      companies is rather regional in nature, and therefore cannot be considered systematic.
            Among the reasons that strongly influence the development of both the quality and the
      range of services provided, special attention should be paid to the constantly growing number
      of phones, as well as the penetration of smartphones. According to IDC research Agency
      [1],[2],[3], the number of phones worldwide will increase by 200 million units during 2015-
      2018. This result is possible due to the appearance of major East Asian phone manufacturers
      (Xiaomi, MEIZU, OnePlus) on the market and the reduction of production costs, which
      allows you to sell products at lower prices. Smartphone penetration will increase from 72.3%
      to 87.2%, which will allow almost everyone to use high-quality services and connect to the
      new standard networks.
            Researcher Lokotkov in his work on trends in the development of the
      telecommunications market [4], [5] pointed out that the main driver of growth in the
      telecommunications market was Internet traffic. Voice traffic fades into the background, as
      every year there are more and more mobile applications that allow you to exchange voice
      traffic using an Internet connection. Accordingly, the author predicts an increase in the
      number of investment projects related to data transmission. Lokotkov also describes the
      telecommunications market as inert. This means that all external economic shocks affect the
      industry after a certain time [6], [7]. And those operators that have the largest subscriber base
      cope better with them, because mobile communication is mandatory today, and even in crisis
      years, consumers are not ready to give it up.

      Literature review
      Efficiency of price competition in the telecommunications market is an active link in all
      spheres of economy. It is impossible to imagine the modern world without
      telecommunications that have already taken place and which have become habitual, and
      without future ones that contribute to further evolution.
          Kazakhstan researchers as Sayabek Ziyadin, Aizhan Omarova, Raigul Doszhan, Gulnara
      Saparova, Gulim Zharaskyzy [9] wrote about the rapid growth of the market of scientific and
      technical products and the high level of competition, market appropriate solution becomes
      finding ways to commercialization of research products.
          Another one meaning of Ziyadin S., Suieubayeva, S., Utegenova, A. is that the research
      contains a literature review which is giving insight into the fundamental comprehension of
      digital transformation. Findings indicate that even though digital transformation is a well-
      known idea a method for the organized digital transformation of business models is missing.
       Ziyadin S., Streltsova, E., Borodin, A., et al. researched the creation of intelligent modelling
      tools for decision support in the evaluation of intellectual projects submitted for financing,
      as based on qualitatively defined characteristics.
           Mutanov G. and Ziyadin S. [11] wrote that the purpose of their research is to develop
      new methods for assessing the efficiency of production and management. The problem is
      largely actualized by the fact that at present the question of assessing the effectiveness of
      energy systems management.
           According to Mutanov, G., Ziyadin, S., Shaikh, A., [12] recently, the intensity of digital
      technology and innovation has been largely reflected in the level of sustainable economic
      development. In the context of global competition, this can be seen in those countries that
      provide favorable economic conditions and the benefits associated with innovation. The
      development of an innovative economy is an important prerequisite for increasing the
      country's competitiveness.

                                                     2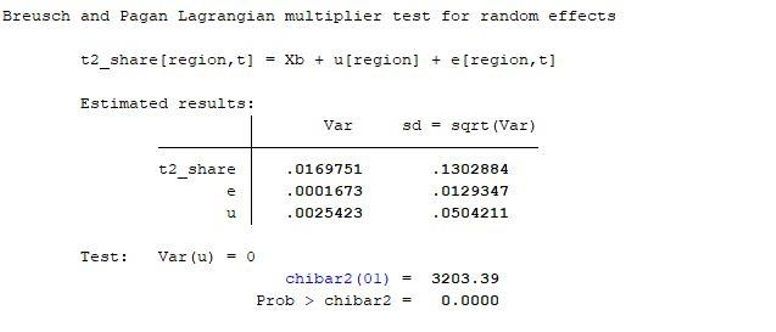
E3S Web of Conferences 159, 03003 (2020)                       https://doi.org/10.1051/e3sconf/202015903003
BTSES-2020

           In other research, Ziyadin S. [13] et al researched the assessment of the innovative
      activity of organizations and its innovative competitiveness are widely used indicators of
      innovative activity of the organization.
           Ziyadin, Streltsova, Borodin, [14] et al devoted to the creation of intelligent modelling
      tools for decision support in the evaluation of intellectual projects submitted for financing,
      as based on qualitatively defined characteristics.
           The basis for the construction of these models, according to several researchers, are the
      following innovative processes: automating the process of processing and researching data,
      but also in the intellectualization of information and organizational processes, the creation
      and implementation of effective methods and the intellectual and auxiliary decision-making
      technologies, company, organization of a phase control system for the intensity of knowledge
      in accordance with established quantitative and qualitative criteria for achieving knowledge-
      based results (products, technologies, etc.) during the implementation of innovative projects.
      Sayabek, Z., Ainur, M., Ulan, T., Gulvira, A., Aizhan, K., & Zhanar, T. consider the role of
      human capital, knowledge and high technology in innovative development [15]. Tleppayev,
      A., Tovma, N., & Zeinolla, S. researhed an important task in modern management is to
      increase energy efficiency as one of the key priorities of economic policy. The purpose of
      this paper is to develop a theoretical and methodological approach and practical
      recommendations aimed at the implementation of evaluation and monitoring of energy
      efficiency policy instruments.

      Methods

      The necessary data was collected only for the main participants of the mobile communication
      market: the big three (MTS, MegaFon and Beeline) and Tele2. Data from large regional
      operators, of which there are only two (Tattelecom-Tatarstan and Motif-YANAO, KHMAO,
      Sverdlovsk and Kurgan regions), were not taken into account, because there are no data for
      them in the same section as for other operators. In addition, taking into account an additional
      operator in 5 regions of the country would lead to a blurring of the share of the "big three"
      and Tele2, which, in turn, would worsen the predictive ability of the model. All of the above
      variables are analyzed from the beginning of 2015 to the end of 2018. The breakdown within
      the year is made into quarters, since revenue data, as mentioned above, is formed on the basis
      of quarterly reports of each operator. Thus, the source data contains 16 observations for each
      region with 32 independent and 1 dependent variable. For data processing in Stata, the time
      periods were changed from 1Q15 to 4Q18 for 2000-2015.
                To assess the effectiveness of the impact of price dumping of mobile services by
      Tele2 on its share in the region, the following variables were collected and analyzed:
                1) share of Tele2 on CDR in each region
                2) Revenue of each operator in each region
                3) Cost of 1 minute, Gigabyte and SMS for each operator in each region
                4) Availability of in-network roaming rates for each operator in each region
                5) the Number of base stations of each operator of all frequencies (2G, 3G, 4G) in
      the regions where Tele2 is present
                Descriptive statistics will not be provided for all variables, but only for data on
      average costs per minute, Gigabyte, and SMS, as well as the availability of BSP, since data
      on revenue and base stations of MTS and competitors are confidential and calculated using
      a methodology that the operator does not disclose. In turn, tariff data is publicly available
      information that can be found on the operators ' website. In addition to the fact that the Tele2
      share is calculated on the basis of the MTS internal methodology, which is also confidential,
      its descriptive statistics do not make much sense, because it changes at different rates in

                                                    3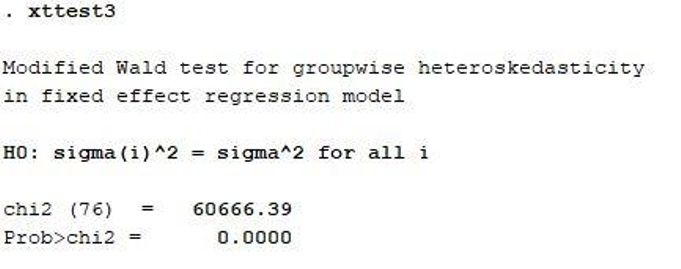
E3S Web of Conferences 159, 03003 (2020)                         https://doi.org/10.1051/e3sconf/202015903003
BTSES-2020

      regions, and information about the minimum and maximum share does not give us any
      additional information about the variable. In addition to descriptive statistics, a table will also
      be presented that will demonstrate the discount in the average cost of a minute, Gigabyte,
      and SMS in the regions.
                The original data was collected in a panel. To work with this type of data
      representation used three types of regressions: pooled (ordinary least squares), fixed effects
      (Fixed effects, FE – applicable in a limited number of objects) and random effects (Random
      effects, RE – allows to account for individual random effects of each object in the model).
                After analyzing the literature on competition analysis, price formation, and trends
      in the telecommunications market, the following hypotheses were formulated regarding the
      effectiveness of price competition in the Russian telecommunications market.
                Hypothesis 1: the main services included in the cost of Tele2 tariffs are lower than
      those of competitors
                The main services include voice, Internet, and SMS traffic. Tele2 positions itself as
      a low-cost mobile operator, but is it really cheaper than its competitors in all regions? And
      do all Tele2 services cost less than the big three operators? There are regions where you can
      observe a glut of the market: the operators of the "big three" only increase the cost of their
      tariffs in them year after year, increasing their revenue. Therefore, it is impractical to enter
      such a market by setting prices below market prices.
                Hypothesis 2: price dumping of mobile services has a positive effect on the share of
      a new market participant
                Tele2 uses price dumping for a long time to form a stable subscriber base. The fact
      that there were no cases when Tele2 entered a particular region, and after some time ceased
      its activities in it, has not yet been recorded. There is every reason to believe that the policy
      chosen by the company is quite successful.
                Hypothesis 3: the absence of HRV in Tele2 in most regions is a strong incentive to
      switch to this operator
                In-network roaming is a service that automatically connects a subscriber to its
      network when moving to another region. Charged traffic beyond the boundaries of the home
      area on the other, higher prices. Most of the tariffs offered by Tele2 do not have this option,
      which means that all voice, Internet and SMS traffic throughout Russia in the network
      coverage area costs the same. Such conditions may appeal to subscribers who, for various
      reasons, are often forced to change their region of residence.
                Hypothesis 4: capital expenditures related to the construction of base stations are
      positively correlated with the share of Tele2 in the region
                Capital expenditures of mobile operators can be divided into 3 large groups:
      investment in various projects, development/opening of retail outlets, and expansion of their
      network through the construction of base stations. The latter type of capital expenditure
      accounts for the largest share among most operators. The need for permanent construction is
      connected both with the desire to improve the quality of communication throughout the
      country, and with the constantly emerging new standards of cellular communication, which
      can not be implemented at the expense of old-style towers.

      Research and results. Building regressions and choosing the
      best model
      In order to get the most appropriate model, you must first generate all three types of
      regressions, and then use tests to determine which one is best suited for a particular case.

                                                      4
E3S Web of Conferences 159, 03003 (2020) https://doi.org/10.1051/e3sconf/202015903003
BTSES-2020
Next, you need to choose the most appropriate model. This can be done using the Wald
test (compares through and FE models), the Broich-pagan test (compares through and RE
models), and the Hausmann test (compares RE and FE models).
The Wald test is performed by the Stata program at the stage of output of results. The null
hypothesis that fixed effects are equal to zero. The results of the test are shown below:
As can be seen from the results, the alternative hypothesis about the inequality of
fixed effects to zero is not rejected, therefore, the FE model is better suited for describing
data than the end-to-end model.
The null hypothesis of the Broich-Pagan test about the equality of the variance of a
random individual effect to zero. Below are the results of the test:
Based on the obtained results, we can conclude that the alternative hypothesis of
inequality zero random individual effects is not rejected, and thus RE-model is better applied
to current data than end-to-end.
In order to determine which of the FE and RE models is better, it is necessary to conduct
the Hausman test. The null hypothesis of this test suggests that the variance of the random
individual effect is non-systematic.
The test showed that p-value < 0.05, which means that the alternative hypothesis is not
rejected. Therefore, the most appropriate model would be a model with fixed effects. In fact,
even before the tests were carried out, it was possible to assume that the FE model would be
chosen as the most appropriate, since this model is most often applicable in the case when a
fixed number of firms is specified.
The next point of the study is to exclude unnecessary variables. The most insignificant
variables will be excluded from the FE model in turn until there are no regressors with p-
value lower than 0.05.
The generated model should be checked for possible problems related to
heteroscedasticity (non-constant variance of the random error), multicollinearity (the
presence of a linear relationship between independent variables), and autocorrelation (the
dependence of model errors over time).
5E3S Web of Conferences 159, 03003 (2020) https://doi.org/10.1051/e3sconf/202015903003
BTSES-2020
To detect the presence of heteroskedasticity in the model, you can use a modified Wald test.
The null hypothesis of this test is that the error variance does not differ by object. Below are
the test results for the model:
As can be seen from the results, p-value < 0.05, and the alternative hypothesis is not
rejected, which means that the model does have heteroscedasticity.
This is followed by checking the model for multicollinearity. You can detect its presence
using the VIF test. The results are presented below:
There are no variables in the test output that have a VIF higher than 10, which allows us to
conclude that there is no multicollinearity in the model.
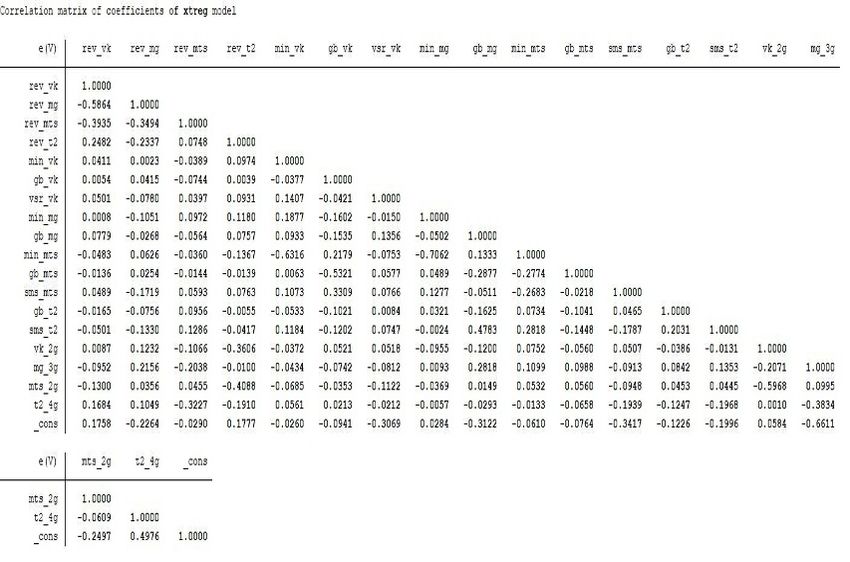
Correlation matrix
6E3S Web of Conferences 159, 03003 (2020) https://doi.org/10.1051/e3sconf/202015903003
BTSES-2020
As can be seen from the matrix, there is no high correlation between variables (above
0.8 modulo). At the same time, a correlation above 0.45 modulo was recorded in 4 pairs of
variables. The high dependence between the rev_vk and rev_mg variables is explained by
the fact that for most regions these operators have opposite subscriber bases in size. There is
no region where MEGAFON and Beeline occupy the top 2 positions in terms of revenue in
the region. Accordingly, this creates a negative correlation between them. Also, in most
regions, MTS has the largest share of revenue, so the cost of a minute is negatively correlated
with the cost of a minute and a Gigabyte by Beeline (which has the lowest revenue among
the big three subscribers), since this operator tries to offer cheaper tariff plans to reduce the
share of MTS. The same reason explains the negative relationship between the 2G base
stations at MTS and Beeline. The other variables show a moderate correlation between them.
Analysis and interpretation of results
The regression coefficients can be interpreted as follows:
1) the Positive impact of Beeline and MegaFon's revenue on TELE2's share is explained
by the fact that the market share is mainly growing at the expense of these operators. The
higher the revenue of these operators in the region, the easier it is for TELE2 to operate, the
greater the share IT receives.
2) the Negative impact of MTS revenue on the share of TELE2 is explained by the fact that
subscribers of this operator are much less likely to change the connection in favor of TELE2.
Accordingly, the higher MTS revenue, the higher its share in the region and the more difficult
it is for TELE2 to grow in terms of CDR share.
3) the Positive influence of the vsr_vk variable on the share of TELE2 partially proves the
hypothesis that the presence of in-network roaming among the big three operators motivates
7E3S Web of Conferences 159, 03003 (2020) https://doi.org/10.1051/e3sconf/202015903003
BTSES-2020
subscribers to change the operator in favor of TELE2. At the same time, the variables vsr_mg
and vsr_mts were eliminated as insignificant, which does not allow us to draw a clear
conclusion about the stated hypothesis. It is noteworthy that the t2_vsr variable was also
excluded from the model. A possible explanation for this result may lie in the fact that the
operator is not represented in all regions, especially in the small number of its presence in
2015. Accordingly, the lack of BSP did not encourage people to switch to TELE2 tariffs,
since getting to a region where the operator does not have its own network, the subscriber
falls into the so-called national roaming, which is charged even more expensive than the
intra-network one.
4) the Positive impact of the cost of a minute and a Gigabyte for the big three operators on
the share of TELE2 confirms the hypothesis that dumping by TELE2 allows you to actively
win a share in the regions. The negative relationship between the share of TELE2 and the
cost of a minute and a Gigabyte also indicates that the lower the cost of the operator's services,
the higher its share.
5) Next, the base stations. Base stations themselves speak of two important factors: the more
of them, the better the operator's communication quality in the region, and the more of them,
the higher the operator's capital expenditures. Thus, it is absolutely natural that there is a
negative relationship between towers of different types for Troika operators and TELE2
shares in the region, because the better the connection for Troika operators, the more difficult
it is for TELE2 to infiltrate the region and poach subscribers. At the same time, as can be
seen from the regression results, some dependencies between variables seem
counterintuitive. For example, why does MEGAFON's 3G network have a positive impact
on the share of TELE2? This can be explained by the fact that MEGAFON has recently been
actively investing in the construction of 4G networks, But this format is not available in all
regions of the country. An example is the Northern regions, where in principle the
construction of base stations is a fairly complex and technically difficult process. At the same
time, TELE2 is actively developing a 3G network, so for regions where a more developed
network is not available in principle, it is easier for the operator to lure MegaFon subscribers
to itself, because MTS and Beeline spend more money on 3G network construction. At the
same time, the 4G network of the Tele2 operator is currently under active development. This
variable should potentially have a positive coefficient, since Internet traffic is the most
consumed option in tariff plans, but this effect will be noticeable later, when TELE2
approaches the Troika in terms of the number of 4G base stations. At the moment, capital
expenditures in this network do not contribute to an increase in the share of TELE2 in the
regions of presence.
1) the Hypothesis that the cost of all services provided by Tele2 operator is lower than that
of competitors. As the descriptive statistics have shown, this statement is not entirely true.
Indeed, on average, the cost of Internet traffic is lower in all regions where the operator is
present. At the same time, the average price per minute of conversation for Tele2 is not the
lowest. Let the difference in price be calculated in kopecks, this fact is already enough to
partially refute the hypothesis. As for the cost of SMS, Tele2 takes the third place in terms
of cost, behind MTS and Beeline. It is likely that this result is a consequence of the
assumption that all operators have similar tariff splits. Based on the low cost of a Gigabyte,
we can assume that the operator generates the main share of revenue from Internet traffic.
Perhaps this is why the cost of minutes for Tele2 was not the lowest.
2) the Hypothesis about the positive impact of price dumping by a new market participant on
its share is confirmed. As mentioned above, the share of revenue generated by Internet traffic
is overwhelming for all operators, namely about 80%, according to the MTS tariff split.
Based on this data, as well as the values of the average price of a Gigabyte, we can say with
confidence that price dumping has borne fruit. It is significant that there is no decline in
8E3S Web of Conferences 159, 03003 (2020) https://doi.org/10.1051/e3sconf/202015903003
BTSES-2020
operator activity in any region where Tele2 is present. On the contrary, its share is steadily
increasing in all regions of its presence.
3) as the final model shows, the extremely low frequency of including in-network roaming
in tariff plans on the part of Tele2 relative to the "big three" operators does not affect the
operator's share in any way. The possible causes of this phenomenon have been described
above. The hypothesis is rejected.
4) active construction of base stations by Tele2 also does not affect the operator's share in the
region. Moreover, the final model recorded a negative impact of the number of 4G towers on
the share of Tele2. As mentioned earlier, this result may be due to the fact that lag is possible
in this dependency. If the number of base stations is similar to those of the big three operators,
it is likely that you will see a completely different result. At the moment, the hypothesis is
rejected.
Conclusion
The emergence of a new company in the telecommunications market is an extremely unlikely
event, because it is hindered by a lot of factors. First, the market structure implies a small
number of companies, and the extremely high entry barriers that are associated with a
particular industry, namely, high capital expenditures for the construction of base stations,
the development of their own SIM cards, and the opening of retail outlets, can hardly be
overcome by a private company. It is simply not possible to imagine a situation in which not
only a new operator appears, but also actively pulls over a share in all regions of its presence,
using price dumping as the main mechanism. However, this is exactly what happened in the
Russian telecommunications market. The state support provided to the operator by
Rostelecom allows Tele2 to conduct quite successful operations with a clear discount of 10-
20%.
The main objective of this work was to analyze the effectiveness of price dumping in
the telecommunications market. For this purpose, the tariff plans of the big three and Tele2
operators for all regions of the latter's presence over the past 4 years were analyzed. As the
study showed, Tele2 does set lower prices for Internet traffic, which form a large part of the
revenue of any tariff. The study also revealed counterintuitive relationships between the mass
construction of base stations and the share of Tele2. Nevertheless, the results of the regression
model, the analysis of descriptive statistics, and the table with the discount of the minute,
Gigabyte, and SMS costs from the application allow us to conclude that Tele2 does use price
dumping, and quite successfully. Within a few years, the company was able to build an
extensive network of 3G and 4G base stations and continues to increase it. The number of
regions of presence has increased many times, and the company's financial indicators are the
only ones among Federal operators that show double – digit growth rates of revenue and net
profit year-on-year. The constantly growing share in all regions of presence proves the
effectiveness of price dumping and calls into question the assertion that the oligopolistic
market is not characterized by price competition.
References
1. Ramon T. Llamas, William Stofega, Anthony Scarsella, Worldwide Mobile Phone
2015-2019 Forecast and Analysis. IDC Consulting (2015)
2. Borodin A.., Shash N., Panaedova G. , Frumina S. , Kairbekuly A., Mityushina I. The
impact of the publication of non-financial statements on the financial performance of
companies with the identification of intersectoral features // Entrepreneurship and
9E3S Web of Conferences 159, 03003 (2020) https://doi.org/10.1051/e3sconf/202015903003
BTSES-2020
Sustainability Issues. No. 7(2). P. 1666-1685. http://doi.org/10.9770/jesi.2019.7.2(61),
(2019)
3. Gurieva L., Borodin A., Berkaeva A. International Scientific Conference "Modern
Management Trends and the Digital Economy:. No. 81. P. 385-389.
https://doi.org/10.2991/MTDE-19.2019.73 (2019)
4. Lokotkov A. A. Telecommunications market: current state and development prospects.
Socio-economic phenomena and processes, 1-2 (023-024), 144-147 (2011)
5. Natocheeva N., Borodin A., Rud N., Kutsuri G., Zholamanova M, Namitulina N.
Development of tools for realizing the potential of financial stability of enterprises //
Entrepreneurship and Sustainability Issues. No. 7(2). P. 1654-1565.
http://doi.org/10.9770/jesi.2019.7.2(60) 2019
6. John Sutton, Market Structure: Theory and Evidence. 42-65 (1991)
7. Michael E. Porter Competitive Structure. Techniques for Analyzing Industries and
Competitors. 95-104 (2005)
8. Mukhtarova, K., Ziyadin, S., Kupeshova, S., & Doszhan, R. Problems of developing the
foundations of sustainable competitiveness of industrial and innovative economy in
Kazakhstan. Economic annals-XXI, (168), 38-43 (2017)
9. Ziyadin, S., Suieubayeva, S., & Utegenova, A. Digital Transformation in Business.
Springer, Cham (2020)
10. Ziyadin, S. Actual Problems of Economics, 419-429 (2012)
11. Mutanov, G., & Ziyadin, S. In E3S Web of Conferences (Vol. 135, p. 04056). EDP
Sciences (2019)
12. Mutanov, G., Ziyadin, S., & Shaikh, A. A. Enterpreneurship and Sustainability Issues, 6
(2019)
13. Ziyadin, S., Shash, N., Levchenko, T., Khudaibergenova, S., & Yessenova,
G. Entrepreneurship and Sustainability Issues, 6, 2180-2193 (2019)
14. Ziyadin, S., Streltsova, E., Borodin, A., Kiseleva, N., Yakovenko, I., &
Baimukhanbetova, E.. Sustainability, 11, 2544 (2019)
15. Ziyadin Sayabek, Madiyarova Ainur, Tlemissov Ulan, Akybayeva Gulvira,
Kurmangalieva Aizhan, Tastemirova Zhanar, Journal Academy of Strategic
Management, 17 (6) (2018)
16. Tleppayev, A., Tovma, N., & Zeinolla, S. Construction of Kazakhstan's system of energy
efficiency indicators for the development of industrial competitiveness, IBIMA (pp.
2071-2079). (3) (2016).
10You can also read