Effects of nightlife noise in a city center - De Gruyter
←
→
Page content transcription
If your browser does not render page correctly, please read the page content below
Noise Mapp. 2021; 8:228–235

Research Article

Gino Iannace*, Amelia Trematerra, and Ilaria Lombardi

Effects of nightlife noise in a city center
https://doi.org/10.1515/noise-2021-0018                                 known for their liveliness and animation at night [3, 4]. In
Received Jan 17, 2021; accepted Apr 25, 2021                            Italy, according to statistics, there are over 29 million Ital-
                                                                        ians who go out every now and then in the evening, more
Abstract: The term Movida takes its name from the evening
                                                                        than 22 million who frequent the historic centers. More-
and night life of the city for their liveliness and animation.
                                                                        over, every week at least once 15.6 million people go out
During the Movida, noise is one of the problems in the city
                                                                        in the evening and of these 4.3 million go to the places of
centers due to the negative effects on the resident popu-
                                                                        the Movida. In Italy, the turnover generated by commercial
lation. This paper reports the effects of noise due to the
                                                                        activities, bars, restaurants and clubs exceeds 70 billion
Movida phenomenon within the city center in southern
                                                                        euros and employs approximately 1.5 million people and
Italy. Along the roads affected by the Movida phenomenon,
                                                                        is the only sector where the prevalence of employees are
the values of sound levels in dBA were measured both with
                                                                        young people. In economic terms, the volume of business
fixed stations with a sound level meter and with mobile sta-
                                                                        produced by Movida is equal to that produced by agricul-
tions by wearing a noise dosimeter a participant of Movida.
                                                                        ture. In recent years, there has been increasing talk of the
The measured noise levels are between 85 dBA to 90 dBA.
                                                                        problem of nightlife noise, even if some areas are a sea-
The noise levels show that the Movida phenomenon gener-
                                                                        sonal phenomenon that creates a widespread economy,
ates disturbing conditions on the resident population with
                                                                        but not in the city centers where there are many people
consequent conflict between club managers, patrons and
                                                                        who attend nightlife throughout the year [5]. The majority
residents.
                                                                        of citizens associate a positive opinion with the Movida
Keywords: noise, movida, acoustic measurements, dBA,                    phenomenon, while people who live in areas where the
sound pressure level, nightlife, annoyance, young people,               Movida insists express a negative opinion due to the effects
leisure noise, city of Aversa                                           of noise and traffic [6–8]. In addition, the average age of
                                                                        people who frequent the Movida places is between 15-35
                                                                        years. But the Movida phenomenon also brings negative
                                                                        effects, from opportunity to problem. The sale of alcohol,
1 Introduction
                                                                        failure to comply with the closing times of the premises
                                                                        contribute to transforming the places of the Movida from
The Movida phenomenon is one of the most important prob-
                                                                        an opportunity for fun and entertainment to an occasion of
lems in the city centers during the nightlife, due to traffic,
                                                                        tension, with problems of managing public order. The press
public order and above all the effects of noise on the resi-
                                                                        reports that due to the unwanted effects of the Movida, the
dent population generated by Movida visitors.
                                                                        anger of the residents results in the throwing of objects
     The word Movida comes in the classic definition of
                                                                        from the windows on the shops below, with requests for
the vocabulary «move», therefore «movement». The word
                                                                        intervention by the police. Furthermore, in October 2017
Movida is associated with a fashion born in Spain, in the
                                                                        “due to the man-made noise caused by the din of the pa-
80s of the twentieth century, following the social and cul-
                                                                        trons of some places on public land”, the Municipality of a
tural climate which returned to life after the end of the
                                                                        city in Northern Italy was sentenced to compensate two of
Franco regime. The Movida represents one of the most pop-
                                                                        its citizens with a sum of 50,000 euros [9]. Therefore, the
ular cultural phenomena in our recent society history [1, 2].
                                                                        out-of-control noise generated by the people who frequent
So the term Movida took on the name of the nightlife of the
                                                                        the Movida can cause problems of a judicial nature for city
cities, with specific reference to that of the Spanish cities,
                                                                        municipality [10, 11]. Thus, some municipality have tried to
                                                                        limit the negative effects of Movida by introducing bans on
                                                                        the sale of alcohol, blocking authorizations for the opening
*Corresponding Author: Gino Iannace: Università della Campa-
                                                                        of new premises and the introduction of restricted traffic
nia Luigi Vanvitelli – Borgo San Lorenzo, 81031 Aversa, Italy; Email:
gino.iannace@unicampania.it                                             areas [12]. For example, in some cities, itinerant trade and
Amelia Trematerra, Ilaria Lombardi: Università della Campania           the consumption of alcohol along the streets is prohibited,
Luigi Vanvitelli – Borgo San Lorenzo, 81031 Aversa, Italy

  Open Access. © 2021 G. Iannace et al., published by De Gruyter.              This work is licensed under the Creative Commons Attribution 4.0
License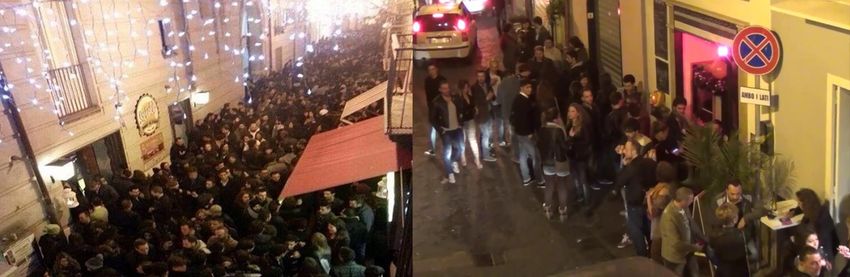
Effects of nightlife noise in a city center | 229
with the limitation of the opening hours of the premises of excessive noise and therefore disturbance to the pub-
and with the request to establish a security service to avoid lic peace, complaining of the right to rest in the evening
the effects of gathering outside the premises. thus, reducing and night hours. The complaints resulted in incessant re-
unwanted noise on the resident population. quests to law enforcement agencies, with interventions in
In Italy there is a national law on noise pollution (Law the media complaining of the absence of controls, exces-
n. 447 year 1995) [13] and some municipalities have adopted sive noise and negative effects on the health of residents.
noise regulations based on summer tourism activities and To meet the complaints, the municipality of Aversa has is-
the required quality of life of the resident population. sued strict rules to make the Movida and citizens coexist
Some municipalities require an acoustic monitoring peacefully, but these rules are not always respected. The
service when opening new premises to assess the effects noise is generated not only by the music emitted by the
of noise due to the presence of a new activity and if the sound reinforcement systems, but also by the shouting of
noise limits were to be exceeded, take mitigation measures. the patrons near the premises, the stop of the patrons goes
In other cities, the local police have been equipped with well beyond the closing time of the premises, even until
sound level meters to assess the acoustic climate in real 4:00 in the morning.
time, or with economic sensors installed on smartphones,
fixed noise control units have been created [14–20]. Furher-
more World Health Organization recently published specific
environmental noise guidelines for Europe, where leisure
3 Materials and methods
noise is considered a health threat for European citizens
To understand the effects of unwanted noise generated by
that should be reduced [21]. The recommendations are day-
Movida, a series of sound level measurements were car-
time road traffic noise levels should be reduced to below
ried out in the area of interest during the weekends in the
53 dB Lden; night-time road traffic noise levels should be
spring season in the absence of wind and atmospheric pre-
reduced to below 45 dB. While for leisure noise exposure
cipitation. The stretch of road concerned has a length of
recommends reducing the yearly average from all the noise
about 400 meters, with a width of about 4.0 meters and
sources combined not over to 70 dB LAeq,24h, there is no
the buildings have an average height of about 13 meters
risk for permanent hearing impairment below this exposure
(ground floor and two superimposed floors). The road is
level.
made of asphalt, while the walls of the buildings are plas-
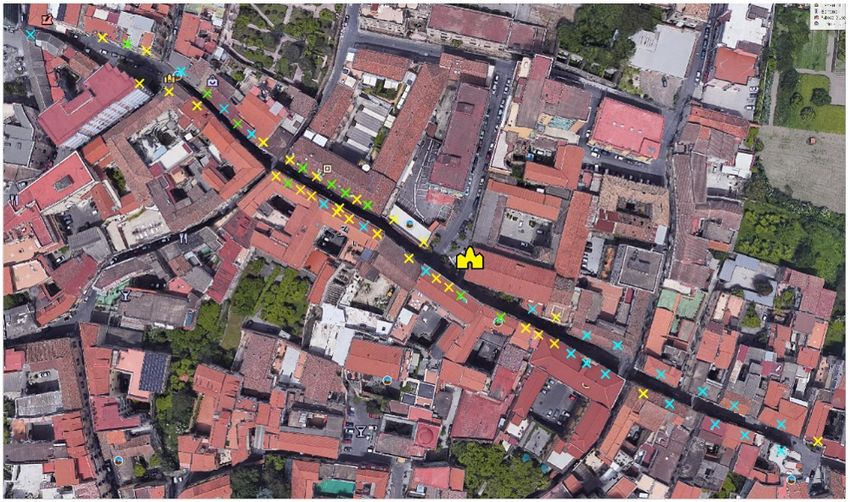
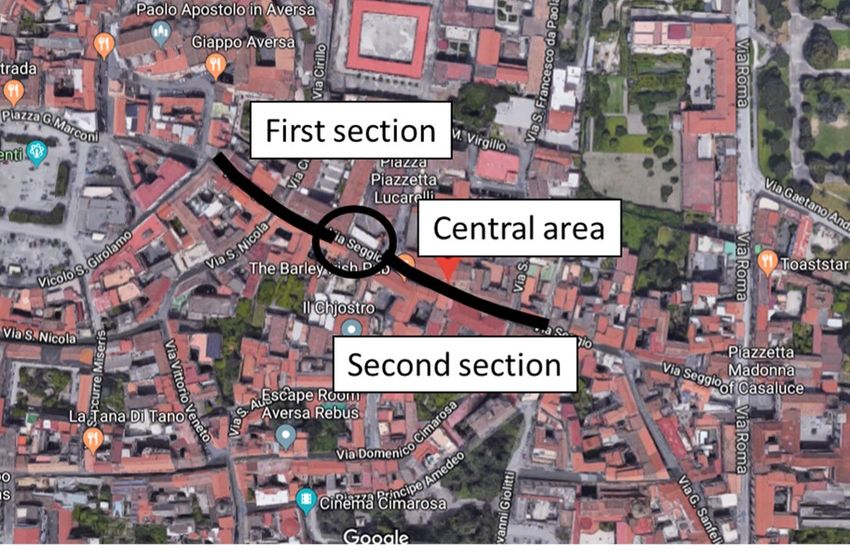
tered. Figure 1 shows the aerial view of the route where
the Movida takes place with an indication of the type of
2 Case study of the Movida activity: church, shops, bars, pubs, restaurants. To better
understand the effects of the Movida, the area has been
The City of Aversa (Province of Caserta, southern Italy) has divided into three areas, a first section, a central zone and a
55,000 inhabitants. It is located a few kilometers from the second section. Figure 2 shows the view of the subdivision
City of Naples and the center of the “Agro-Aversano” with a of the area affected by Movida.
population of about 350 thousand inhabitants [22]. The cen- In fact, during the day the road is almost deserted, with
ter of the city of Aversa has a plan with concentric circles few commercial activities (mostly some historical ones such
being built during the medieval period. In the city center on as tailors or pastry shops) with limited traffic zone not ac-
weekends, in a restricted area, the phenomenon of Movida tive, the flow of people is reduced to the inhabitants of the
is concentrated, frequented by young people who gather street. In night period the road is totally transformed: with
after 11pm. Young people entertain themselves in the area, a lot of people that are not being able to walk smoothly. All
accompanied by the music emitted by the sound diffusion commercial activities such as bars, pubs and nightclubs
systems of the premises public that sell drinks. Initially, are open and entertain people with loud music (sometimes
the Movida was concentrated only in commercial activities even live music, up to times that often go beyond what is al-
scattered throughout the city. But over the years commer- lowed by the municipal regulation); and the limited traffic
cial activities have been opened in the historic center along zone is active from 8:00 pm to 2:00 am.
the “via dei baretti”, in this way all the Movida activities The municipality of Aversa has regulated the territory
have been concentrated in one place. In the evening, the in acoustically homogeneous zones. The nightlife area is
Movida area is frequented by people of the medium-young classified as: area of intense human activity. this class in-
age group. So, in recent times the city nightlife has become cludes urban areas affected by intense vehicular traffic,
a problem for the residents of the city center, who complain with a high population density, with a high presence of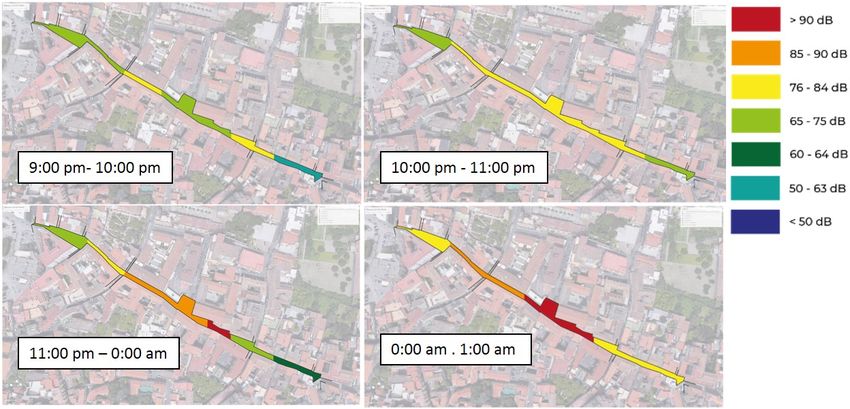
230 | G. Iannace et al.

Figure 1: Aerial view of the route where the Movida takes place with an indication of the type of activity: church, shops, bars, pubs, restau-
rants

Figure 2: View of the subdivision of the area affected by Movida
Effects of nightlife noise in a city center | 231

commercial activities and offices, with the presence of craft
activities. The emission sound limits are equal to 65 dBA in
the daytime period, while in the nighttime period are equal
to 55 dBA

4 Results
A first acoustic measurement was performed at a fixed point
throughout the night period, placing a sound level meter           Figure 4: Time history of the sound pressure level in dBA, measured
inside a house close to the area of interest. Acoustic mea-        in the first section (11:00 pm – 11:20 pm)

surements were carried out in a room located on the second
floor of the building, in the most acoustically unfavorable
condition, that is with the windows open. The dimensions
of the room were width, length 4.0 m, height 3.0 m. The
window was 1.2 m wide and 1.2 m high. The sound level
meter was on a tripod at a height of 1.6 m from the floor, and
at a distance of 1.0 m from the window. During the acoustic
measurements the wind was absent.
     Figure 3 shows the time history of the sound level for
this fixed position [23]. Registration starts at 9:00 pm and       Figure 5: Time history of the sound pressure level in dBA, measured
ends at 4:00 am the next day. Already at 9:00 pm the sound         in the central area (11:20 pm – 00:16 am)

levels are equal to 50 dBA and then increase, until reaching
the maximum of 60 dBA around 01:30 am in the morning.
The sound levels then slowly tend to decrease, the sound
phenomenon is reduced after 3:30 am.

                                                                   Figure 6: Time history of the sound pressure level in dBA, measured
                                                                   in the second section (00:20 am – 01:10 am)

Figure 3: Time history of the sound level measured on the second
floor of a house close to the nightlife area                       along the first 200 meters of road, the person moved the
                                                                   sound level meter slowly along this stretch.
                                                                        Figure 5 shows the time history of the sound pressure
     Subsequently, to better understand the noisy phe-             level in dBA, it is the second acoustic measurement corre-
nomenon, acoustic measurements were carried out in the             sponds to the central area of the road itself, the sound level
street where the nightlife takes place. The first series of        was in a fixed position.
measurements was performed with an integrating sound                    While Figure 6 shows the time history of the sound
level meter, used in the field by a person who attended the        pressure level in dBA, it is the third acoustic measurement
Movida. The integrating sound level meter in use is a 01 dB,       corresponds to the second stretch of the road of the next
so it is possible to obtain the time history and equivalent        200 meters, also in this case the person moved the sound
sound levels in dBA [24–28]. The duration of the acoustic          level meter slowly along this stretch.
measurements is approximately two hours, starting at 11:00              Table 1 shows the summary of the acoustic measure-
pm and ending at 01:10 am.                                         ments, times and equivalent sound pressure level (dBA)
     Figure 4 shows the time history of the sound pressure         measured. In the first (Figure 4) and in the second measure-
level in dBA, corresponds to the first acoustic measurement        ment (Figure 5) the sound levels measured are constant.
                                                                   In the second section (Figure 5) the sound level measured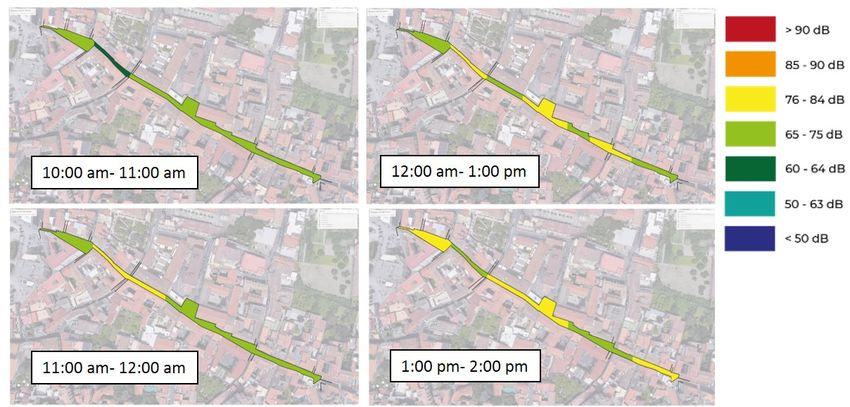
232 | G. Iannace et al.

Figure 7: Map of the distribution of the sound level in dBA along the affected stretch of road as a function of the measurement time

Table 1: Summary of the acoustic measurements, times and equiva-        Table 2: Summary of measurements performed with dosimeter in
lent sound pressure level (dBA) measured                                the daytime period

   Acoustic                   Hours                Equivalent                  Hours             Maximum sound           Minimum sound
 measurements                                    sound pressure                                   pressure level          pressure level
                                                   level (dBA)                                     values, dBA             values, dBA
   first section           11:00 pm –                 86.0                  10:00 am –                 72.0                    64.0
                            11:20 pm                                         11:00 am
   central area            11:20 pm –                  88.0                 11:00 am –                  80.0                    65.0
                            00:16 am                                         12:00 am
 second section            00:20 am –                  89.0                 12:00 am –                  77.0                    70.0
                            01:10 am                                         1:00 pm
                                                                            1:00 pm –                   78.0                    72.0
                                                                             2:00 pm
tends to increase; in this case the increase of the sound
levels are due to the constant shouting of the patrons and
the music spread by the sound system. The first and second              of noise exposure for a given period of time. The acquisi-
section are influenced by the continuous shouting of the pa-            tions were carried out along the entire stretch of road where
trons, while in the third section (Figure 6) the sound levels           the Movida phenomenon takes place [27, 28]. The acous-
are influenced by the music emitted by the loudspeakers                 tic measurements were performed in different time. The
installed outside the shops.                                            acquisitions were made every hour and with a distance of
     From Table 1 it can be seen that between 11:00 pm and              about 50 meters between one point and another. A first
1:00 am the sound level measurements report the equiva-                 acoustic measurement was performed in the morning from
lent sound levels measured are between 86 and 89 dBA. A                 10:00 am to 2:00 pm (from the opening hours of the com-
third set of measurements were performed by a person who                mercial activities until closing time) in this way the possible
attended the Movida wears a noise dosimeter. The noise                  contribution to the noise of the Movida was assessed of an-
dosimeter is a particular sound level meter dedicated to                thropogenic sound sources typical of the area in question.
measuring and evaluating exposure to noise in the work-                 Figure 7 shows the map of the sound level distribution in
place. Noise dosimeter measure and store sound pressure                 dBA along the affected stretch of road as a function of the
levels (in dBA) over time and provide a cumulative reading              measurement time [29–31]. The sound levels in the time slot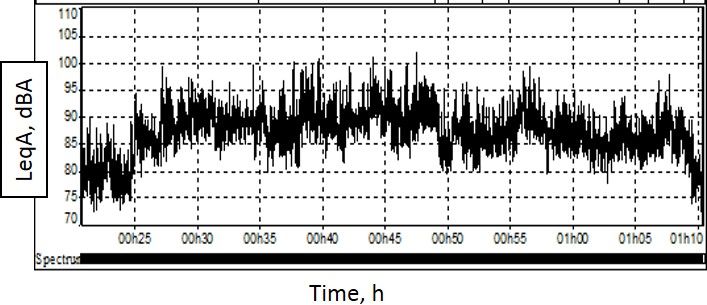
Effects of nightlife noise in a city center | 233

Figure 8: Some phases of Movida with the presence of numerous young people along the roads of interest

Figure 9: Map of the distribution of the sound level in dBA along the affected stretch of road as a function of the measurement time

between 10:00 am and 11:00 am are in the order of 65 dBA                in Table 3. Figure 8 shows some phases of Movida with the
and then increase during the morning due to the increase                presence of numerous young people along the roads of in-
in vehicular traffic and the loading and unloading of goods.            terest. While Figure 9 shows map of the distribution of the
Since the area is purely commercial, the noise is due to ve-            sound level in dBA along the affected stretch of road as a
hicular traffic, and in any case does not exceed the values of          function of the measurement time.
80 dBA during the unloading of goods due to the presence                     From 9:00 pm to 11:00 pm the road is closed, and the
of heavy means of transport. The acoustic measurements                  traffic leads to a reduction in noise levels in the traffic area,
performed with the dosimeter can be summarized as shown                 but the Movida phenomenon has not yet started. The sound
in Table 2.                                                             levels at the beginning and end of the stretch of road are
     A second set of measurements was performed from                    always in the order of 65 dBA. While in the central area there
9:00 pm to 01:00 am. During this time slot the area is closed           is a slight increase due to the start of commercial activities
to vehicular traffic, but the typical Movida activities begin           related to the distribution of food and drinks. From 11:00 pm
with the emission of music and the presence of numerous                 to midnight there is a significant increase in sound levels
customers along the road. The acoustic measurements per-                in the central area with an increase of 90 dBA. In the time
formed with the dosimeter can be summarized as shown                    slot 0000 am – 1:00 am the area affected by the increase in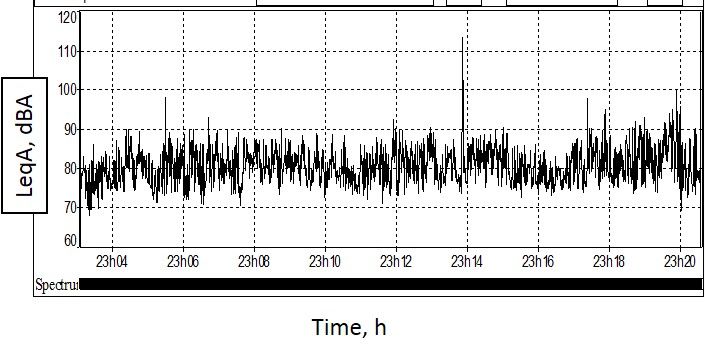
234 | G. Iannace et al.

levels of about 90 dBA only expands the entrance areas of         Conflict of interest: The authors state no conflict of inter-
the Movida area, the levels drop to 75 dBA. In the central        est.
area for about 2 hours the measured sound levels are about
90 dBA.

                                                                  References
Table 3: Summary of noise dosimeter measurements in the daytime
period
                                                                  [1]    Eldridge A. The Urban renaissance and the Nighttime economy:
                                                                         who belongs in the city at night. Social Sustainability in Urban Ar-
      Hours           Maximum sound         Minimum sound                eas. Communities, Connectivity and the Urban Fabric; 2010:183–
                       pressure level,      pressure level,              98.
                            dBA                  dBA              [2]    Mallo JL. Modas musicales y condiciones sociales. Cuadernos
                                                                         de Juventud. Madrid: Consejería de Educación y Juventud. Comu-
    9:00 pm –              70.0                  65.0
                                                                         nidad de Madrid; 1986.
    10:00 pm                                                      [3]    Quaggio G. La cultura en transición: reconciliación y política
   10:00 pm –               70.0                  65.0                   cultural en España, 1976-1986. Madrid: Alianza; 2014.
    11:00 pm                                                      [4]    Costa J. Cómo acabar con la Contracultura: Una historia subter-
   11:00 pm –               90.0                  70.0                   ránea de España. Barcelona: Taurus; 2018.
    00:00 am                                                      [5]    Federazione Italiana Pubblici Esercizi (FIPE). Le Opportunità della
                                                                         Movida. Andare oltre la deriva circense di centri e luoghi storici
   00:00 am –               90.0                  75.0
                                                                         delle città italiane. Rapporto Finale. Indagine Fipe – Censis; 2013.
     1:00 am                                                      [6]    Ottoz E, Rizzi L, Nastasi F. Recreational Noise in Turin and Milan:
                                                                         Impact and Costs of for Disturbed Residents, In Proc. of the 22nd
                                                                         International Congress on Sound and Vibration, 2015, 12-16 July,
                                                                         Florence, Italy.
                                                                  [7]    Ottoz, E., Rizzi, L., Nastasi, F., Recreational noise: Impact and
                                                                         costs for annoyed residents in Milan and Turin Applied Acoustics,
5 Conclusion                                                             2018, 133, 173–181.
                                                                  [8]    Asensio C, Gasco L, De Arcas G, López JM, Alonso J. Assessment
                                                                         of Residents’ Exposure to Leisure Noise in Málaga (Spain). Envi-
The sound levels measured within the city center in South-               ronments. 2018;5(12):134.
ern Italy, due to the Movida phenomenon, reach values             [9]    https://www.ecodibergamo.it/stories/Cronaca/movida-troppo
of the order of 90 dBA for an interval of about two hours.               -rumorosail-giudice-condanna-il-comune_1257826_11/
These levels are due to the music played through speakers         [10]   Passchier-Vermeer W, Passchier WF. Noise exposure and public
and the shouting of the patrons. From an acoustic point of               health. Environ Health Perspect. 2000 Mar;108(1 Suppl 1):123–
                                                                         31.
view, this condition generates conditions of disturbance
                                                                  [11]   Babisch W. The noise/stress concept, risk assessment and re-
to sleep and tranquility on the part of the residents, with              search needs. Noise Health. 2002;4(16):1–11.
consequent conflicts between club managers, customers             [12]   Cerniglia A, Bisceglie A, Zambon G. Advanced monitoring and
and residents. Therefore, it would be advisable to adopt                 analysis on recreational noise in urban area, In Proc. of the INTER-
suitable ordinances for the limitation of the noise emitted              NOISE 2016 – 45th International Congress and Exposition on
                                                                         Noise Control Engineering 2016.
by the sound amplification systems and to avoid that the
                                                                  [13]   Italian Republic Law 26 October 1995, n. 447, on noise pollution.
patrons stay after the closure of the premises in the adjacent    [14]   Farrés JC. Barcelona noise monitoring network. In Proc. of the
areas. The sale of alcoholic beverages beyond a certain time             10th European Congress and Exposition on Noise Control Engi-
should be prohibited. The solutions should be shared with                neering, Euronoise 2015.
the managers of the premises and residents and advertised         [15]   Da Vilva R, Mietlicki F, Sineau M. Noise generated by late-night
in a simple and effective way with the help of information               establishments: a new monitoring and management tool. In Proc.
                                                                         of the INTER-NOISE and NOISE-CON Congress and Conference,
campaigns on social network.
                                                                         2013, 247(4), 4193-4202.
                                                                  [16]   Gallo E, Ciarlo E, Santa M, Sposato E, Fogola J, Grasso D, et
Funding information: The authors state no funding in-                    al. Analysis of leisure noise levels and assessment of policies
volved.                                                                  impact in San Salvario district, Torino (Italy), by low-cost IoT
                                                                         noise monitoring network. In Proc. of the 11th European Congress
                                                                         and Exposition on Noise Control Engineering, Euronoise 2018,
Author contributions: All authors have accepted responsi-
                                                                         Crete 27 -31 May 2018.
bility for the entire content of this manuscript and approved     [17]   Gallo E., Ciarlo E., Santa M., Sposato E., Vincent B., Halbwachs
its submission.                                                          Y., Analysis of leisure noise levels and assessment of policies
                                                                         impact in San Salvario district, Torino (Italy), by low-cost IoT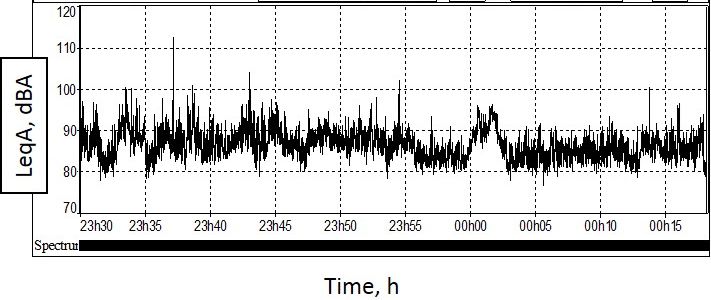
Effects of nightlife noise in a city center | 235

       noise monitoring network, In Proc. of Euronoise, 2018, 27-31       [25] Iannace G, Trematerra A, Berardi U. Assessment of the noise pro-
       May, Crete, Greece.                                                     duced by wind farms with the acoustically analogous techniques
[18]   Fimiani F, Luzzi S. Monitoring and Reducing Noise Related to            without stopping the noise source. Wind Eng. 2019;43(2):201–9.
       Movida: Real Cases and Smart Solutions, In Proc. of the 22nd       [26] Lombardi I, Iannace G, Trematerra A. The acoustic of a courtyard
       International Congress on Sound and Vibration, 2015, 12-16 July,        INTER-NOISE 2018 - 47th International Congress and Exposition
       Florence, Italy.                                                        on Noise Control Engineering: Impact of Noise Control Engineer-
[19]   Piuri MG, Ferrari S, Gravelloni M, Pavesi D, Barone MR, Zerbo           ing, 2018
       S, et al. The Movida in Milan: A Year of Noise Monitoring Noise    [27] Serra MR, Biassoni EC, Skarp AH, Serra M, Joekes S. Sound im-
       monitoring”, In Proc. of AIA-DAGA, 2013, 18-21 March, Merano.           mission during leisure activities and auditory behaviour. Appl
[20]   Ballesteros MJ, Fernández MD, Flindell I, Torija AJ, Ballesteros        Acoust. 2007;68(4):403–20.
       JA. Estimating leisure noise in Spanish cities. Appl Acoust.       [28] Butterfield D. Research Report RR517–Measurement of Noise
       2014;86:17–24.                                                          Levels that Staff are Exposed to at Live Music Events; Health and
[21]   World Health Organization. Environmental Noise Guidelines for           Safety Executive: London, UK, 2006
       the European Region. Copenhagen, Denmark: World Health Or-         [29] Ciaburro G. Sound event detection in underground parking
       ganization Europe; 2018.ISBN: 9789289053563.                            garage using convolutional neural network. Big Data and Cogni-
[22]   https://www.comune.aversa.ce.it/la-citta/turismo-cultura/gui            tive Computing. 2020;4(3):20.
       da-turistica-edita-dal-comune/                                     [30] Puyana-Romero V, Ciaburro G, Brambilla G, Garzón C, Maffei L.
[23]   Ciaburro G, Iannace G. Improving smart cities safety using sound        Representation of the soundscape quality in urban areas through
       events detection based on deep neural network algorithms. In-           colours. Noise Mapp. 2019;6(1):8–21.
       formatics (MDPI). 2020;7(3):23.                                    [31] Puyana-Romero V, Maffei L, Brambilla G, Ciaburro G. Modelling
[24]   Ciaburro G, Iannace G, Trematerra A. Research for the presence          the soundscape quality of urban waterfronts by artificial neural
       of unmanned aerial vehicle inside closed environments with              networks. Appl Acoust. 2016;111:121–8.
       acoustic measurements. Buildings. 2020;10(5):96.
You can also read