EFFECTS OF AL CONTENT ON THE CORROSION BEHAVIORS OF LOW CR BEARING STEELS IN NACL SOLUTIONS
←
→
Page content transcription
If your browser does not render page correctly, please read the page content below
Int. J. Electrochem. Sci., 16 (2021) Article ID: 21064, doi: 10.20964/2021.06.19

                                                                          International Journal of
                                                                          ELECTROCHEMICAL
                                                                                  SCIENCE
                                                                                 www.electrochemsci.org

Effects of Al Content on the Corrosion Behaviors of Low Cr
Bearing Steels in NaCl Solutions
Shuai Wang1,2, Qingyou Liu1, Bo Lv3, Liping Xu4,*
1
  Key Laboratory of High-temperature and High-pressure Study of the Earth’s Interior, Institute of
Geochemistry, Chinese Academy of Sciences, Guiyang 550081, China
2
  University of Chinese Academy of Sciences, Beijing, 100049, China
3
  Yanshan University, School of Environmental and Chemical Engineering, Qinhuangdao, 066004,
China
4
  Zhejiang Pharmaceutical College, Ningbo 315100, China
*
 E-mail: xuliping98@163.com

Received: 28 December 2020 / Accepted: 5 March 2021 / Published: 30 April 2021

The effects of Al content on the corrosion behaviors of aluminum-bearing steels were studied in NaCl
solutions. Electrochemical measurements and Raman and scanning electron microscopy (SEM) surface
analyses revealed that the aluminum-bearing steel formed two passivation films: the outer layer film
contained Al2O3 and Cr2O3, and the inner layer film contained lepidocrocite (γ-FeOOH), regardless of
whether the NaCl solution was faintly acidic/alkali or neutral. Lepidocrocite is unstable and can
transform to α-Fe2O3 and γ-Fe2O3 when exposed to air. The electrochemical impedance spectroscopy
(EIS) results showed that the dominant anticorrosion effect comes from the inner layer film, but a larger
Al content causes a larger charge transform resistance and larger outer and inner passive resistances,
which result in better anticorrosion properties. Furthermore, corrosion weight gain tests revealed that the
A1 content (Al%) and corrosion rate (V) exhibit a negative linear relationship V = -1.3667Al % (wt.%)
+1.9691 in the investigated conditions.

Keywords: Bearing steel; Al; Corrosion weight gain; Polarization curve; EIS; Raman spectra.

1. INTRODUCTION

        Bearing steels are widely used in the aviation, spaceflight and project equipment fields [1]. With
the rapid growth of modern science and technology and the wide application of bearing steels, society
has put forward new requirements and higher expectations for the performances of bearing steels. For
example, in the spacecraft and deep-sea exploration fields, bearing steels must exhibit reliable
temperature resistant, antimagnetic and anticorrosion performances, and some metal elements must be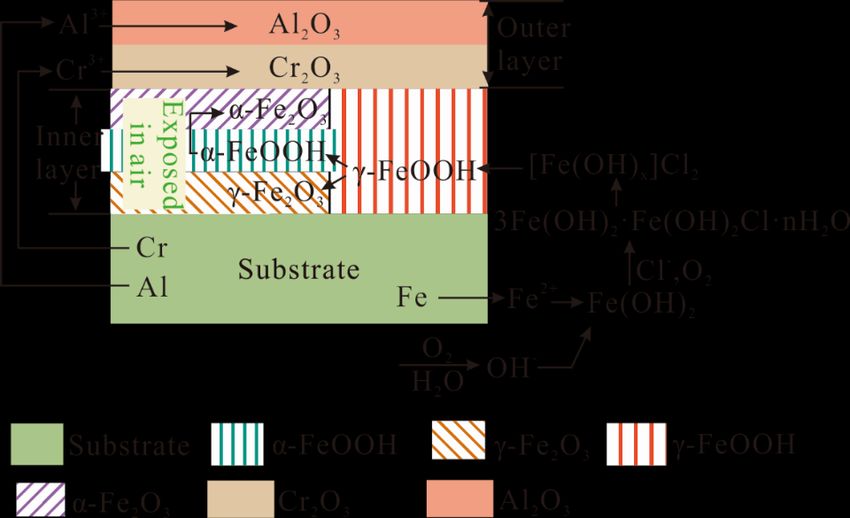
Int. J. Electrochem. Sci., 16 (2021) Article ID: 21064                                                       2

added to bearing steels (such as Cr and Cu) to fill some defects in the original bearing steel, which
improves or changes some properties to meet the actual needs of the material [2-4]. Yamashita et al. [5]
investigated the structures of protective rust layers, which formed on weathering steels by long-term
exposure in industrial atmospheres in Japan and North America. They noted that the innermost Cr-
substituted goethite layer may be the final modus of the protective rust layer, which can inhibit the
penetration of corrosive substances through the rust layer, thereby slowing down further corrosion. In a
CO2 solution system, bearing steel with added Cr not only had a smaller general corrosion rate but also
had smaller local corrosion [6]. By adding Cr and Al, Tsai et al. [7] achieved Ti-Cr-bearing hot-rolled
dual-phase steel with a superior combination of mechanical properties. Due to the considerable
strengthening obtained from interphase-precipitated nanometer-sized carbides in ferrite, this dual-phase
steel has a yield ratio of approximately 0.72, which is much higher than those of conventional dual-phase
steels. Copper is also often added to steel. Wang et al. [8] studied Cu-bearing stainless steel scaffolds
with two different structures (body centered cubic and gyroid labyrinth) at two solid fractions (25% and
40%). The results revealed that Cu has the potential to lessen implant-associated infections. Compared
to the 316L scaffold, the addition of Cu to the bearing stainless steel did not significantly affect the
strength and stiffness; these results coupled with the addition of antimicrobial Cu may supply a new
orientation for medical stainless steels.
        Al is a good deoxidizing agent in the aluminum-bearing steel industry that has a good anti-fatigue
property. Twenty years ago, people added Al to bearing steel and produced fine grain sizes and thus
reduced the hardenability of steel [9]. Since then, many studies have been carried out to probe the effects
of different aluminum contents on the fatigue properties, deformation and precipitation behavior, and
mechanical properties of bearing steel. Yang et al. [10] investigated the effects of aluminum content on
fatigue properties and the corresponding crack initiation and propagation behavior of bearing steel in a
very high cycle fatigue regime. The results showed that in the highly clean GCr15 bearing steel, high Al
content tends to form a collection area of Al2O3 particles; therefore, bearing steel with high Al content
has poor fatigue properties due to the large size of the crack initiation region. In contrast, bearing steel
with low Al content possesses relatively better fatigue properties because single complicated oxides
mainly containing Al2O3 are smaller. Wang et al. [11] investigated the effects of deformation amount,
deformation temperature and subsequent holding time on the deformation spheroidizing process of high-
carbon-bearing steel containing aluminum. The experiment display that the spheroidization period can
be shortened by the deformation spheroidizing treat. High deformation temperatures and deformation
amounts cause the coarsening of carbides. However, at a lower deformation temperature, the amount of
deformation will slightly affect the diameter and roundness of the carbide. When the aluminum content
is less than 0.75%, the addition of aluminum inhibits the growth of carbides and ameliorates their
roundness. Yang et al. [12] studied the influence of Al alloy on the hot deformation behavior of bearing
steel. The results indicate that the addition of Al significantly increases the flow stress of steel due to the
strong strengthening effect of Al on the austenite phase, and accelerates the strain softening rates due to
the effect of the increasing stacking fault energy, which indicates that Al alloying reduces the high-
temperature plasticity and the positive effect of Al on bearing steel. To define the role of aluminum in
the precipitation behaviors and mechanical properties of Cu-Ni-bearing low alloy steels, Liu et al. [13]
studied their microstructures and precipitation behaviors via electron microscopy combined with
Int. J. Electrochem. Sci., 16 (2021) Article ID: 21064 3
thermodynamic analyses. Aluminum had a great effect on the precipitation behavior of niobium, wherein
the precipitation temperature of Nb(C, N) was decreased and the prior austenite grain size was controlled
by the Al and Nb precipitation. In addition, aluminum effectively increased the precipitate density by
increasing the ordered-B2 Ni(Al, Mn) nucleation rate and copper precipitation.
Another important parameter to evaluate the performance of aluminum-bearing steel is its
anticorrosion character. Miki [14] studied the corrosion behaviors of aluminum-bearing steels in strongly
concentrated nitric acid solutions. The results displayed that the addition of aluminum to stainless steel
resulted in the inhibition of corrosion for stainless steels in the liquid phase, but no inhibition effect was
observed in the vapor phase. Nishimura [15] compared the corrosion electrochemical behaviors of Si-
and Al-bearing steel and carbon steel. The results revealed that, compared with the carbon steel, the Si-
and Al-bearing steel exhibited outstanding corrosion resistance in the exposure test. The causes were
that Si and Al mainly existed in nanoscale iron composite oxides in the internal rust formed by the steel,
which makes the steel containing Si and Al have higher rust resistance and corrosion resistance reactivity
compared to those of carbon steel. In summary, previous studies on aluminum-bearing steel corrosion
behaviors were relatively lacking. Hence, in this work, different contents of aluminum were added to
bearing steels, and then the corrosion behaviors of aluminum-bearing steel specimens were studied via
electrochemical techniques and surface analyses for the following reasons: (1) investigate the
electrochemical mechanism of aluminum-bearing steel in different pH NaCl solutions and (2) understand
the effects of aluminum content on aluminum-bearing steel corrosion behaviors and provide
experimental proof for the corrosion assessment of Al-bearing steel in environments with different
acidities/basicities (pH 5.0-9.0).
2. EXPERIMENT
2.1 Aluminum-bearing steel production and electrode preparation
Three GCr15SiAlMo bainitic bearing steel specimens were used in this study. These three
specimens were made from GCr15SiMo steel, and their smelting process was double vacuum smelting
(vacuum induction + vacuum consumption) [12], which provide a lower purity oxygen and higher purity
and lower oxide inclusions, which increase the material contact fatigue life [16]. The three aluminum-
bearing steel specimens were labeled as 100D, 100E and 100F, and the elemental analyses for these
samples are shown in Table 1.
Table 1. EDS elemental analysis of the Aluminium-bearing steel samples (Wt.%)
Bearing steel number C Mn Si Cr Mo Al P S
100D 0.998 0.260 0.740 1.540 0.330 0.430 0.004 0.002
100E 1.020 0.230 0.700 1.510 0.340 0.750 0.005 0.002
100F 0.993 0.240 0.830 1.540 0.350 0.970 0.004 0.002Int. J. Electrochem. Sci., 16 (2021) Article ID: 21064 4
The steel specimens were cut into cuboid shapes (1.0 × 1.0 × 0.3 cm) to ensure their bottom
surfaces, the working area, was 1.0 cm2. Then, connect the specimen to the copper wire by using silver
paint on the upper surface, and then the specimens were sealed with epoxy resin to ensure that only the
working surface was exposed to the solution.
2.2 Corrosion weight gain test
In this work, the corrosion weight gain method was adopted [17]. The three GCr15SiAlMo
bearing steels specimens were cut into cuboid samples with 1.0 × 1.0 × 0.3 cm dimensions, and each
kind of steel specimen, 100D, 100E and 100F, had 3 pieces. Prior to the hanging piece corrosion gain
test, the steel specimens were polished with a sequence of 1.0, 0.3, and 0.05 μm alumina powder to
obtain a fresh surface, and then the specimens were degreased using alcohol, rinsed with deionized water
and dried in a stream of air. The exact dimensions of the 9 steel specimens were measured with Vernier
calipers and their exact weights before (W0) and after (W1) corrosion were recorded with an electronic
balance. Then, the 9 steel specimens were soaked in 9 bottles containing 3.5% (wt. %) NaCl solution
that adopted the hanging piece method; after 20 days of corrosion, the specimens were removed and
weighed. The obtained data were employed to calculate the corrosion rate V (mm/a) according to Eq.
(1), which indicates either a decrease or increase in the thickness of a metal surface due to corrosion
within one year.
W1 W0
V =8.76 104 (1)
STD
Where W1 is the weight of the steel specimen after corrosion (g); W0 is the initial weight of the
steel specimen (g); S is the surface area that was soaked in the NaCl solution (cm2); T is the corrosion
time (h) and D is the density of the steel specimen (g/cm3).
2.3 Electrochemical measurements
Electrochemical measurements were performed with an electrochemical measurement system
(PARSTAT 2273, Princeton Applied Research) controlled by a personal computer. In this work, a
traditional three-electrode electrolytic cell system was used, in which platinum was used as the auxiliary
electrode, bearing steel was used as the working electrode, and the reference electrode was a saturated
calomel electrode (SCE). Unless otherwise stated, the standard hydrogen electrode (SHE) was cited for
all other potentials. The reference electrode was connected to a Luggin capillary, so that the solution
resistance between the working electrode and the reference electrode can be minimized. HCl and NaOH
solutions were used to adjust the pH of the 3.5% (wt. %) NaCl electrolyte solutions to 5.0, 7.0 and 9.0.
Analytical grade reagents were used in the experimental investigation.
The polarization curves started a potential from -600 mV and ended at +600 (vs. open current
potential, OCP). During the measurement, the scan rate was 1.0 mV·s-1. The EIS tests were obtained at
open current potential in the frequency range of 1 mHZ-10 KHz with amplitude of 10 mV. Then, usingInt. J. Electrochem. Sci., 16 (2021) Article ID: 21064 5
the ZSimpWin 3.20 (2004) software to fit the impedance data. The experiments were conducted at 25 ±
1°C.
2.4 Scanning electron microscopy (SEM) and Raman spectral analysis
Three 10 mm × 10 mm × 3 mm steel samples were used for the surface analyses. Three steel
samples were immersed in a 36.28 g/L NaCl solution. After 15 days of corrosion, SEM (SU5000, Hitachi
of Japan) was used to observe the corrosion morphologies of the specimens, and Raman spectral analyses
(British Renishaw) were used to analyze the surface characteristics of the specimens at a wavelength of
514 nm during the test. The collection time was 10 s.
3. RESULTS AND DISCUSSION
3.1 Corrosion weight gain test study
Table 2. Corrosion weight gain test results of the Aluminium-bearing steel samples
Sample Size (mm*mm*mm) W0 (g) W1 (g) Corrosion rate (mm/a) Average corrosion rate (mm/a)
100D-1 10.18*9.32*2.41 1.8852 2.0850 1.5586 1.3887
100D-2 10.28*9.32*2.41 1.9038 2.0953 1.4816
100D-3 10.28*9.32*2.52 1.9906 2.1383 1.1258
100E-1 9.44*9.20*2.38 1.9267 2.0209 0.7940 0.9261
100E-2 9.75*9.62*2.55 1.9660 2.0992 1.0289
100E-3 9.62*9.59*2.55 1.9481 2.0701 0.9553
100F-1 9.58*9.26*2.55 1.8782 1.9724 0.7555 0.6540
100F-2 9.42*9.24*2.54 1.8500 1.9146 0.5270
100F-3 9.62*9.71*2.80 2.1678 2.2592 0.6795
Table 2 shows the corrosion weight gain results of the three aluminum-bearing steel specimens.
From the table, we can see that the aluminum-bearing steel corrosion rates were 1.3887, 0.9261 and
0.540 mm/a when the Al contents were 0.430, 0.750 and 0.970 (wt. %), respectively. The results showed
that as the Al content increased, the aluminum-bearing steel corrosion rate decreased. This is consistent
with the results of previous researches that aluminum has a significant role in reducing the corrosion rate
of alloy steel in seawater [18]. Furthermore, Figure 1 shows the relationships of the A1 content (wt. %)
and corrosion rate of the steel specimens in the 36.28 g/L NaCl solution, which revealed that the A1
content (wt. %) and corrosion rate exhibit a negative linear relationship: V = -1.3667Al % (wt. %)
+1.9691.Int. J. Electrochem. Sci., 16 (2021) Article ID: 21064 6
1.5
Experimental
1.4 Simulated
1.3
1.2 y=-1.3667x+1.9691
Corrosion Rate (mm/a)
2
R =0.9965
1.1
1.0
0.9
0.8
0.7
0.6
0.4 0.5 0.6 0.7 0.8 0.9 1.0
Al (wt%)
Figure 1. The relationship of A1 (wt%) and corrosion rate of steel specimens in 35.0 mg/L NaCl
solution.
-1 -1
pH 5.0 (a) pH 7.0 (b)
100D 100D
100E 100E
-2 100F 100F
-2
Logi (A/cm )
2
-3 -3
Logi (A/cm )
2
-4 -4
-5 -5
-6 -6
-1.2 -0.8 -0.4 0.0 0.4 -1.2 -0.8 -0.4 0.0 0.4
Potential (V vs. SHE) Potential (V vs. SHE)
-1
pH 9.0 (c)
100D
100E
-2
100F
-3
Logi (A/cm )
2
-4
-5
-6
-7
-1.2 -0.8 -0.4 0.0 0.4
Potential (V vs. SHE)
Figure 2. Polarization curves (a-c) and the relationship of Al (wt%) and icorr (d) of steel specimens in
NaCl solutions at different pHs.Int. J. Electrochem. Sci., 16 (2021) Article ID: 21064 7
3.2 Polarization curves study
Figure 2 displays the polarization curves of the three aluminum-bearing steel electrodes in NaCl
solutions with different acidities/basicities. The polarization curves of the anodes exhibit a similar
polarization profile, which suggests the same anodic electrochemical interaction mechanism of
aluminum-bearing steel. With increasing anodic potential, all the corrosion current densities had two
potential areas; at these two potential intervals, their corrosion current densities increased very little as
the potential increased, which suggests that two passive film(s) formed on the electrode surface and
hindered the steel dissolution rate.
The detailed polarization kinetics and thermodynamic parameters of corrosion current density
(icorr) and corrosion potential (Ecorr) were dependent on Tafel extrapolation [19] and are listed in Table
3. When the NaCl electrolyte contains the same pH of 5.0, 7.0 or 9.0, specimens 100D, 100E and100F
had a larger concentration of Al (wt. %), which caused smaller corrosion current densities. In the NaCl
solution with a pH of 5.0, when the Al content (wt. %) increased from 0.430 to 0.750, the corrosion (icorr)
of the steel electrode decreased from 3.251×10⁻⁴ to 3.229×10⁻⁴ µA·cm-2 and then to 3.188×10⁻⁴ A·cm-2
when the Al (wt. %) was further increased to 0.970. The results showed that increasing the concentration
of Al inhibited steel corrosion, which agrees with Wang’ et al point of view [20]. He believes that the
addition of alloying elements, Cr and Al, inhibits the occurrence of corrosion reaction, thus reducing the
icorr. The relationships of Al content (wt. %) and icorr for the three steel specimens in the NaCl solutions
with different pH values are shown in Table 3, which also confirmed that the A1 content (wt. %) and the
corrosion rate exhibit a negative linear relationship: icorr= -0.1132Al %+3.3038 (pH 5.0), icorr= -0.3721Al
%+2.1843 (pH 7.0) and icorr= -1.4828Al %+2.627 (pH 9.0). All these results corresponded with the
corrosion weight gain experiment results.
The inhibition efficiencies (η) can be calculated based on the following equation:
(icorr - icorr
0 0
) / icorr i0 i
[21], where corr and corr are the initial and the subsequent corrosion current
densities, respectively. Figure 3 shows the inhibition efficiency ƞAl of aluminum-bearing steel at different
concentrations of Al (wt. %). In the NaCl solutions with the same acidities/basicities, larger Al contents
had better inhibition efficiencies. When the NaCl solution was acidic (pH 5.0), increases in the Al content
(wt. %) from 0.430 to 0.750 or to 0.970 only caused a slight increase in the inhibition efficiency, whereas
for the basic NaCl solution, a slight increase in Al (wt. %) caused a great inhibition efficiency: when the
concentration of Al (wt. %) increased from 0.430 to 0.750, the inhibition efficiency increased to 25.87,
and reached 39.71 when the Al concentration (wt. %) was 0.97.
Corrosion potential (Ecorr) is a considerable parameter to assess the electrochemical corrosion
behavior of materials. Generally speaking, the more positive corrosion potential of material, the better
corrosion resistance. As Table 3 shows, at an identical pH value, increasing the content of Al (wt. %)
resulted in the corrosion potential shifting to a more positive value; for the same steel specimen, the
larger pH value creates a positive corrosion potential. All these data suggest that the aluminum-bearing
steel had better corrosion resistance at larger Al contents (wt. %) or when the pH value of the NaCl
solution was larger, and these results correspond with those of the corrosion current densities.Int. J. Electrochem. Sci., 16 (2021) Article ID: 21064 8
Table 3. Polarization parameters of the samples in NaCl solution
Sample pH 5.0 pH 7.0 pH 9.0
icorr (A/cm2) Ecorr (mV) ηAl (%) icorr (A/cm2) Ecorr (mV) ηAl (%) icorr (A/cm2) Ecorr (mV) ηAl (%)
100D 3.251×10⁻⁴ -443.4 - 2.011×10⁻⁴ -440.9 - 2.002×10⁻⁴ -437.8 -
100E 3.229×10⁻⁴ -441.8 0.68 1.938×10⁻⁴ -435.5 3.63 1.484×10⁻⁴ -433.6 25.87
100F 3.188×10⁻⁴ -439.4 1.94 1.804×10⁻⁴ -433.9 10.29 1.207×10⁻⁴ -428.7 39.71
Al(wt%) 0.430 0.750 39.71
40
Al(wt%) 0.430 0.970
30
25.87
Al (%)
20
10.29
10
1.94 3.63
0.68
0
pH 5.0 pH 7.0 pH 9.0
Figure 3. The inhibition efficiencies of aluminium-bearing steel at different concentration of Al.
400 500
(a) pH 5.0 (b) pH 7.0
100F
100F
-Z"(Ω)
-Z"(Ω)
200 100E 250
100E
100D 100D
0 0
0 200 400 600 800 0 250 500 750 1000
Z'(Ω) Z'(Ω)
500
(c) pH 9.0
100F
-Z"(Ω)
250
100E
100D
0
0 250 500 750 1000
Z'(Ω)
Figure 4. Nyquist impedance spectra (a-c) and equivalent circuit (d) for the steel specimens in NaCl
solution at different pHs.
3.3 Electrochemical impedance spectroscopy study
Figure 4 present the Nyquist plots for the steel specimens in NaCl solutions with different pH
values. The Nyquist plots were composed of three capacitive loops, regardless of the pH of the NaCl
solution or the concentration of Al (wt. %). The loop at high frequencies is attributed to the protective
outer Al and Cr oxide layer. The second capacitive loop at moderate frequencies is related to the passive
properties of the inner iron oxide and hydroxyl oxidize iron layer. The detailed characteristics of theInt. J. Electrochem. Sci., 16 (2021) Article ID: 21064 9
passive films were confirmed via SEM and Raman spectral analyses. The loop at low frequencies is
related to the double layer between the aluminum-bearing steel and the outer Helmholtz plane. The
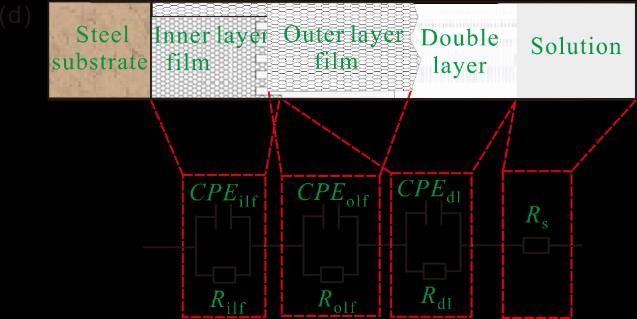
electrochemical equivalent circuit (EEC) shown in Figure 4 (d) was used to model the steel/electrolyte
interface, which is often used for two passive films, or adsorption and/or insertion processes [22, 23]. In
this Figure 4 (d), Rs is the ohmic resistance of the solution, Rdl is the charge transfer resistance of ions
through the double layer, Rolf and Rilf are the passive film resistances of the outer and inner surface film,
respectively. CPEdl, CPEolf and CPEilf are the constant phase elements, which are used to replace the
charge transfer capacitance at the double layer and the passive film capacitance of the outer layer and
the inner layer, respectively. Table 4 shows the impedance parameters and fitting results gained by fitting
the EIS data to the EEC.
Comparing the steel electrochemical parameters at different contents of Al (wt. %), we can find
out that whether the electrolyte was acidic (pH 5.0), neutral (pH 7.0) or alkali (pH 9.0), when the content
of Al (wt. %) increased, the values of Rilf, Rolf and Rdl were all increased. The larger charge transforms
resistance (Rdl) meant that ions have more difficulty transforming at the double layer, and the larger outer
and inner layer passive film resistances implied a tighter passive film. All these results are consistence
with the polarization results, which found that, for different steel specimens, the specimen that had a
larger Al content (wt. %) would have better anticorrosion characteristics in a NaCl solution of the same
pH. The results of the experiment are similar to the previous studies. Wang et al. [20] deems that when
the Al content of steel was increased, the polarization resistance from EIS also increase. Nishimura [15]
found that the corrosion resistance of Al-bearing steel was much higher than carbon steel by EIS method.
In addition, for these specimens, the Rilf value was always much larger than the Rolf value at the same
NaCl solution, which indicates that the inner layer films were the main passive factor.
Table 4. Model parameters for equivalent circuit of Figure 4 (d)
NaCl Sample CPEilf Cilf (F·cm- Rilf CPEolf Colf (F·cm- Rolf CPEdl Cdl Rdl X2
solution number -
2) (Ω·cm2) -
2) (Ω·cm2) - (F·cm-2) (Ω·cm2)
Y0(S·cm n Y0(S·cm n Y0(S·cm n
2·s-n) 2·s-n) 2·s-n)
pH 5.0 100D 3.312E-3 0.6442 2.317E-3 158.1 5.958E-8 1.0000 5.958E-8 4.06 9.656E-3 0.6995 1.141E-2 152.6 1.53E-4
100E 2.640E-3 0.6805 2.108E-3 234.6 3.185E-8 1.0000 3.185E-8 5.95 6.052E-3 0.7081 8.423E-3 368.4 4.64E-4
100F 2.157E-3 0.7294 2.012E-3 384.4 2.748E-6 0.5714 7.253E-10 6.17 5.031E-3 0.6857 8.181E-3 574.2 1.84E-4
pH 7.0 100D 1.832E-3 0.7537 1.358E-3 218.2 3.617E-2 0.7447 3.168E-2 18.8 1.888E-2 0.6974 3.952E-2 290.7 4.78E-4
100E 1.382E-3 0.7843 1.141E-3 360.8 1.870E-3 0.7551 6.704E-4 22.6 1.373E-2 0.7056 2.658E-2 354.9 3.64E-4
100F 1.230E-3 0.7994 1.101E-3 522.2 1.620E-3 0.8066 7.724E-4 28.1 1.079E-2 0.7325 1.865E-2 415.0 6.13E-4
pH 9.0 100D 1.617E-3 0.7513 1.162E-3 228.0 1.084E-2 0.6901 6.096E-3 25.6 1.693E-3 0.7638 1.538E-3 432.7 2.76E-4
100E 1.344E-3 0.7822 1.137E-3 408.6 1.975E-3 0.7846 1.165E-3 74.0 1.374E-3 0.7662 1.198E-3 464.2 1.96E-4
100F 9.651E-4 0.7984 9.921E-4 1156 1.724E-3 0.8120 1.099E-3 82.9 1.299E-3 0.7701 1.144E-3 503.6 3.57E-4
When the steel specimen (100D, 100E or 100F) was immersed in different NaCl solutions with
different pH values. As the NaCl solution pH increased from 5.0 to 9.0, the outer and inner passivation
film resistances of the samples Rolf and Rilf were all increased, and their respective capacitances were all
decreased, which suggests that the passivation films had stronger protective effects against steel
specimen dissolution. Especially for the 100F specimen, the increased resistance and decreased
capacitance changed more remarkably than those of the other specimens. All these results revealed thatInt. J. Electrochem. Sci., 16 (2021) Article ID: 21064 10
increasing the pH is advantageous for aluminum-bearing steel anticorrosion behaviors, especially for
specimens with larger Al concentrations. The conclusions were in accordance with those of the
polarization results.
(a) (b) (c)
200μm
(d) (e) (f)
(g) (h) (i)
Figure 5. SEM images were magnified 1000 times for steel samples exposure to NaCl solution. (a:
100D, pH5.0; b: 100D, pH7.0; c: 100D, pH9.0; d: 100E, pH5.0; e: 100E, pH7.0; f: 100E, pH9.0;
g: 100F, pH5.0; h: 100F, pH7.0; i: 100F, pH9.0)
3.4 SEM and Raman spectral analyses
Figure 5 shows the SEM images of the corroded 100D, 100E and 100F surfaces after immersion
in NaCl solutions with different pH values for 15 days. It is clear from the images that all the steel
samples have experienced severe corrosion. Particularly, at the same NaCl solution (pH 5.0, 7.0, or 9.0),
in sequential order from 100D to 100E to 100F, had smaller corroded surfaces and smaller corrosion
holes, which indicates that the steel sample that has a smaller Al content (wt. %) had more severe
corrosion. In the same steel sample, 100D, 100E or 100F, when the NaCl solution pH values increased,
the steel sample had a smaller corroded surface and smaller corrosion, which means that higher alkalinity
inhibited the sample corrosion. These results corresponded with the electrochemical results, which found
that a larger content of Al (wt. %) or larger value of pH inhibited aluminum-bearing steel corrosion. TheInt. J. Electrochem. Sci., 16 (2021) Article ID: 21064 11
EDS spectra of the three aluminum-bearing steel specimens in the NaCl solutions with pH values of 7.0
are listed in Table 5. The results revealed that oxygen participated in the interaction and that its content
in the three specimens decreased in turn (wt. % 100D < 100E < 100F); compared with the pristine
aluminum-bearing steel, the content of Al, especially Cr (wt. %) obviously increased. All these data
confirmed that aluminum-bearing steel anticorrosion effects increased with increasing Al content.
Figures S1-S4 show the X-ray mapping of O, Al, Cr and Mn after the aluminum-bearing steel
samples were corroded in the NaCl solution for 15 days. With decreasing Al content (wt. %) of the
aluminum-bearing steel or decreasing pH value of the NaCl solution, we observed a deficiency of Al
and Cr, and the accumulations of O and Fe were more obvious. The Al and Cr concentrations in the
oxide film of pitting corrosion were lower than the surroundings for Al and Cr diffused into the solution
by ions, whereas the O and Fe concentrations in the oxide film of pitting corrosion were higher than the
surroundings for the O and Fe precipitated oxidation reactions at the surface.
Figure 6 shows the Raman spectra of the steel samples after corrosion in NaCl solution for 15
days. After the steel samples were corroded for 15 days, before ultrasonic washing (Figure 6 (a)), the
Raman spectra of the 100D, 100E and 100F samples in NaCl solutions with different pH values exhibited
five Raman peaks near 250, 378, 524, 650-650 and 1307 cm-1. The Raman peak at 378 cm-1 was the
feature of a structure for the Al2O3 substances [24]. The Raman peak at 524 cm-1 was assigned to the
species of chromium oxide Cr2O3 [25]. The Raman peaks at 250 cm-1 [26-28], 650-660 cm-1 [27, 29, 30]
and 1307 cm-1 [29, 30] were assigned to the species of γ-FeOOH.
After ultrasonication, the peaks at 378 cm-1 and 524 cm-1 disappeared in the spectra of the steel
samples (Figure 6 (b)), which indicates that Al2O3 and Cr2O3 were all cleared. Three new peaks rose at
219, 282 and 395 cm-1 and 524 cm-1 and in some samples, the peak at 1307 cm-1 shifted to 1320 cm-1.
The Raman peaks at 219 and 282 cm-1 were assigned to the species of iron oxide α-Fe2O3 [31], and the
Raman peaks at 395 and 1320 cm-1 were attributed to the species of γ- Fe2O3 [26]. The results revealed
that the corrosion products Al2O3 and Cr2O3 should be covered as outer films and hence can easily be
cleared, which is consistent with the potentiodynamic curves and EIS measures results.
Table 5. EDS elemental analysis (wt%) of steel samples after 20 days exposure in NaCl
Element 100D 100E 100F
O 15.04 9.89 7.48
Al 0.10 0.58 1.13
Cr 2.33 4.76 6.73
Fe 81.44 80.64 78.30
Mn 0.34 0.59 1.02
Si 0.75 0.30 0.13
C - 3.22 3.32
Mo - - 0.31Int. J. Electrochem. Sci., 16 (2021) Article ID: 21064 12
(a) ■ ■- γ-FeOOH ▼- Al2O3 (b) ◆ - α-Fe2O3 ◆ - γ-Fe2O3
●- Cr2O3
◆
◆
■ ■- γ-FeOOH
◆
■
■ ■
Intensity (ab. units)
Intensity (ab. units)
100D pH 5.0
▼ ● ■
100D pH 5.0
◆
100D pH 7.0
100D pH 7.0 100D pH 9.0
100D pH 9.0 100E pH 5.0
100E pH 5.0 100E pH 7.0
100E pH 7.0 100E pH 9.0
100E pH 9.0
100F pH 5.0
100F pH 5.0
100F pH 7.0 100F pH 7.0
100F pH 9.0 100F pH 9.0
100 400 700 1000 1300 1600 1900 100 400 700 1000 1300 1600 1900
-1 -1
Raman shift (cm ) Raman shift (cm )
Figure 6. Raman spectra of the steel samples after corrosion in NaCl solution for 20 days (a: before
ultrasonic washing; b: after ultrasonic washing).
3.5 Oxidation mechanism of steel (containing Al) in NaCl solution
By summarizing the results from in situ electrochemical analyses and surface measurements, a
reasonable corrosion mechanistic pathway for aluminum-bearing steel was suggested as follows. During
the aluminum-bearing steel self-corrosion progress, the metal elements, Cr, Al and Fe, acted as anodes
and were oxidized.
Cr → Cr3++ 3e- (2)
Al → Al + 3e
3+ -
(3)
Fe → Fe2+ + 2e- (4)
Oxygen acted as an oxidizing agent, and the reduction reaction took place as a cathodic reaction
[32].
O2 + 2H2O + 4e- → 4OH- (5)
Furthermore, the dissolution of chromium is thought to take place as reaction (6) [33], the
dissolution of aluminum is expected to occur as reaction (7) [15], and Fe2+ will also transform into iron
oxygen (such as Fe2O3):
2Cr3+ + 3H2O + 3e- → Cr2O3 (6)
2Al3+ + 3H2O + 3e- → Al2O3 (7)
According to the thermodynamic data [34, 35], the heat of formation values of Al2O3, Cr2O3 and
Fe2O3 at 25°C are -1669.8, -1058.58 and -824.60 kJ mol-1, respectively. Hence, Al and Cr preferentially
oxidize before Fe, and their oxides act as outer films, which correspond with the above Raman results.
Fe2+ will also transform in the Al and Cr outer film, which is not completely isolated from oxygen and
water molecules, and Fe2+ can further interact and lead to the formation of a thin unstable colloidal
hydroxyl salt layer called GreenRust (GR), 3Fe(OH)2·Fe(OH)2Cl·nH2O, from the action of the oxygen
and chloride effect [36-38].
Fe2+ + 2OH- → Fe(OH)2 (8)
7Fe(OH)2 + Fe + 2Cl +1/2O2 + (2n+1)H2O → 2[3Fe(OH)2·Fe(OH)2Cl·nH2O] (chloride green
2+ -
rust) (9)Int. J. Electrochem. Sci., 16 (2021) Article ID: 21064 13
Generally, the GreenRust [Fe(H2O)x]Cl2 is not stable and undergoes further transformation to γ-
FeOOH (lepidocrocite) via the pathway (10) [33, 39, 40] and even to γ-Fe2O3 and α-Fe2O3 via pathways
(11) and (12). The above transformation from γ-Fe2O3 to α-Fe2O3 is impossible under thermodynamic
criteria, FeOOH is more thermodynamically stable than γ-Fe2O3. In addition, α-Fe2O3 cannot be formed
under in situ conditions [40]. However, when exposed to a dry atmosphere, the formation of α-Fe2O3 is
earthly via a dehydration reaction, and the reaction proceeds through α-FeOOH or γ-Fe2O3 [40-42]. The
ex situ Raman analysis confirmed the formation of α-Fe2O3.
3Fe(OH)2·Fe(OH)2Cl·nH2O → [Fe(H2O)x]Cl2 → γ-FeOOH, FeOCl + H2O → γ-FeOOH (10)
8γ-FeOOH → 4γ-Fe2O3 + 4H2O → α-Fe2O3 + 4H2O (11)
2γ-FeOOH → 2α-FeOOH → α-Fe2O3 + H2O (12)
According to the above analysis, the corrosion mechanism of aluminum-bearing steel in NaCl
solution is shown in Figure 7.
Figure 7. The oxidation mechanism of aluminium-bearing steel in NaCl solution.
4. CONCLUSIONS
The effects of the Al content on the corrosion behaviors of aluminum-bearing steels in NaCl
solutions were researched by electrochemical measurements and surface analyses. The following
conclusions can be drawn:
(1) There is a negative linear relationship between the A1 content (Al%) and corrosion rate (V), which
is expressed as V = -1.3667Al % (wt.%) + 1.9691 in the investigated conditions (Al content between
0.430 and 0.970).
(2) The polarization curve studies indicated that aluminum-bearing steel corrosion had two passive
potential intervals. Increasing the concentration of Al or increasing the pH of the NaCl solutionsInt. J. Electrochem. Sci., 16 (2021) Article ID: 21064 14
causes the corrosion potential to become more positive and is advantageous for aluminum-bearing
steel anticorrosion behaviors.
(3) The EIS studies showed that the dominant anticorrosion effect comes from the inner layer film, but
a larger content of Al causes a larger charge transform resistance and larger outer and inner passive
resistances, which results in better anticorrosion behaviors.
(4) The SEM and Raman spectral analyses confirmed that the outer layer film was composed of Al2O3
and Cr2O3, and the inner layer film was composed of lepidocrocite (γ-FeOOH) regardless of whether
the NaCl solution was faintly acidic/alkali or neutral. γ-FeOOH is unstable and can transform to α-
Fe2O3 and γ-Fe2O3 when exposed to air.
SUPPLEMENTARY INFORMATION
(a) (b) (c)
5 μm
(d) (e) (f)
(g) (h) (i)
Figure S1. EDS Analysis of Element Al in Steel Samples Exposed to NaCl Solution.
(a: 100D, pH5.0; b: 100D, pH7.0; c: 100D, pH9.0; d: 100E, pH5.0; e: 100E, pH7.0; f: 100E, pH9.0; g:
100F, pH5.0; h: 100F, pH7.0; i: 100F, pH9.0)Int. J. Electrochem. Sci., 16 (2021) Article ID: 21064 15
(a) (b) (c)
5 μm
(d) (e) (f)
(g) (h) (i)
Figure S2. EDS Analysis of Element Fe in Steel Samples Exposed to NaCl Solution.
(a: 100D, pH5.0; b: 100D, pH7.0; c: 100D, pH9.0; d: 100E, pH5.0; e: 100E, pH7.0; f: 100E, pH9.0; g:
100F, pH5.0; h: 100F, pH7.0; i: 100F, pH9.0)Int. J. Electrochem. Sci., 16 (2021) Article ID: 21064 16
(a) (b) (c)
5 μm
(d) (e) (f)
(g) (h) (i)
Figure S3. EDS Analysis of Element Cr in Steel Samples Exposed to NaCl Solution.
(a: 100D, pH5.0; b: 100D, pH7.0; c: 100D, pH9.0; d: 100E, pH5.0; e: 100E, pH7.0; f: 100E, pH9.0; g:
100F, pH5.0; h: 100F, pH7.0; i: 100F, pH9.0)Int. J. Electrochem. Sci., 16 (2021) Article ID: 21064 17
(a) (b) (c)
5 μm
(d) (e) (f)
(g) (h) (i)
Figure S4. EDS Analysis of Element O in Steel Samples Exposed to NaCl Solution.
(a: 100D, pH5.0; b: 100D, pH7.0; c: 100D, pH9.0; d: 100E, pH5.0; e: 100E, pH7.0; f: 100E, pH9.0; g:
100F, pH5.0; h: 100F, pH7.0; i: 100F, pH9.0)
ACKNOWLEDGMENTS
This work was financially supported by the “135” Program of the Institute of Geochemistry, Chinese
Academy of Sciences (CAS).
References
1. H. Bhadeshia, Mater. Sci. Technol., 32 (2016) 1059.
2. V. I. Chukwuike, S. S. Sankar, S. Kundu and R. C. Barik, Corros. Sci., 158 (2019) 108101.
3. F. Wang, F. Zhang, L. Zheng and H. Zhang, Appl. Surf. Sci., 423 (2017) 695.
4. P. Rodriguez-Calvillo, E. Leunis, T. Van De Putte, S. Jacobs, O. Zacek and W. Saikaly, AIP Adv., 8
(2018) 047605.
5. M. Yamashita, H. Nagano, T. Misawa and H. E. Townsend, ISIJ Int., 38 (1998) 285.
6. G. Zhao, C. Chen and M. Lu, Materials Protection, 35 (2002) 15.
7. S. P. Tsai, T. C. Su, J. R. Yang, C. Y. Chen, Y. T. Wang and C. Y. Huang, Mater. Des., 119 (2017)
319.
8. Q. Wang, L. Ren, X. Li, S. Zhang, T. B. Sercombe and K. Yang, Mater. Sci. Eng., C 68 (2016) 519.
9. Anticipating the hardening response of aluminium-bearing plain-carbon steels. Contract Heat
Treatment Association, Steel Times, 223 (1995) 192.Int. J. Electrochem. Sci., 16 (2021) Article ID: 21064 18
10. C. Yang, Y. Luan, D. Li and Y. Li, Int. J. Fatigue, 116 (2018) 396.
11. M. Wang, J. Shan, C. Zheng, M. Zhang, Z. Yang and F. Zhang. Mater. Sci. Technol., 34 (2018) 161.
12. Z. N. Yang, L. Q. Dai, C. H. Chu, F. C. Zhang, L. W. Wang and A. P. Xiao, J. Mater. Eng. Perform.,
26 (2017) 5954.
13. S. Liu, H. Tan, H. Guo, C. Shang and R. D. K. Misra, Mater. Sci. Eng., A 676 (2016) 510.
14. M. Miki, Corrosion Engineering, 32 (1983) 701.
15. T. Nishimura, Corros. Sci., 52 (2010) 3609.
16. M. H. Stadler and T. V. Ciukaj, JOM, 17 (1965) 533.
17. W. Zhang, R. Tang, Z. B. Yang, C. H. Liu, H. Chang, J. J. Yang, J. L. Liao, Y. Y. Yang and N. Liu,
Surf. Coat. Technol., 347 (2018) 13.
18. R. E. Melchers, Corros. Sci., 46 (2004) 1669.
19. A. J. Bard, L. R. Faulkner, Electrochemical methods: fundamentals and applications, 2nd.
Hoboken: Wiley and Sons. 2001.
20. R. Wang, S. Luo, M. Liu and Y. Xue, Corros. Sci., 85 (2014) 270.
21. R. Solmaz, G. Kardas, B. Yazici and M. Erbil, Colloids Surf., A 312 (2008) 7.
22. V. A. Alves and C. M. A. Brett, Electrochim. Acta, 47 (2002) 2081.
23. M. Ates, N. Uludag and A. S. Sarac, Fibers Polym., 12 (2011) 8.
24. A. Misra, H. D. Bist, M. S. Navati, R. K. Thareja and J. Narayan, Mater. Sci. Eng., B, 79 (2001) 49.
25. O. Monnereau, L. Tortet, C. E. A Grigorescu, D. Savastru, C. R. Iordanescu, F. Guinneton, R.
Notonier, A. Tonetto, T. Zhang, I. N. Mihailescu, D. Stanoi and H. J. Trodahl, J. Optoelectron. Adv.
Mater., 12 (2010) 1752.
26. T. Ohtsuka, K. Kubo and N. Sato, Corrosion-us, 42 (1986) 476.
27. D. Thierry, D. Persson. C. Leygraf, N. Bouchcrit and A. Hugot-Le Goff, Corros. Sci., 32 (1991)
273.
28. R. J. Thibeau, C. W. Brown and R. H. Heidersbach, Appl. Spectrosc., 32 (1978) 532.
29. G. Nauer, P. Strecha, N. Brinda-Konopik and G. Lipstay, J. Therm. Anal. Calorim., 30 (1985) 813.
30. J. Dunnwald and A. Otto, Corros. Sci., 29 (1989) 1167.
31. D. L. A. de Faria, S. V. Silva and M. T. de Oliveira, J. Raman Spectrosc., 28 (1997) 873.
32. M. G. Fontana, Corrosion Engineering, 3rd ed., McGraw-Hill Book Company, Singapore, 1987.
33. S. Ramya, D. N. G. Krishna and U. K. Mudali, Appl. Surf. Sci., 428 (2018) 1106.
34. R. C. Weast, Handbook of Chemistry and Physics, 65th ed., CRC Press, Boca Raton, FL, 1984.
35. W. J. Moore, Basic Physical Chemistry, Prentice-Hall, New Jersey, 1982.
36. S. Simard, M. Odziemkowski, D. E. Irish, L. Brossard and H. Ménard, J. Appl. Electrochem., 31
(2001) 913.
37. N. Boucherit and A. Hugot-Le Goff, Faraday Discuss., 94 (1992) 137.
38. P. Refait and J. M. R. Genin, Corros. Sci., 34 (1993) 797.
39. N. Boucherit, A. Hugot-Le Goff and S. Joiret, Corrosion-us, 48 (1992) 569.
40. X. Zhang, K. Xiao, C. Dong, J. Wu, X. Li and Y. Huang, Eng. Fail. Anal., 18 (2011) 1981.
41. H. Zhang, X. Li, C. Du, H. Qi and Y. Huang, J. Raman Spectrosc., 40 (2009) 656.
42. X. Nie, X. Li, C. Du, Y. Huang and H. Du, J. Raman Spectrosc., 40 (2009) 76.
© 2021 The Authors. Published by ESG (www.electrochemsci.org). This article is an open access
article distributed under the terms and conditions of the Creative Commons Attribution license
(http://creativecommons.org/licenses/by/4.0/).You can also read