Education Investment Areas - selection methodology - February 2022 - GOV.UK
←
→
Page content transcription
If your browser does not render page correctly, please read the page content below
Education Investment
Areas – selection
methodology

February 2022
Contents
Introduction and non-technical summary 3

Defining areas with low outcomes at key stage 2 and key stage 4 4

 Outline of approach 4

 Data sources 4

 Accounting for local government changes 6

 Calculating three-year average scores for each local authority 8

 Composite measure of KS2 and KS4 performance 9

Alignment with existing policy interventions 10

 Defining areas currently targeted with existing policy interventions 11

Final selection approach 12

Annex A – Local authorities selected as EIAs 13

 Map of Education Investment Areas 14

Annex B – Composite attainment score methodology diagram 15

Annex C – Local authority district boundary changes 16

Annex D – Local authorities containing previous place-based policies 17

 2
Introduction and non-technical summary
HM Government has announced it will further drive school improvement in England by
delivering a package of measures in new Education Investment Areas (EIAs). These
areas cover the third of local authorities in England where educational outcomes are
currently weakest and other local authorities containing existing place-based
interventions.

The selection methodology is based on pupil outcomes at local authority level.
Specifically, the approach selects areas where outcomes at the end of both key stage 2
(KS2) and key stage 4 (KS4) are lowest in order to target school improvement
interventions in the parts of the country where performance at primary and secondary
school is furthest behind. For KS2 performance, the selection methodology uses the
proportion of pupils reaching the expected standard in all of reading, writing and maths in
national curriculum assessments, while average Progress 8 score is the metric used for
KS4 performance.

Pupil outcomes in any given local authority can change from year to year. To ensure that
EIAs are focussed in areas with sustained low performance over time, the selection
approach uses average performance data from the most recent three years of complete
data (2017–2019) to select the parts of the country where outcomes have been
consistently poorest in recent years. 1

In order to ensure that the department’s approach to levelling up is consistent with
existing policies to improve outcomes in specific places, any local authority which
contains an existing Opportunity Area or one of the four specific areas previously
identified as having the highest potential for rapid improvement is also selected as an
EIA. 2

The final list of the 55 local authorities that have been selected as EIAs is presented in
Annex A alongside a map showing their geographical coverage.

The rest of this document outlines the technical details for the selection methodology
used for EIAs, including the full calculations used to define areas with low outcomes at
KS2 and KS4. All the data used to select EIAs are included in the accompanying
statistical data tables to this paper.

1 See page 4 for more details on the data sources and time periods used for EIA selection
2 See page 10 for details on the alignment with EIAs and existing policy interventions
 3
Defining areas with low outcomes at key stage 2 and
key stage 4
Outline of approach
To target school improvement interventions at the areas of the country where pupil
outcomes are lowest, the selection methodology for EIAs is based on sustained low
performance across both school phases, KS2 and KS4.

This approach collates several data sources to generate a composite measure of
attainment across the three most recent years of data (2017, 2018 and 2019) for the
proportion of pupils achieving the expected standard in reading, writing and maths at
KS2, and average Progress 8 scores at KS4.

Each years’ data, from each phase, is ‘standardised’ to ensure that the selection
approach weights relative performance across all years equally. 3 These standardised
scores are then averaged across years to give an overall three-year standardised KS2
and KS4 score for each local authority. Finally, the KS2 and KS4 three-year standardised
scores are themselves averaged to arrive at a single composite outcomes measure for
each local authority – equally weighting KS2 and KS4, and each year’s data.

Because of disruption to exams and assessments from the coronavirus (COVID-19)
pandemic, the selection approach uses historic data from 2017 to 2019. However,
changes to the structure of local government between 2017 and 2021 mean that the
department’s published data from 2017 to 2019 does not correspond perfectly with
current local authority (LA) boundaries in 2021, which are used to select EIAs. However,
local authority districts (LADs) which existed from 2017 to 2019 do align with 2021 LA
boundaries. Therefore, the overall outcome scores for the KS2 and KS4 measures,
mapped to current LAs, are derived from the scores of pupils in schools geographically
located in the 2017–2019 LADs of which the 2021 LAs now consist. 4

The following section outlines each step of this methodology in more detail which
corresponds to the methodology diagram in Annex B.

Data sources
This analysis uses the most recent three years of attainment data from 2017 to 2019, to
ensure that EIAs target areas of sustained underperformance and are not unduly affected
by year-on-year volatility in LA-level attainment. Data from 2017 to 2019 is used because

3 See page 7 for details of how the data has been standardised to compute a three-year average.
4 See page 6 for a detailed explanation of how boundary changes have been accounted for, and a worked
example on the local government reorganisation in Northamptonshire. The Isles of Scilly and City of
London are not included in this analysis and are deemed out of scope due to the very low number of pupils
in those areas.
 4
KS2 attainment data has not been collected since 2019 due to the coronavirus (COVID-
19) pandemic, making this the latest complete year of attainment data for KS2 and KS4.

Selection is based on educational performance of pupils in state-funded schools at both
KS2 and KS4, as EIAs are intended to drive improvement in both primary and secondary
schools. The outcomes of pupils at both phases in each LA are therefore relevant.

As outlined in detail in the next section, the analysis uses published LAD-level outcomes
data, and maps this to 2021 LAD boundaries. The relative performance of each LAD in
the published data (and therefore each LA) is based on the outcomes of pupils attending
schools which are geographically located within the boundaries of that area. 5

KS2 outcomes
The proportion of pupils reaching the expected standard in all of reading, writing and
maths in national curriculum assessments is the KS2 attainment measure used in this
analysis. Data for each year is taken from the following sources:

 • National curriculum assessments: key stage 2, 2019 (revised) – Underlying data –
 Table: ks2_2019_revised_lad_ud

 • Key stage 2 and multi-academy trust performance, 2018 (revised) – Key stage 2
 underlying data – Table: 2018_KS2_SCHLOC_CHAR_UD_2

 • National curriculum assessments: key stage 2, 2017 (revised) – Underlying data:
 SFR69/2017 – Table: SFR69_2017_KS2_SCHLOC_CHAR_UD_2

The proportion of pupils reaching the expected standard in reading, writing and maths is
used as it one of the headline school accountability measures at KS2 and captures
achievement across three broad subjects at primary school.

KS4 outcomes
Progress 8 is the KS4 measure used in this analysis. Progress 8 aims to capture the
progress pupils make from the end of primary school to the end of secondary school. It is
a type of value-added measure, which means that pupils’ results are compared to the
actual achievements of other pupils with similar prior attainment. Data for each year is
taken from the following sources:

 • Key stage 4 performance 2019 (revised) – Table:
 2019_KS4_Revised_Pupil_Residency_and_school_location_data (KS4 LAD_SL)

 • Key stage 4 and multi-academy trust performance 2018 (revised) – Key stage 4
 underlying data – Table: 2018_LAD_UD_DISADVANTAGE

5For full details of which pupils are included in this measure, see the methodology for each year of
attainment data (KS4 2019, KS4 2018, KS4 2017; KS2 2019, KS2 2018, KS2 2017)
 5
• Revised GCSE and equivalent results in England: 2016 to 2017 – Underlying local
 authority district data – Table: 2017_LAD_UD_DISADVANTAGE

Progress 8 describes the performance of pupils at secondary school after accounting for
prior attainment at KS2. Because Progress 8 only measures improvement made after
KS2, it is an appropriate measure to combine with performance up until KS2 (in this case,
the proportion of children achieving the expected standard in reading, writing and maths),
to holistically measure outcomes in an area and ensure performance at primary school
and secondary school are equally weighted in the final composite measure. 6

Accounting for local government changes
Data on outcomes for the years 2017–2019 are not published in terms of 2021 local
authority boundaries, and it is not possible to map historic LA-level data to current
boundaries given that some LA boundaries have changed since 2019. Instead, this
analysis calculates outcomes between 2017 and 2019 for each LA based on the
published attainment data for the underlying local authority districts (LADs), which existed
between 2017 and 2019, and now map geographically to the current LA’s boundaries. In
the vast majority of cases, the LA and LAD boundaries have not changed, but this step is
necessary to ensure every current LA receives an overall composite score for KS2 and
KS4 outcomes. The box on page 7, below, outlines one example where this
transformation has been necessary.

Published LAD outcomes data for each year from 2017 to 2019 is mapped to 2021 LAD
boundaries using the lookup in Annex C. This is possible because no LADs have split
during that period. Where two or more LADs have been merged, their total Progress 8
score and total number of eligible pupils are summed to create the relevant values for the
new LAD. The same summation is done for the number of pupils reaching the expected
standard in reading, writing and maths, and the number of pupils eligible.

This data for 2021 LADs is then aggregated to 2021 LAs. 7 Where an LA comprises
multiple LADs, the same process of summation of total attainment and eligible pupils is
applied as for LAD merges. From this data, overall headline KS2 and KS4 outcome
metrics can then be calculated at 2021 LA-level. Average Progress 8 in an LA is
calculated by dividing total Progress 8 by the number of eligible pupils for the measure.
The proportion of pupils reaching the expected standard in reading, writing and maths in
an LA is calculated by dividing the total number of pupils meeting the expected standard
by the total number of eligible pupils for the measure.

To create a final dataset for analysis, this calculation is repeated for every 2021 LA which
contains at least two state-funded schools. 8 As the programmes in EIAs will apply to

6 For more information on primary and secondary school performance measures, see DfE’s guidance
7 Using ONS (2021) – Lower Tier Local Authority to Upper Tier Local Authority (April 2021) Lookup
8 Data on number of state-funded schools as at 1st September 2021, source: Get Information About

Schools
 6
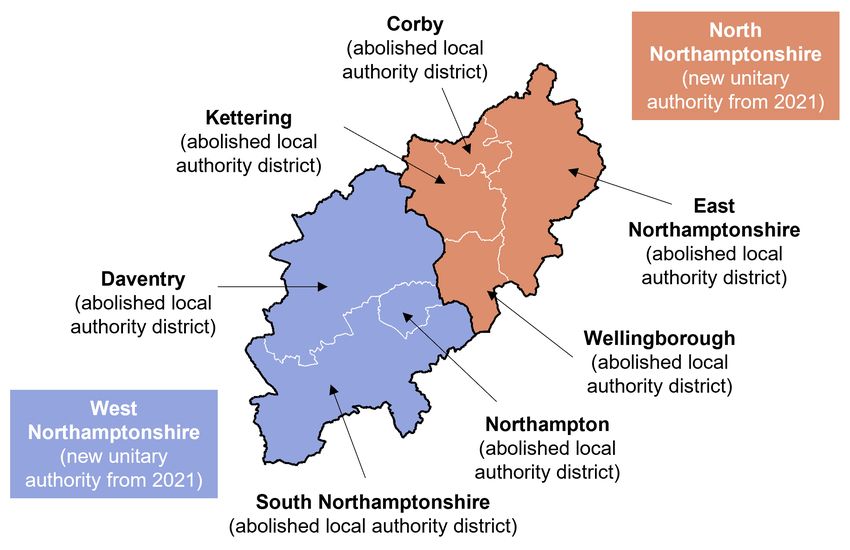
schools with teacher supply challenges and, subject to consultation, schools with
successive requires improvement Ofsted judgments; it is important to focus on LAs with
high levels of need and a sufficient number of pupils and schools in scope.

 Example: Northamptonshire local government reform
 From 1 April 2021, Northamptonshire County Council (an upper tier local authority) was
 split into two unitary authorities, North Northamptonshire and West Northamptonshire.
 Consequently, all data previously published by the department at local authority level
 from 2017 to 2019 is reported for the previous LA of Northamptonshire, rather than the
 two new LAs, North Northamptonshire and West Northamptonshire.

 However, the now-abolished LADs that existed within Northamptonshire from the
 period 2017 to 2019 correspond to the new LA boundaries exactly. The North
 Northamptonshire unitary authority covers the abolished LADs of Corby, East
 Northamptonshire, Kettering and Wellingborough while the West Northamptonshire
 unitary authority covers the abolished LADs of Daventry, Northampton and South
 Northamptonshire. This is shown in the map in below.

 Consequently, data from 2017 to 2019 at LAD level can be aggregated to generate
 scores for the performance of schools within the existing LA boundaries of North
 Northamptonshire and West Northamptonshire.

 7
Calculating three-year average scores for each local authority
After LAD level data from 2017 to 2019 is mapped to 2021 LA level, the next step in the
selection methodology is to take averages across the three years of data.

However, it is not appropriate to simply take the average of Progress 8 scores over the
three years of data, as it is designed as a relative ‘within-year’ measurement. As a result,
combining the raw Progress 8 measure across three years would be of limited use and
would not have a clear interpretation. Further, the distribution of scores at LA-level for
both the KS2 and KS4 are not identical over the three years. To address this, the
selection methodology focusses on the relative performance of each LA on each metric,
compared to other LAs in the same year. Applying statistical standardisation allows year-
on-year comparisons to be made about relative performance of LAs. Those which
consistently perform worse than other LAs across KS2 and KS4 are selected as EIAs.

Standardising scores
Every LA is assigned a standardised score for each year, and for both KS2 and KS4
measures, by subtracting the mean score of all LAs in that year from its own score that
year. This figure is then divided by the standard deviation of scores across all LAs in that
year.

Formally, for both metrics, at KS2 and KS4, the following transformation is applied to
generate a standardised score, , , for each local authority, , for each year :
 , − ,
 , =

where:

 • , represents the score for local authority in year on a given metric,

 • , represents the mean score of all LAs on the metric in year , and

 • represents the standard deviation of the metric across LAs in year .

This provides a measure of relative performance for each LA that can be compared
across years, while allowing for differences in the scale of variation between LAs in each
year. Overall, statistical standardisation ensures that relative performance in each year is
weighted equally in the final calculation.

Calculating a three-year average
For both the KS2 and KS4 metrics, standardised scores for each LA are then averaged,
by taking the mean across three years, to generate two further metrics for each local
authority:

 • Standardised KS2 three-year average score

 • Standardised KS4 three-year average score

 8
These scores show the KS2 and KS4 performance of each LA over the three years
relative to other LAs.

Composite measure of KS2 and KS4 performance
Finally, the two standardised three-year average scores (for KS2 and KS4) are combined
into a single measure of relative performance.

This composite measure is simply the mean of these two standardised scores, ensuring
that the overall selection criteria weights performance at the KS2 and KS4 equally.

 9
Alignment with existing policy interventions
In order to ensure that the department’s approach to levelling up is consistent with
existing policies to improve outcomes in specific places, any LA which contains an
existing Opportunity Area (OA) or is an area previously identified for additional school
improvement support is also automatically included as an EIA. 9

 Opportunity Areas
 The Opportunity Areas (OA) programme was announced in October 2016. This is a
 place-based initiative focused on improving educational attainment and social mobility.
 Originally targeted on six areas, it was expanded to include six more areas in January
 2017.

 More detail on Opportunity Areas, including the selection methodology and their original
 delivery plans, can be found on GOV.UK.

 Areas identified for additional school improvement support
 In May 2021, the government announced new locally targeted initiatives investing £10
 million to support four areas of the country: Plymouth, Ashfield & Mansfield, South
 Sefton & North Liverpool, and North Durham, City & Sedgefield.

 The investment will provide intensive support in four areas of the country to increase the
 proportion of pupils in Good or Outstanding schools.

Defining areas currently targeted with existing policy interventions
Education Investment Areas are targeted at local authority level, but neither Opportunity
Areas nor the areas previously identified in May 2021 for additional school improvement
support correspond perfectly to upper-tier local authority boundaries. Six of the
Opportunity Areas are local authority districts that sit within larger upper-tier local
authorities, while the areas previously identified for additional school improvement
support cover a range of geographical areas that do not always align with upper-tier local
authority boundaries.

For both Opportunity Areas and the areas previously identified for additional school
improvement support, any 2021 local authority which contains one of these place-based
interventions is flagged, and automatically included as an EIA. Annex D contains a list of
these upper-tier local authorities.

9 Opportunity North East (ONE) is due to end in August 2022 as planned, and ONE areas are not
automatically included as EIAs. Investment in the region will continue where it is most needed – six of the
twelve North East local authorities are Education Investment Areas (County Durham, Darlington,
Hartlepool, Middlesbrough, South Tyneside, and Sunderland).
 10
Final selection approach
The final list of EIAs reflects a combination of third of LAs with the lowest outcomes and
any other LAs containing an Opportunity Area or areas previously identified for additional
school improvement support.

Formally, this means areas selected as EIAs are the local authorities which are either:

 (i) in the bottom 50 ranked local authorities on the standardised KS2 and KS4
 composite measure (see page 4, above);

 or

 (ii) contain an Opportunity Area or areas previously identified for additional school
 improvement support (see Annex D). 10

The full list of local authorities selected as Education Investment Areas is presented in
Annex A.

10 Note: 9 out of the 12 LAs containing OAs and 3 out of the 5 LAs containing areas previously identified for

additional school improvement support are in the bottom 50 ranked LAs by standardised KS2 and KS4
composite attainment. Therefore, only 3 LAs containing OAs (Cambridgeshire, East Sussex and North
Yorkshire) and 2 LAs containing areas previously identified for additional school improvement support
(County Durham and Nottinghamshire) are selected only by virtue of containing those existing place-based
programmes.
 11
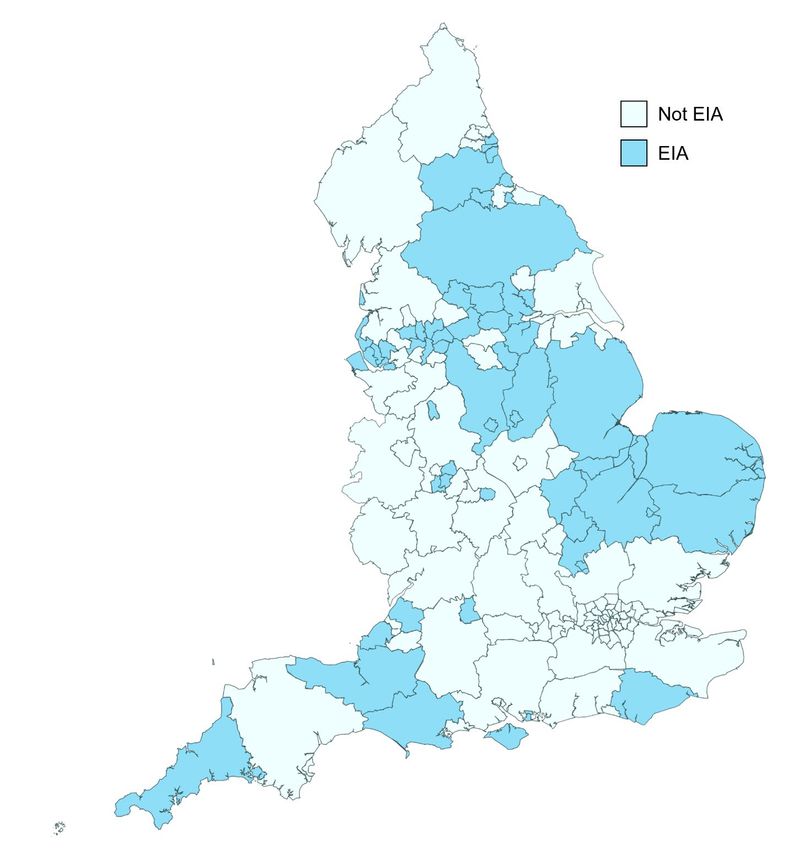
Annex A – Local authorities selected as EIAs
The following local authorities have been selected as EIAs. EIAs which contain existing
place-based initiatives are highlighted with the following colours and symbols:

 • Green* – LAs containing Opportunity Areas

 • Blue† – LAs containing areas previously identified for additional school
 improvement support in Plymouth, Ashfield & Mansfield, South Sefton & North
 Liverpool, and North Durham, City & Sedgefield

Bedford Isle of Wight Rochdale

Blackpool* Kirklees Rotherham

Bolton Knowsley Salford

Bradford* Leeds Sandwell

Bury Lincolnshire Sefton†

Cambridgeshire* Liverpool† Somerset*

Central Bedfordshire Luton South Gloucestershire

Cornwall Manchester South Tyneside

County Durham† Middlesbrough St. Helens

Coventry Norfolk* Stoke-on-Trent*

Darlington North Northamptonshire Suffolk*

Derby* North Somerset Sunderland

Derbyshire North Yorkshire* Swindon

Doncaster* Nottingham Tameside

Dorset Nottinghamshire† Wakefield

Dudley Oldham* Walsall

East Sussex* Peterborough Wirral

Halton Plymouth†

Hartlepool Portsmouth

Full data on all of the calculated measures at local authority level are presented in the
accompanying data tables for EIAs and local authorities not selected to be EIAs.

 12
Map of Education Investment Areas
The map below shows all Local Authorities in England, with those selected as Education
Investment Areas highlighted.

 13
Annex B – Composite attainment score methodology diagram
The following figure shows the steps in the methodology to generate a three-year average composite KS2 and KS4 attainment score.

 14
Annex C – Local authority district boundary changes
 The following table outlines the local government boundary changes that have been
 accounted for in the analysis

Year Old LAD New LAD Source

2019 Bournemouth Bournemouth, Christchurch Bournemouth, Dorset and Poole Order 2018
 and Poole

2019 Poole Bournemouth, Christchurch Bournemouth, Dorset and Poole Order 2018
 and Poole

2019 Christchurch Bournemouth, Christchurch Bournemouth, Dorset and Poole Order 2018
 and Poole

2019 East Dorset Dorset Bournemouth, Dorset and Poole Order 2018

2019 North Dorset Dorset Bournemouth, Dorset and Poole Order 2018
2019 Purbeck Dorset Bournemouth, Dorset and Poole Order 2018

2019 West Dorset Dorset Bournemouth, Dorset and Poole Order 2018

2019 Weymouth and Portland Dorset Bournemouth, Dorset and Poole Order 2018

2019 Taunton Deane Somerset West and Taunton Somerset West and Taunton Order 2018

2019 West Somerset Somerset West and Taunton Somerset West and Taunton Order 2018

2019 Suffolk Coastal East Suffolk East Suffolk Order 2018

2019 Waveney East Suffolk East Suffolk Order 2018

2019 Forest Heath West Suffolk West Suffolk Order 2018

2019 St Edmundsbury West Suffolk West Suffolk Order 2018

2020 Aylesbury Vale Buckinghamshire Buckinghamshire Order 2019

2020 Chiltern Buckinghamshire Buckinghamshire Order 2019

2020 South Bucks Buckinghamshire Buckinghamshire Order 2019

2020 Wycombe Buckinghamshire Buckinghamshire Order 2019

2021 Corby North Northamptonshire Northamptonshire Order 2020

2021 East Northamptonshire North Northamptonshire Northamptonshire Order 2020

2021 Kettering North Northamptonshire Northamptonshire Order 2020

2021 Wellingborough North Northamptonshire Northamptonshire Order 2020

2021 Daventry West Northamptonshire Northamptonshire Order 2020
2021 Northampton West Northamptonshire Northamptonshire Order 2020

2021 South Northamptonshire West Northamptonshire Northamptonshire Order 2020

 15
Annex D – Local authorities containing previous place-
based policies
The following tables show the local authorities that are automatically selected as EIAs
because of existing place-based support within the local authority boundaries.

Local authorities containing areas previously identified for additional school
improvement support
 Area receiving support Corresponding LAs
 Ashfield and Mansfield Nottinghamshire
 North Durham, City and Sedgefield County Durham
 Plymouth Plymouth
 South Sefton and North Liverpool Liverpool; Sefton

Local authorities containing Opportunity Areas
 Opportunity Area Corresponding LAs
 Blackpool Blackpool
 Bradford Bradford
 Derby Derby
 Doncaster Doncaster
 Fenland and East Cambridgeshire Cambridgeshire
 Hastings East Sussex
 Ipswich Suffolk
 North Yorkshire Coast North Yorkshire
 Norwich Norfolk
 Oldham Oldham
 Stoke-on-Trent Stoke-on-Trent
 West Somerset Somerset

 16
© Crown copyright 2022
This publication (not including logos) is licensed under the terms of the Open
Government Licence v3.0 except where otherwise stated. Where we have identified any
third party copyright information you will need to obtain permission from the copyright
holders concerned.

To view this licence:
 visit www.nationalarchives.gov.uk/doc/open-government-licence/version/3
 email psi@nationalarchives.gsi.gov.uk
 write to Information Policy Team, The National Archives, Kew, London, TW9 4DU

About this publication:
 enquiries john.rolfe@education.gov.uk
 jack.cornish@education.gov.uk
 download www.gov.uk/government/publications

 Follow us on Twitter: Like us on Facebook:
 @educationgovuk facebook.com/educationgovuk
You can also read