Economic Outlook and Investment Strategy - March 2021 - Pelley Group
←
→
Page content transcription
If your browser does not render page correctly, please read the page content below

March 2021

Economic Outlook and Investment Strategy

        Investment management services provided by City National Bank through its wholly-owned subsidiary City National Rochdale, LLC, a registered investment advisor.

                                                                                                                                                                          1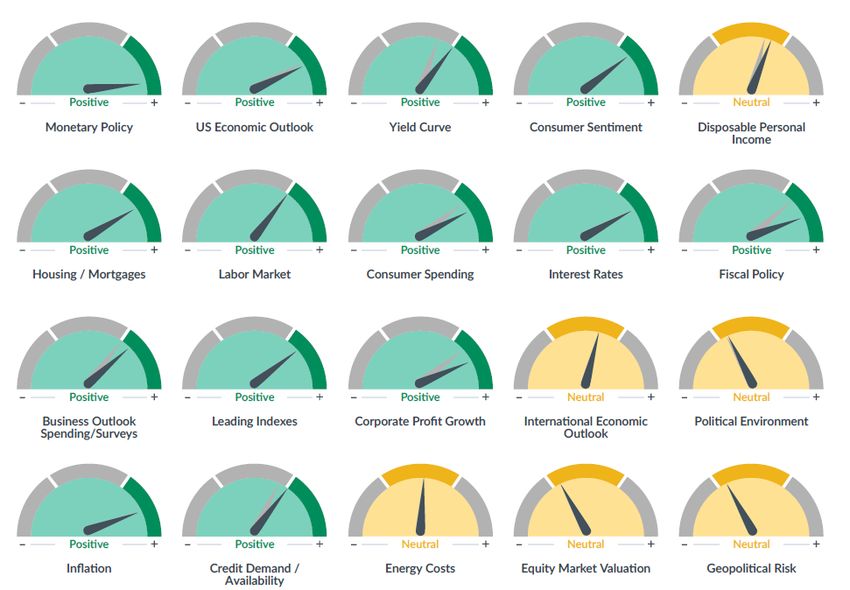
ECONOMIC & MARKET OUTLOOK
CNR Progress Playbook
Investment Committee considering:
Our confidence in the economic outlook has increased due to vaccine breakthroughs.
In spring, expecting increased confidence to drive economic activity and rebuild inventories.
Unemployment will decline throughout 2021, leading to positive income and spending trends.
Narrow Democrat congressional control creates the potential for larger stimulus, without large tax increases.
We have been increasing our exposure to growth investments, expecting a return to normalcy.
Earnings for the S&P 500 look set to be at a record level in 2021 and 2022.
Stock valuations high in many segments, but reasonable in high-dividend, select high-quality core equities.
Interest rates increase from very low levels, reflecting economic optimism, expectation of stimulus.
Inflation expectations have risen from very low levels but remain moderate.
Potential volatility from COVID-19 increases could be used as investment opportunity.
Equity returns in 2021 could be above average, but expect moderate longer-term returns.
Returns in investment grade fixed income could be challenged when interest rates rise.
Source: CNR Research.
2ECONOMIC & MARKET OUTLOOK
Looking Ahead to the End of the Pandemic
Vaccine process expected to speed up significantly, inoculating most of the U.S. by mid-May
Infections expected to continue to decline until near-zero levels reached in early summer
Sources of uncertainty: new virus strains, vaccine administration hurdles, manufacturing
Model: Projected New Infections vs. Immunity
300,000,000 700,000
70% of Population 600,000
250,000,000
500,000
200,000,000
Immunity through Vaccination
New Infections 400,000
150,000,000
300,000
100,000,000
200,000
Immunity through Infection
50,000,000
100,000
0 0
Source: Gu, Y. COVID-19 projections using machine learning. https://covid19-projections.com. Accessed 1/24/2021.
3ECONOMIC & MARKET OUTLOOK
Economic and Financial Indicators
Indicators Are Forward-Looking Six to Nine Months
Indicators are signaling
a more entrenched and
durable recovery from
the COVID-19 crisis
developing in the
second half of 2021 as
vaccine availability
becomes widespread.
Source: City National Rochdale. As of March 2021.
4ECONOMIC & MARKET OUTLOOK
Expecting Multi-year Expansion Ahead
Expect a sharper recovery to take hold in second half of 2021 as vaccine availability becomes widespread
COVID still weighing on activity, but momentum improving with dramatic decline in new cases
Larger than expected fiscal stimulus lifting growth prospects
Equity rally to continue, but expect higher volatility and pace of gains to moderate
Q2 Q3 Q4 Q1 2020 2021 2022
2020 2020 2020 2021
Potential GDP 5% 6.0% 4.5%
-31% 33% 4% -3.5%
Growth Range 3% 4.0% 2.5%
Percent Change From Preceding Period, Seasonally Adjusted at Annual Rates
City National Rochdale Forecasts 2019 2020e 2021e 2022e
GDP Growth 2.3% (3.5%) 4%-6% 2.5%-4.5%
Corporate Profit Growth 1% (15%) - (20%) 25%-30% 10%-20%
Interest Fed Funds Rate 1.625% 0%-0.25% 0%-0.25% 0%-0.25%
Rates Treasury Note, 10-Yr. 1.90% 0.92% 1.00%-1.50% 1.00%-1.50%
Source: Bureau of Economic Analysis, Standard & Poor’s, Bloomberg. As of March 2021.
5ECONOMIC & MARKET OUTLOOK
The Recession Was Severe and Swift, The Recovery Should
Be Strong
Decline in Real GDP (%) Length of Recession (months)
for each of the post-WWII recessions for each of the post-WWII recessions
20
Historic average: 11 18
18
16 16
0.0 16
-0.4 14
-0.7
-2.0 -1.3 -1.4
-1.7 12 11
-2.2 10 10
-2.5 -2.6
-3.1 10
-4.0 -3.6 8 8 8 8
-4.0 8
6
-6.0 6
4 3
-8.0
Historic average: -2.1 2
0
-10.0
-10.6
-12.0
Source: Bureau of Economic Analysis as of December 2020.
6ECONOMIC & MARKET OUTLOOK
Here Comes the Consumer
Retail Sales - Sector Performance Available Cash & MMF
January 2021, m-o-m, % change $, trillion
0 2 4 6 8 10 12 14 16
Retail Sales 5.3 12
Recession
Vehicle & Parts 3.1 Bank deposits: Jan @ 9.9
Furniture 12.0 10
Gov't MMF: Jan @ 3.7
Electronic 14.7 Since recession start
+ 1.9 trillion
Building Materials 4.6 8 +24%
Food & Bev. 2.4
Health & P. Care 1.3 6
Gas Stations 4.0
Clothing & Accessories 5.0 4 Since recession start
+ 1.0 trillion
Sporting Goods 8.0 +27%
General Merchandise 5.5 2
Miscellaneous 1.8
Non Store (Internet) 11.0 0
2010 2012 2014 2016 2018 2020 2022
Restaurant & Bars 6.9
Source: Bureau of Labor Statistics as of January 2021. Source: Federal Reserve, ICI Investment Institute as of February 2021.
7ECONOMIC & MARKET OUTLOOK
Imbalances Are Causing Inflation in Some Places and
Deflation in Others
Inflation (PCE)
% change y-o-y of selected items, 12 months ending December
2020
Inflation: PCE Core Price Index
%, seasonally adjusted Used Cars 9.1
3.0 Paper Products 7.7
Cable & Satellite TV 4.2
2.5 Cleaning Products 5.8
Food at Home 3.9
2.0
Recreational Books 4.7
1.5 0.0 2.0 4.0 6.0 8.0 10.0
1.0 Inflation (PCE)
Recession % change y-o-y of selected items, 12 months ending December
0.5 y-o-y: Dec @ 1.5 2020
Period Average @ 1.7
Fed Target Rate @ 2.0 -6.0 Women's Clothing
0.0
2000 2005 2010 2015 2020
-11.2 Hotels
-17.0 Public Transportation
-15.3 Gasoline
-24.6 Airline Fares
-30.0 -25.0 -20.0 -15.0 -10.0 -5.0 0.0
Source: Bureau of Economic Analysis as of January 2021.
8ECONOMIC & MARKET OUTLOOK
Global Recovery Underway
Prospects expected to vary regionally and by economies, according to success in responding to the pandemic
While China and EM Asia continue to lead the global recovery, Europe has struggled more to contain the virus
IMF 2021 GDP Forecasts
9.0%
8.0%
7.0%
6.0%
5.0%
4.0%
3.0%
2.0%
1.0%
0.0%
Global US Euro Area China Emerging Asia
October Estimate January Estimate
Source: IMF.
9ECONOMIC & MARKET OUTLOOK
Asset Class Performance
Asset Class Returns
S&P 500 (TR)
S&P Small Cap 600
China Shanghai
Dow Jones Select Dividend Index
Nasdaq-100
MSCI Europe
We expect real returns
to be moderate, with MSCI EAFE
Equities
higher volatility over MSCI EM Asia
the next few quarters. S&P U.S. Treasury Bond 10-Year Index
S&P/LSTA U.S. Leveraged Loan 100
Bloomberg Barclays Municipal HY
Bloomberg Barclays U.S. High Yield Corporate
Bloomberg Barclays U.S. Aggregate
Fixed Income
Corp. EM Bonds (J.P. Morgan CEMBI)
Gold
Brent Oil
Real Assets
Bloomberg Commodity Index
-20% -10% 0% 10% 20% 30% 40% 50% 60%
3YR 1YR YTD
Source: FactSet. As of February 28, 2021. Total returns include dividends reinvested.
10ECONOMIC & MARKET OUTLOOK
Sector Performance
S&P
YTD
S&P 500 Sectors Weight
2/28/21
2/28/2021
Energy 27.30% 2.84%
Financials 9.63% 11.22%
Communication Services 4.81% 11.08%
Real Estate 2.08% 2.36%
Health Care 1.42% 13.12%
Materials 1.39% 2.63%
Information Technology 0.28% 27.37%
Consumer Discretionary -0.53% 12.40%
Industrials -0.72% 8.43%
Consumer Staples -6.51% 5.97%
Utilities -6.98% 2.58%
YTD
Growth vs Value
2/28/21
S&P 500 Pure Growth 1.0%
S&P 500 Pure Value 13.3%
Source: S&P as of February 28, 2021.
11ECONOMIC & MARKET OUTLOOK
Focused Regional Allocations Can Enhance Returns
U.S. better positioned than Europe for short-term recovery and long-term economic growth
Emerging markets in Asia present a more positive growth outlook than other emerging markets
Regional Equity Market Performance: 5 Years as of 1/31/2021
20%
Overweight
18% Overweight 17%
16%
16%
14%
12% Overweight
10% 10% Underweight Underweight
8% 8%
8%
6%
4%
2%
0%
U.S. Core Equities U.S. High Dividend Equities Europe Emerging Markets Asia Emerging Markets Excluding
Asia
Source: Bloomberg. U.S.: S&P 500 Index. Europe: MSCI Europe Index. Emerging Markets Asia: MSCI Emerging Markets Asia
Index. Emerging Markets Excluding Asia: MSCI Emerging Markets Excluding Asia Index.
12ECONOMIC & MARKET OUTLOOK
Stocks Appear Fully Valued
S&P 500 Forward Price/Earnings Ratio
3.17
24 Overvalued
3.07
2.97
18
2.87
Fairly Priced
16 2.77
14 Attractive
2.67
2.57
Very Attractive
10 2.47
1992 1994 1996 1998 1999 2001 2003 2005 2006 2008 2010 2012 2013 2015 2017 2019 2020
Source: FactSet, CNR Research as of February 28, 2021.
13ECONOMIC & MARKET OUTLOOK
Equities Still Look Attractive vs. Bonds
Equity Risk Premium
8%
Stocks Cheap
6%
4%
2%
0%
-2% Stocks Expensive
-4%
-6%
1969 1972 1975 1978 1981 1984 1987 1990 1993 1996 1999 2002 2005 2008 2011 2014 2017 2020
Source: Bloomberg, FactSet.
14ECONOMIC & MARKET OUTLOOK
Near-term Equity Outlook
Market Appears Fully Valued; Expect More Modest Gains
2021 S&P 500 EPS
CNR 18.5 19 19.5 20.0 21 21.0 21.5 22 22.5
Y/Y Change
Estimate
$175 25% -14% -11% -9% -7% -5% -2% 0% 2% 4%
$178 27% -12% -10% -8% -5% -3% -1% 2% 4% 6%
$182 30% -10% -8% -6% -3% -1% 1% 4% 6% 9%
2021 S&P 500 EPS
CNR 18.5 19 20 20.0 21 21.0 21.5 22 22.5
Y/Y Change
Estimate
$175 25% 3,238 3,325 3,413 3,500 3,588 3,675 3,763 3,850 3,938
$178 27% 3,293 3,382 3,471 3,560 3,649 3,738 3,827 3,916 4,005
$182 30% 3,367 3,458 3,549 3,640 3,731 3,822 3,913 4,004 4,095
25% Downside Risk
50% Base Case
25% Upside Potential
Source: City National Rochdale estimates. As of February 28, 2021.
Near-term indicates a 3 to 6-month view.
15ECONOMIC & MARKET OUTLOOK
Short-Term Volatility Is Normal
S&P 500 Return (%)
40
Calendar Year Returns 34
Intra-Year Declines* 31 30 29
30 26 26 27 26 27 26
23
20 20 19
20 17 16
Corrections are a 15 15 14
12 13 13
normal part of market 9
11 10
movements, which 10 7
4 4
should encourage 1 2 3
0
clients to stay the 0
course when markets -2 -1
get choppy. -3 -10 -3
-10 -7 -7 -6 -6 -5 -6 -7 -6
-10 -8 -9 -8 -8 -9 -8 -10 -8 -7 -8 -7
-11 -12 -13 -10 -11
-13 -12
-14
-20 -17-18-17 -17 -16
-20 -19 -19 -20
-23
-30 -28
-30
-34 -34 -34
-40 -38
-49
-50
1980 1984 1988 1992 1996 2000 2004 2008 2012 2016 2020
Source: FactSet. As of March 2021.
*Intra-year declines are the largest declines within the calendar year.
16ECONOMIC & MARKET OUTLOOK
Focus on High-quality Companies, Reasonable Valuations
Speculative emerging technology stocks are unprofitable but highly valued
Preference for established, profitable companies expected to benefit from key trends
Profitability: Return on Equity Valuations: Price to Earnings Ratio
40% 250
30%
200
20%
10%
150
0%
-10%
100
-20%
-30%
50
-40%
-50% 0
Nesting Digital Healthcare Speculative Nesting Digital Healthcare Speculative
Consumer Revolution Innovation Emerging Consumer Revolution Innovation Emerging
Technology Technology
Source: CNR Research, Bloomberg.
17ECONOMIC & MARKET OUTLOOK
Slight Rise in Yields, but Interest Rates Expected to
Remain Low
Slightly higher inflation expectations have contributed to Treasury yields above 1%
Rapid near-term increase in interest rates unlikely
10-Year U.S. Treasury Yield
3.0%
2.5%
2.0%
1.5%
1.0%
0.5%
0.0%
Source: Bloomberg.
18ECONOMIC & MARKET OUTLOOK
Higher Return Asset Classes Preferable to Investment
Grade Bonds
Where suitable, higher-return asset classes can help to achieve investment goals
2009-2019 Long-Term Forecast
High Dividend Stocks 13% 7%
Emerging Markets Stocks 4% 8%
High Yield Bonds 8% 5%
Alternatives 10%-15% 8%-12%
Source: CNR Research, Bloomberg. High Dividend Stocks: Dow Jones U.S. Select Dividend Index. Emerging Markets Stocks:
MSCI Emerging Markets Index. High Yield Bonds: Bloomberg Barclays US Corporate High Yield Index.
Alternatives historical and projected returns reflect estimated performance across a range of alternative investment strategies
and are intended for illustrative purposes only.
Past performance is not a guarantee of future results. The expected returns are net of any City National Rochdale
management fees; however, other fees may apply. The expected returns do not include fees for trading costs (e.g.,
commissions) or any fees charged by your financial advisor. Please speak to your financial advisor for a complete
understanding of all fees.
19ECONOMIC & MARKET OUTLOOK
Potential for Reversion of High Dividend Equities
Valuation difference similar to the tech bubble
Historically, underperformance of recent magnitude has been followed by outperformance
Rolling 5-Year Relative Returns
High Dividend Stocks vs. S&P 500
25%
20%
High Dividend Stocks
Outperform
15%
10%
5%
0%
-5%
-10%
-15% S&P 500
1997 1998 1999 2000 2001 2002 2003 2004 2005 2006 2007 2008 2009 2010 2011 2012 2013 2014 2015 2016 2017 2018 2019 2020 Outperforms
Source: Bloomberg. High dividend stocks: Dow Jones U.S. Select Dividend Index.
20ECONOMIC & MARKET OUTLOOK
Targeting Consistent Income and Strong Total Return
High Dividend and Income Strategy performance has historically achieved long-term goals
Seeks to provide strong income in a low interest rate environment with potential for capital appreciation
CNR High Dividend and Income Composite
Annual Performance
40%
30%
20%
Average Calendar
10%
Year Return: 9%
0%
-10%
-20%
-30%
2002 2003 2004 2005 2006 2007 2008 2009 2010 2011 2012 2013 2014 2015 2016 2017 2018 2019 2020
Please refer to the composite disclosure slide at the end of this presentation for further detail.
21ECONOMIC & MARKET OUTLOOK
Monetary Stimulus Drives Yields Lower
Investment grade bond yields ended the year near 1% – not enough to cover expected inflation
Non-investment grade yields also fell, but still appear to be relatively attractive
Yields vs. Pre-Crisis
7% 6.6%
5.8% 5.7%
6% 5.6%
5.2%
5%
4.3% 4.3%
4% 3.8%
3%
2.4%
2%
1.2%
1%
0%
Investment Grade U.S. High Yield Bonds U.S. Senior Secured Loans CLO Debt Emerging Markets High
Corporate Bonds Yield Bonds
12/31/2019 1/29/2021
Source: Bloomberg. US High Yield Corporate Bonds: Bloomberg Barclays US Corporate High Yield Index, Emerging Market
Corporate Bonds: ICE BofA Emerging Market High Yield Corporate Bond Plus Index, US Investment Grade Corporate Bonds:
Bloomberg Barclays US Intermediate Corporate Index, US Senior Secured Loans: S&P/LSTA Leveraged Loan 100 Index. US
CLOs: Palmer Square CLO Debt Index.
22ECONOMIC & MARKET OUTLOOK
Opportunistic Fixed Income Well Positioned in Recovery
Investment grade bonds expected to struggle with low interest rates
High yield bonds have historically performed well in economic recoveries amid low interest rates
COVID-19 Pandemic Great Financial Crisis
High Yield vs. Investment Grade Bonds High Yield vs. Investment Grade Bonds
115 150
110 140
105 130
120
100
110
95
100
90
90
85
80
80
70
75 60
Investment Grade Bonds High Yield Bonds Investment Grade Bonds High Yield Bonds
Source: Bloomberg. High Yield Bonds: Bloomberg Barclays U.S. Corporate High Yield Index. Investment Grade Bonds:
Bloomberg Barclays U.S. Aggregate Bond Index.
23ECONOMIC & MARKET OUTLOOK
High Tax-free Income in a Low-yield World
Central Bank rate repression creates tailwinds for higher-yielding alternatives
While U.S. Treasury yields hit all-time lows, HY taxable-equivalent municipal yields are above average
HY Muni Yields Remain Favorable vs. High Quality Bonds
18%
16%
14%
12%
10%
8%
6% 5.9%
4%
2%
0.9%
0%
2004 2005 2006 2007 2008 2009 2010 2011 2012 2013 2014 2015 2016 2017 2018 2019 2020
Bloomberg Barclays HY Muni Tax Equiv. Yield Rolling 3-mo Avg* 10-yr UST 3-mo Rolling Yield
Source: Bloomberg, CNR as of January 31, 2021.
24ECONOMIC & MARKET OUTLOOK
Examples of Attractive Alternative Investments
Where Suitable, CNR Seeks Out Unique Strategies That Can Help Clients Achieve Goals
Potential Diversification
Tax Efficiency Liquidity
Income Benefits
Railcar Leasing 7%-10%
CLO Equity 8%-12%
Reinsurance 5%-7%
Healthcare
10%-15%
Royalties
Source: CNR Research.
Alternative investment potential income reflects estimated performance across a sample of alternative investment strategies. The expected returns are
net of any City National Rochdale management fees; however, other fees may apply. The expected returns do not include fees for trading costs (e.g.,
commissions) or any fees charged by your financial advisor. Please speak to your financial advisor for a complete understanding of all fees.
25ECONOMIC & MARKET OUTLOOK
2021 Market Outlook
Positive but Moderate Portfolio Returns Expected
2021 Forecasted Expected Returns (%)
16
14 Emerging
MidSmall Cap Asia Alternatives
6%-12% 7%-12% 6%-12%*
12 Dividend &
U.S. Growth Income
Balanced
6%-10% 6%-10%
10 Portfolio
Tax- (60/40)
Developed
Exempt 6%-8%
8 Markets Taxable
5%-7% 5%-7%* 5%-7%*
6
4
Taxable Tax-Exempt
1%-2% 1%-2%
2
0
Core Opportunistic Balanced
Equities Alternative
Fixed Income Fixed Income Portfolio
Source: City National Rochdale. As of January 2021. Forecasted expected returns represent City National Rochdale’s opinion
for these asset classes, are for illustrative purposes only, and do not represent client returns. The expected returns presented
for these asset classes do not reflect any deductions for City National Rochdale fees or expenses. Actual client portfolio and
investment returns will vary.
*Forecasted expected returns for HY Municipal and Municipal FI represent the taxable equivalent return at a 43.4% tax rate.
26ECONOMIC & MARKET OUTLOOK
Capital Market Assumptions
Near-Term Long-Term Historical Long-Term Historical Max
Asset Class Return Annual Return Annual Annual Risk Annual Historic
Estimate* Estimate Return** Estimate Risk Drawdown***
Domestic
Large Cap Core 6.3 7.3 9.3 14.0 15.5 -50.0
Mid/Small Cap 6.4 8.0 10.7 16.0 17.0 -58.0
Equities Dividend Income 6.6 6.5 8.1 13.0 13.5 -40.0
International
Developed Markets 5.7 6.8 5.6 16.5 17.0 -57.0
Emerging Markets 7.4 8.2 9.5 20.0 22.5 -60.0
Government/Agency 0.2 0.80 5.7 2.5 3.5 -4.0
Investment-Grade Corporate 1.3 1.4 6.8 5.0 5.0 -9.0
Core Fixed Income/Cash
Tax-Exempt 0.75 1.1 5.1 2.5 2.8 -2.0
Cash and Equivalents 0.0 0.5 3.0 0.0 0.0 0.0
Global Bonds 1.1 1.5 5.6 5.5 5.5 -10.0
Global High Yield 3.8 4.6 8.2 9.0 10.0 -34.0
Bank Loans 3.6 3.9 7.1 7.0 7.0 -30.0
Opportunistic Income
Preferred Stock 4.5 4.0 5.7 12.5 13.0 -55.0
High-Yield – Taxable 3.5 4.3 7.2 7.5 8.0 -34.0
High-Yield – Tax-Exempt 3.9 4.4 5.9 7.5 8.0 -30.0
Reinsurance 7.0 7.0 9.0 13.0 16.0 -20.0
Collateralized Loan Obligations 10.0 9.0 8.4 14.0 15.0 -75.0
Railcar Leasing 6.0 7.0 10.0 12.0 13.0 -15.0
Alternative Investments
Healthcare Royalties 8.0 9.0 11.0 10.0 12.0 -8.0
Aviation Leasing 6.0 8.0 10.0 12.0 13.0 -15.0
Private Equity Secondaries 9.5 10.0 13.0 16.0 18.0 -34.0
U.S. Real Estate 6.0 6.0 8.9 23.0 23.0 -70.0
Diversified Commodities 2.0 4.5 5.9 14.5 14.5 -66.0
Real Assets
Precious Metals 3.0 4.5 4.7 20.0 17.5 -68.0
Inflation-Protected Fixed Income 0.3 1.0 5.0 5.0 5.5 -13.0
Sources: Morningstar Direct, Bloomberg, City National Rochdale. As of January 2020. Past performance is not a guarantee of future results. The expected returns are net of any City National Rochdale
management fees; however, other fees may apply. The expected returns do not include fees for trading costs (e.g., commissions) or any fees charged by your financial advisor.
Please speak to your financial advisor for a complete understanding of all fees. Drawdown: The measure of decline from a historical peak.
*Current 5-year YTW is used to estimate near-term expectations for Core Fixed Income, Fixed Income segments of Opportunistic Income, and Inflation Protected Fixed Income. Near-term return
expectation indicates a 12- to 24-month view. **Historical returns begin in January 1989. If an asset class index was not in existence during that time, a similar proxy was used.
***Max drawdown not illustrated for 1928-1932 for U.S. High Yield (-57%), Large Cap (-83%), and Small Cap (-90%).
27INDEX DEFINITIONS
Index Definitions
The Standard & Poor’s 500 Index (S&P 500) is a market capitalization-weighted index of 500 common stocks chosen for market size, liquidity, and industry group
representation to represent U.S. equity performance.
MSCI Emerging Markets Asia Index is a free float-adjusted market capitalization index that is designed to measure equity market performance in the Asian emerging
markets.
The MSCI EAFE Index (Europe, Australasia, Far East) is a free float-adjusted market capitalization index that is designed to measure the equity market performance
of developed markets, excluding the U.S. & Canada. As of June 2007, the MSCI EAFE Index consisted of the following 21 developed market country indices:
Australia, Austria, Belgium, Denmark, Finland, France, Germany, Greece, Hong Kong, Ireland, Italy, Japan, the Netherlands, New Zealand, Norway, Portugal,
Singapore, Spain, Sweden, Switzerland, and the United Kingdom.
The MSCI Europe Index is a free float-adjusted market capitalization index that is designed to measure developed market equity performance in Europe. As of
September 2002, the MSCI Europe Index consisted of the following 16 developed market country indices: Austria, Belgium, Denmark, Finland, France, Germany,
Greece, Ireland, Italy, the Netherlands, Norway, Portugal, Spain, Sweden, Switzerland, and the United Kingdom.
The MSCI World is a market cap weighted stock market index of 1,655[1] stocks from companies throughout the world. The components can be found here.[2] It is
maintained by MSCI, formerly Morgan Stanley Capital International, and is used as a common benchmark for 'world' or 'global' stock funds intended to represent a
broad cross-section of global markets.
The Michigan Consumer Sentiment Index (MCSI) is a monthly survey of U.S. consumer confidence levels conducted by the University of Michigan. It is based on
telephone surveys that gather information on consumer expectations regarding the overall economy.
The Barclays Aggregate Bond Index is composed of U.S. government, mortgage-backed, asset-backed, and corporate fixed income securities with maturities of one
year or more.
The Barclays High Yield Municipal Index covers the high yield portion of the U.S.-dollar-denominated long-term tax-exempt bond market. The index has four main
sectors: state and local general obligation bonds, revenue bonds, insured bonds, and pre-refunded bonds.
The Bloomberg Barclays U.S. Treasury Index is an unmanaged index of prices of U.S. Treasury bonds with maturities of one to 30 years.
The Bloomberg Barclays U.S. Corporate Bond Index is an unmanaged market-value-weighted index of investment-grade corporate fixed-rate debt issues with
maturities of one year or more.
The Bloomberg Barclays U.S. Corporate High Yield Index is an unmanaged, U.S.-dollar-denominated, nonconvertible, non-investment-grade debt index. The index
consists of domestic and corporate bonds rated Ba and below with a minimum outstanding amount of $150 million.
The Bloomberg Barclays Emerging Markets USD Aggregate Index tracks total returns for external-currency-denominated debt instruments of the emerging markets.
Countries covered are Argentina, Brazil, Bulgaria, Ecuador, Mexico, Morocco, Nigeria, Panama, Peru, the Philippines, Poland, Russia, and Venezuela.
The Bloomberg Barclays U.S. Agency Bond Index is a rules-based, market-value-weighted index engineered to measure investment-grade agency securities publicly
issued by U.S. government agencies. Mortgage-backed securities are excluded.
S&P Leveraged Loan Indexes (S&P LL indexes) are capitalization-weighted syndicated loan indexes based upon market weightings, spreads, and interest payments.
The S&P/LSTA Leveraged Loan 100 Index (LL100) dates back to 2002 and is a daily tradable index for the U.S. market that seeks to mirror the market-weighted
performance of the largest institutional leveraged loans, as determined by criteria. Its ticker on Bloomberg is SPBDLLB.
28INDEX DEFINITIONS
Index Definitions (continued)
The Dow Jones Select Dividend Index seeks to represent the top 100 U.S. stocks by dividend yield. The index is derived from the Dow Jones U.S. Index and generally
consists of 100 dividend-paying stocks that have five-year non-negative Dividend Growth, five-year Dividend Payout Ratio of 60% or less, and three-month average
daily trading volume of at least 200,000 shares.
The Bloomberg Commodity Total Return Index, formerly known as Dow Jones-UBS Commodity Index Total Return (DJUBSTR), is composed of futures contracts and
reflects the returns on a fully collateralized investment in the BCOM. This combines the returns of the BCOM with the returns on cash collateral invested in 13-week
(three-month) U.S. Treasury Bills.
The Corporate Emerging Market Bond Index (CEMBI) is J.P. Morgan's index of U.S.-dollar-denominated debt issued by emerging market corporations.
The Standard & Poor’s Small Cap 600 Index (S&P 600) measures the small-cap segment of the U.S. equity market. The index is designed to track companies that
meet specific inclusion criteria to ensure that they are liquid and financially viable.
Nasdaq 100 Index is an index composed of the 100 largest, most actively traded U.S. companies listed on the Nasdaq stock exchange.
The U.S. Treasury 10-year Note is a debt obligation issued by the United States government that matures in 10 years. A 10-year Treasury Note pays interest at a fixed
rate once every six months and pays the face value to the holder at maturity.
The Shanghai Stock Exchange (SSE) composite is a market composite made up of all the A shares and B shares that trade on the Shanghai Stock Exchange.
Brent Crude is a major trading classification of sweet light crude oil that serves as a major benchmark price for purchases of oil worldwide. This grade is
described as light because of its relatively low density, and sweet because of its sulfur content.
Employment Index: U.S. jobs with the exception of farmwork, unincorporated self-employment, and employment by private households, the military, and intelligence
agencies.
A consumer price index (CPI) measures changes in the price level of a market basket of consumer goods and services purchased by households. The CPI is a
statistical estimate constructed using the prices of a sample of representative items whose prices are collected periodically.
The “core” PCE price index is defined as personal consumption expenditures (PCE), prices excluding food and energy prices. The core PCE price index measures the
prices paid by consumers for goods and services without the volatility caused by movements in food and energy prices to reveal underlying inflation.
The S&P/Case-Shiller Home Price Indexes are a group of indexes that track changes in home prices throughout the United States. The indexes are based on a
constant level of data on properties that have undergone at least two arm's length transactions.
The ISM Manufacturing Index is based on surveys of more than 300 manufacturing firms by the Institute for Supply Management (ISM). The ISM Manufacturing Index
monitors employment, production, inventories, new orders and supplier deliveries. A composite diffusion index monitors conditions in national manufacturing and is
based on the data from these surveys.
The ISM Non-Manufacturing Index is an index based on surveys of more than 400 non-manufacturing firms' purchasing and supply executives, within 60 sectors
across the nation, by the Institute of Supply Management (ISM). The ISM Non-Manufacturing Index tracks economic data, like the ISM Non-Manufacturing Business
Activity Index. A composite diffusion index is created based on the data from these surveys, that monitors economic conditions of the nation.
Indices are unmanaged, and one cannot invest directly in an index. Index returns do not reflect a deduction for fees or expenses.
29IMPORTANT DISCLOSURES
Important Disclosures
The information presented does not involve the rendering of personalized investment, financial, legal, or tax advice. This presentation is not an offer to buy or sell, or a
solicitation of any offer to buy or sell, any of the securities mentioned herein.
The material contains forward-looking statements regarding intent, beliefs, or current expectations which are used for informational purposes only and do not reflect
actual results. These statements are based primarily upon a hypothetical set of assumptions applied to certain historical financial information that has been provided
by third-party sources and, although believed to be reliable, the information has not been independently verified and its accuracy or completeness cannot be
guaranteed. The opinions, projections, forecasts, and forward-looking statements expressed are also valid as on the date of this document and are subject to change
based on market and other conditions
There are inherent risks with fixed income investing. These risks may include interest rate, call, credit, market, inflation, government policy, liquidity, or junk bond.
When interest rates rise, bond prices fall. This risk is heightened with investments in longer duration fixed income securities and during periods when prevailing
interest rates are low or negative.
There are inherent risks with equity investing. These risks include, but are not limited to, stock market, manager, or investment style. Stock markets tend to move in
cycles, with periods of rising prices and periods of falling prices.
Investing in international markets carries risks such as currency fluctuation, regulatory risks, and economic and political instability. Emerging markets involve
heightened risks related to the same factors, as well as increased volatility, lower trading volume, and less liquidity. Emerging markets can have greater custodial and
operational risks, and less developed legal and accounting systems than developed markets.
Concentrating assets in the real estate sector or REITs may disproportionately subject a portfolio to the risks of that industry, including the loss of value because of
adverse developments affecting the real estate industry and real property values. Investments in REITs may be subject to increased price volatility and liquidity risk;
concentration risk is high.
Investments in below-investment-grade debt securities, which are usually called “high yield” or “junk bonds,” are typically in weaker financial health. Such securities
can be harder to value and sell, and their prices can be more volatile than more highly rated securities. While these securities generally have higher rates of interest,
they also involve greater risk of default than do securities of a higher-quality rating.
The yields and market values of municipal securities may be more affected by changes in tax rates and policies than similar income-bearing taxable securities. Certain
investors' incomes may be subject to the Federal Alternative Minimum Tax (AMT), and taxable gains are also possible.
Investments in the municipal securities of a particular state or territory may be subject to the risk that changes in the economic conditions of that state or territory will
negatively impact performance. These events may include severe financial difficulties and continued budget deficits, economic or political policy changes, tax base
erosion, state constitutional limits on tax increases, and changes in the credit ratings.
Yield to Worst – The lower of the yield to maturity or the yield to call. It is essentially the lowest potential rate of return for a bond, excluding delinquency or default.
Investments in emerging markets bonds may be substantially more volatile, and substantially less liquid, than the bonds of governments, government agencies, and
government-owned corporations located in more developed foreign markets. Emerging markets bonds can have greater custodial and operational risks, and less
developed legal and accounting systems than developed markets.
30IMPORTANT DISCLOSURES
Important Disclosures (continued)
Investments in commodities can be very volatile, and direct investment in these markets can be very risky, especially for inexperienced investors.
Returns include the reinvestment of interest and dividends.
All investing is subject to risk, including the possible loss of the money you invest. As with any investment strategy, there is no guarantee that investment objectives
will be met, and investors may lose money. Diversification may not protect against market risk or loss. Past performance is no guarantee of future performance.
Please see the Offering Memorandum for more complete information regarding the Fund’s investment objectives, risks, fees and other expenses.
Alternative investments are speculative, entail substantial risks, offer limited or no liquidity and are not suitable for all investors. These investments have limited
transparency to the funds’ investments and may involve leverage which magnifies both losses and gains, including the risk of loss of the entire investment. Alternative
investments have varying, and lengthy lockup provisions.
This information is not intended as a recommendation to invest in a particular asset class, strategy or product.
The information presented is for illustrative purposes only and based on various assumptions which may not be realized. No representation or warranty is made as to
the reasonableness of the assumptions made or that all assumptions used have been stated or fully considered.
Estimated returns are based on multiple sources of historical market index data input into proprietary quantitative models specific to each asset class (e.g., equity,
fixed income, etc.), then adjusted for fundamental inputs such as yield, earnings growth, risk premiums, valuation, historical reversion, and market implied
expectations. Finally, we further adjust the estimated returns with our economic forecasts on market conditions and long-term expectations (which include economic
growth, inflation, interest rates, among other important inputs).
Performance does not represent the results of actual trading, but was achieved by means of retroactive application of a model designed with the benefit of hindsight.
Results may not reflect the impact that material economic and market factors might have on the adviser’s decision-making if adviser were actually managing client
assets.
This document may contain forward-looking statements relating to the objectives, opportunities, and the future performance of the U.S. market generally. Forward-
looking statements may be identified by the use of such words as; “expect,” “estimated,” “potential” and other similar terms. Examples of forward-looking statements
include, but are not limited to, estimates with respect to financial condition, results of operations, and success or lack of success of any particular investment strategy.
All are subject to various factors, including, but not limited to general and local economic conditions, changing levels of competition within certain industries and
markets, changes in interest rates, changes in legislation or regulation, and other economic, competitive, governmental, regulatory and technological factors affecting
a portfolio’s operations that could cause actual results to differ materially from projected results. Such statements are forward-looking in nature and involve a number
of known and unknown risks, uncertainties and other factors, and accordingly, actual results may differ materially from those reflected or contemplated in such
forward-looking statements. Prospective investors are cautioned not to place undue reliance on any forward-looking statements or examples. None of City National
Rochdale or any of its affiliates or principals nor any other individual or entity assumes any obligation to update any forward-looking statements as a result of new
information, subsequent events or any other circumstances. All statements made herein speak only as of the date that they were made.
31IMPORTANT DISCLOSURES
Important Disclosures (continued)
All investment strategies have the potential for profit or loss; changes in investment strategies, contributions or withdrawals may materially alter the performance and
results of a portfolio. Different types of investments involve varying degrees of risk, and there can be no assurance that any specific investment will be suitable or
profitable for a client's investment portfolio.
References to indexes and benchmarks in hypothetical illustrations of aggregate returns do not reflect the performance of any actual investment. Investors cannot
invest in an index and such returns do not reflect the deduction of the advisor's fees or other trading expenses. There can be no assurance that current investments
will be profitable. Actual realized returns will depend on, among other factors, the value of assets and market conditions at the time of disposition, any related
transaction costs, and the timing of the purchase. Indexes and benchmarks may not directly correlate or only partially relate to portfolios as they have different
underlying investments and may use different strategies or have different objectives than our strategies or funds.
CNR is free from any political affiliation and does not support any political party or group over another.
32For More Information
New York Headquarters
400 Park Avenue
New York, NY 10022
212-702-3500
Beverly Hills Headquarters
400 North Roxbury Drive
Beverly Hills, CA 90210
310-888-6000
info@cnr.com
www.cnr.com
33You can also read