ECONOMIC CURRENTS - Grant ...
←
→
Page content transcription
If your browser does not render page correctly, please read the page content below
ECONOMIC CURRENTS
November 09, 2021

One Way or Another:
Inflation & the Federal Reserve
Diane C. Swonk, Chief Economist

“One way, or another, I’m gonna find ya
I’m gonna get ya, get ya, get ya, get ya.”                      Economy Ends 2021 on High Note
						-Blondie, 1979
                                                                Real GDP slowed to a 2.0% rate in the third
                                                                quarter, the weakest pace in a year. Consumer
Since April, Federal Reserve Chairman Jay Powell has            spending decelerated in response to the spread
made one thing clear: Any surge in inflation that appears       of the Delta variant and acute shortages; vehicle
as we emerge from the pandemic will be “transitory.”            dealer lots are still nearly empty. Housing activity
Either price hikes triggered by reopening will abate            contracted for the second consecutive quarter in
naturally as demand normalizes and supply ramps up.             response to skyrocketing prices and shortages of
                                                                building materials and skilled carpenters. Business
Or, much like Blondie’s iconic hit about a stalker that lead
                                                                investment contracted when manufacturers
singer Deborah Harry endured in the 1970s, the Fed will         were unable to get the computer chips needed
use rate hikes to forcefully chase down inflation.              to produce and upgrade equipment. Inventories
                                                                were rebuilt but remain sparse. The trade deficit
The Federal Open Market Committee (FOMC) - the                  widened as exports fell in response to weakness
policy setting arm of the Fed - has started the process of      abroad and rising imports. Government spending
                                                                essentially flatlined.
removing accommodation by tapering asset purchases;
committee members will reduce their $120 billion in             Real GDP is forecast to rise 4.4% in the fourth
monthly purchases to $105 billion and $90 billion in            quarter, more than twice the pace of the third.
November and December, respectively. They left the door         Spending on travel and medical procedures
open to accelerate the pace of tapering when they meet          delayed during the height of infections is picking
again in December. The Fed wanted to complete tapering          up, while our borders have reopened to wealthy
                                                                foreign tourists. Housing remains constrained
before a liftoff in rates, which could occur sooner than
                                                                by sky-high prices and widespread shortages.
expected.                                                       Durable goods orders show a rebound in business
                                                                investment, while inventories are expected to
Powell went out of his way to say he would remain               continue to be replenished. Government spending
“patient…[but] will not hesitate” to raise rates if inflation   is expected to regain momentum, while the trade
looks more persistent. That is where the risk lies.             deficit is expected to narrow.

                                                                The resurgence in demand will spur inflation, which
This edition of Economic Currents takes a closer look at        is likely to test new pandemic highs in the fourth
the causes of the current inflation, how the Fed will likely    quarter. The CPI could come close to 6% on a year-
react to those shifts and what the actions mean for the         over-year basis during the last three months of the
outlook. Soft landings are tricky to engineer in the best of    year, the fastest pace since the height of the Gulf
times when economic shifts occur at a much slower pace          War in 1991.
and the Fed is preempting instead of chasing inflation.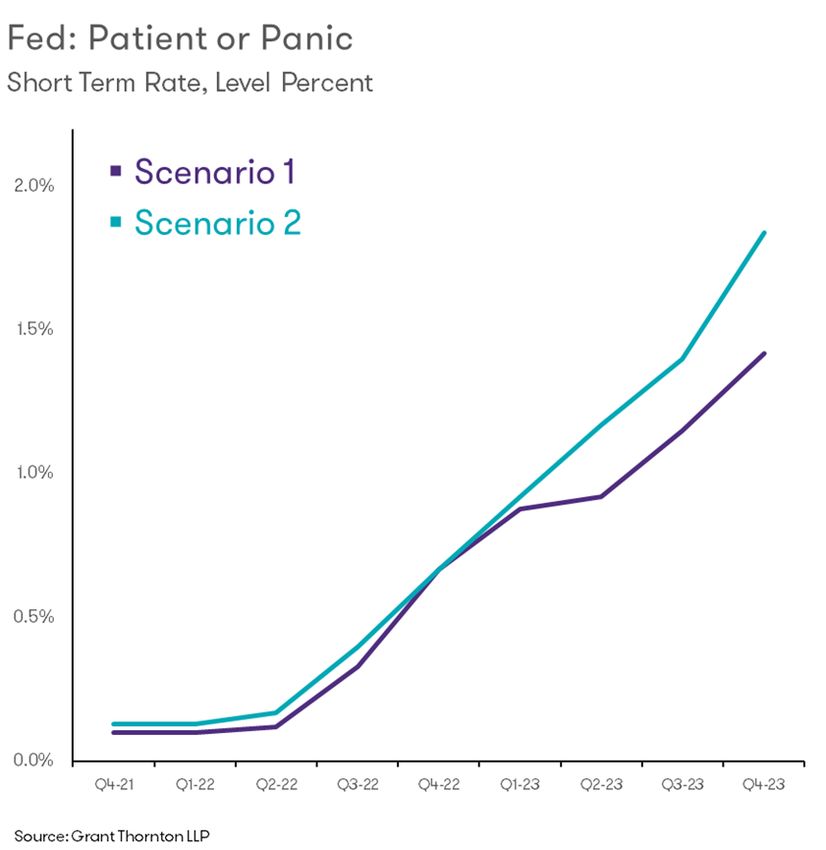
The chance of a misstep is rising, given how fast the          Scenario 2: The FOMC gets more nervous about
economy is shifting. Forecasting during the global             inflation. It picks up the pace of rate hikes in 2023 to
financial crisis was like standing on a fault line;            prevent inflation from becoming entrenched. Rate hikes,
forecasting during the pandemic is more akin to standing       combined with an unwanted surge in inventories, trigger a
on quicksand, where the shifts are rapid and unforgiving.      recession in 2024.

We have two scenarios. Our base case shows a more              It is not the worst of what could happen. Developing
patient Federal Reserve waiting for a full recovery in         economies would likely be forced to counter with rate
employment before raising rates in the second half of          hikes to defend their currencies. In response, the cost of
2022. The second has the Fed chasing down inflation            servicing high debt loads would mount, which ups the
with more aggressive rate hikes, something it hasn’t done      risk of a debt default and a larger meltdown in financial
since the 1980s; it does not end well.                         markets. Those losses could wash up on our shores and
                                                               compound a downturn triggered by a Fed misstep.
Boom/Bust
                                                               The forecast includes the bipartisan infrastructure bill,
2 Scenarios
                                                               which doesn’t fully hit the economy until the middle
Chart 1 shows the two scenarios for growth in response         part of the decade. The government is not very efficient
to the Fed’s actions in 2022 and 2023. The primary             at getting funds allocated out the door; large-scale
difference between the two scenarios is how the Fed            infrastructure projects take a long time to ramp up. They
reacts to the inflation we experience.                         tend to boost productivity growth, which makes them
                                                               less of a threat to overall inflation than other forms of
Scenario 1: Our base case has the Fed showing its              spending like direct transfers to households.
patience by looking through a rise in inflation in the first
half of 2022 and waiting for the labor market to heal          We did not include the administration’s spending
before a liftoff in rates. The Fed is expected to accelerate   package because it is still up for debate. How it is paid for
the pace of tapering in early 2022 so that it can begin the    matters for inflation. Transfer payments tend to be more
process of raising rates by midyear.                           inflationary than infrastructure spending if not paid for
                                                               via taxes or cuts elsewhere.

Chart 1

2 Monthly Economic Outlook: One Way or Another
What’s Driving Inflation? Demand is likely to remain elevated despite a sharp
drain in savings and the loss of unemployment insurance
There is much debate about what is triggering the
for millions in September. Employment and wage gains
current inflation:
picked up in October as the Delta wave abated, while
employment over the summer was revised up sharply. The
A. A demand surge juiced by fiscal and monetary
revisions to August and September added up to one full
stimulus;
month of new hires. The private sector is picking up the
baton from the public sector and gaining momentum as
B. Global supply chain disruptions, which were
we move into the winter.
exacerbated by the Delta variant of COVID;
The saving rate is expected to dip well below its
C. Labor shortages, which emerged as firms pushed
prepandemic levels in the months to come. The equity
to ramp up faster than workers could or would return,
in homes and stocks skyrocketed, which will add to the
given actual and perceived threats of contagion; or
gains in spending associated with stronger employment.
It should take well into 2022 for demand to normalize.
D. All of the above
That is assuming we have turned the corner on major
The correct answer is D: All of the above.
outbreaks in the U.S., which is becoming more probable.
Treatments for COVID have improved dramatically and
The impact the pandemic had on prices in spring
are expected to limit hospitalizations, which is key to
2020 - many prices plummeted - boosted year-on-year
keeping health care systems from being overwhelmed.
comparisons in spring 2021. Those “base effects,” were
The availability of vaccines for children 5-11 years of age
supposed to dissipate as we moved into the summer
could be a game changer, especially for working parents.
but did not. Chairman Powell is betting they will work in
reverse - inflation measures will abate - as we move into
The larger hurdle is the lag in the distribution of vaccines
spring 2022.
to developing economies. That increases the risk of more
problematic variants and disruptions to supply chains
A Demand Surge
and growth abroad.
The most recent round of stimulus far exceeded most
Supply Chain Disruptions
economists’ estimates of what was needed to fill the
hole created by the pandemic. Add ultra-low rates and
Producers were caught off guard by the surge in demand
the Fed’s reluctance to taper asset purchases, which
following the shock of initial lockdowns. Factories were
were needed to stabilize financial markets and avert a
easier to idle when the threat of actual infections flared.
financial crisis at the onset of the pandemic, and it is
Supply chain bottlenecks formed as plants in different
little surprise demand has surged.
countries reopened at different times. Empty containers
to ship goods were standard at distant ports as
Stimulus checks and low mortgage rates were
transportation systems were stressed beyond capacity.
leveraged to buy goods as people scrambled to make
being homebound more tolerable. They repaired and
The crisis revealed deep inefficiencies and problems with
remodeled, made space for offices and gyms. They
our ports and other transportation systems. Containers
upgraded their vehicles, bought new and vacation
couldn’t be unloaded fast enough for workers to get paid;
homes, RVs and boats. (Many are now on Craigslist.)
they are not compensated for waiting.
Demand for services was more fragile and susceptible
Climate change collided with the Delta variant to
to outbreaks but none-the-less significant. The Delta
exacerbate disruptions. Taiwan and its chokehold on the
outbreak this summer provided insights into how rapidly
production of computer chips is a key example. A fifty-
consumers could pivot back into goods from spending on
year drought forced rationing of water, which is critical to
services when the threat of contagion picked up.
production, while outbreaks idled plants for the first time.
3 Monthly Economic Outlook: One Way or AnotherSupply chain disruptions are likely to get worse before Immigration, which was the largest single contributor
they get better. The number of cargo ships waiting to to labor force growth in the 2010’s, came to a virtual
unload at California ports continued to swell in October. standstill as borders closed. Borders reopened to
Efforts to work the ports 24/7 could help alleviate those vaccinated foreigners on November 8, but it will take
backlogs but not cure the chronic shortages of truckers time to get foreign workers back. Immigration reform
needed to distribute those goods. is necessary to attract and keep the workers we so
desperately need.
The disruptions to production, mostly of refining
capacity, have abated but left fuel costs rising as we Dropouts from grade schools to universities surged when
enter the holiday season. Production picked up recently education shifted online. Some just delayed graduation,
but factories are still filling backlogs, not new orders. which limited the pool of workers entering the labor
force. Others will need to make up for education lost.
Work done by Oxford Economics suggests that
inventory-to-sales ratios were still 70% below pre- The ranks of the long-term unemployed remain elevated.
pandemic levels at the start of the fourth quarter. Powell Many were the last to get jobs in the previous expansion
himself admitted it will take well into 2022 to work and the first to be cut when the pandemic hit. They have
through the bottlenecks we face, at least six months later to find new employers, likely in a different location than
than hoped; those lags could prove even longer, given they were prior to the pandemic. That takes more time
the unpredictable nature of the pandemic. than returning to a previous employer. Surging prices
at the gas pump, a lack of mass transit to where the
Inventories are so tight that producers are double jobs and high rents are adding insult to injury; they are
ordering. We have not seen hoarding in decades; it could wiping out the surge in wages for low-wage workers,
trigger a bullwhip effect, with producers eventually costing them more to search for jobs and preventing
saddled with unwanted inventories. That is not likely until them from taking jobs that require long commutes.
2023. We could see a more traditional inventory cycle
with price cuts and a recession. Chairman Powell is optimistic that we can avoid a wage-
price spiral, like we saw in the 1970s. Productivity growth
Labor Shortages has improved with the rapid adoption of technology
prompted by the pandemic. Those gains justify a much
Research done by the online hiring site Indeed shows needed boost in wages, especially for low-wage workers.
that job postings were up nearly 50% at the end of
October compared to February 2020. That translates to The problem is that productivity gains are not evenly
a record 11.1 million job openings by the end of October. distributed across companies. Large, tech-savvy
retailers, which are driving wage gains for the lowest
Those figures suggest that the demand for workers paid worker, are benefitting the most from the push to
far exceeds the number of applicants; 7.4 million were digitize and automate. They have the scale to exert more
actively looking for employment in October. I have never control on their supply chains, which gives them an edge
seen anything like it. in getting goods on their shelves.
Labor supply is constrained. The number of workers The pandemic accelerated the concentration of
who were out sick or not looking for work due to illness employment in the largest retailers and is challenging
remained well above prepandemic levels in October. small and midsize business models. That shift is
Long-haul COVID could be affecting more than a million. important, as those same firms are less likely to be
unionized, a key feature of the 1970s.
Retirements soared during the crisis: 1.5 million more
people retired than the precrisis trend. Some of those Implications for Inflation & The Fed
reflect a fear of working in frontline jobs; they could
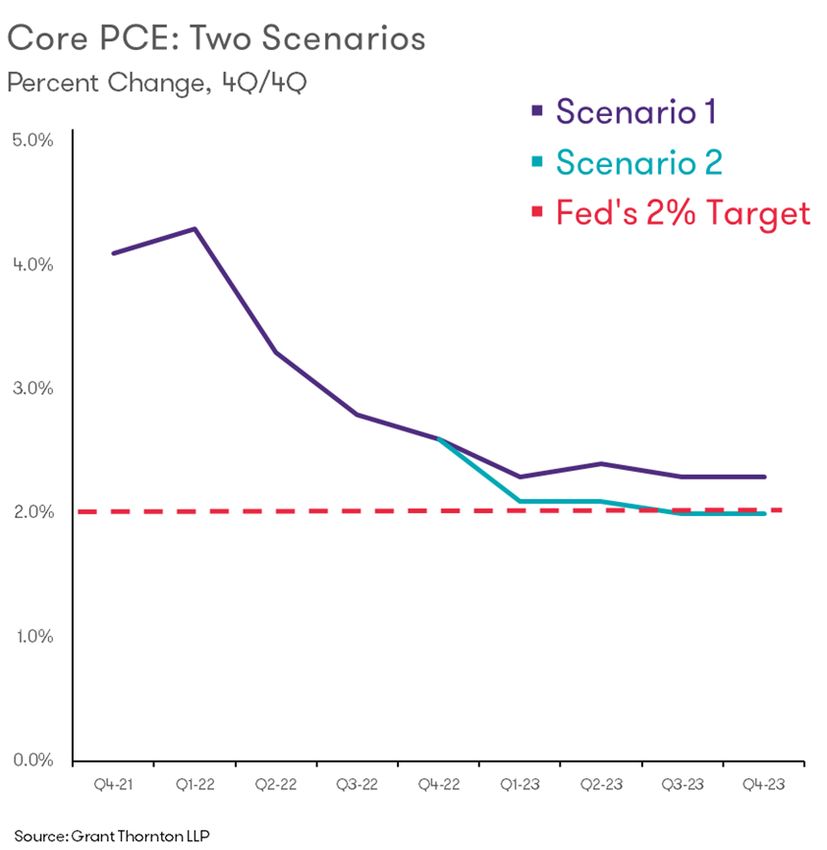
Charts 2 and 3 compare the trajectories of inflation and
come back when contagion risks abate, civility returns
rate hikes under both scenarios. The biggest difference is
and their savings run low. Another portion do not have to
the reaction of the Fed.
return because of the extraordinary rise in asset values.
4 Monthly Economic Outlook: One Way or AnotherScenario 1: Inflation is not likely to crest until the higher This is where it gets really tricky for the Federal Reserve.
base effects we saw in 2021 start to make the math on In Scenario 1, the Fed accelerates its tapering of asset
inflation harder in spring and summer. Even then, service purchases in early 2022 to allow more room for a liftoff in
sector prices are likely to be surging as more of the rates in the second half of the year.
pent-up demand for services is unleashed. Hotel rooms,
rental cars and airfares could easily move up again, The Fed starts liftoff over the summer of 2022, after labor
especially in light of diminished capacity. markets have fully healed. We have three rate hikes in
2022 and another three in 2023. That would bring the fed
A more worrisome concern is the move up in shelter and funds rate to 1.625%.
medical costs, which could place a floor on how low
inflation goes in late 2022 and 2023. Shelter costs alone, Scenario 2: Inflation remains elevated a bit longer, while
which include rents and owners’ equivalent rent estimates wage gains continue to rise at a surprising clip. The
by households, have already begun to accelerate. It Fed moves forward with an acceleration of its plans to
usually takes a year or more for the surge in home values taper. The strength of the October employment report
to show up on measured rents; we crossed that threshold represented a major step in that direction. Liftoff begins a
over the summer. bit sooner, by June 2022.
Medical costs are expected to rise in response to backlogs The Fed then starts to panic that inflation expectations,
on routine exams and the return of elective surgeries. which have a debatable effect on overall inflation, are
Those costs and the surge in rents could add more than becoming unanchored. Energy and food prices, which
one half of one percent to overall inflation measures in the Fed has less power to contain, play an outsized role in
2022. determining inflation expectations.
Wages still have some room to run, despite our skepticism It is important to remember that central bankers are
that could see the unionization and wage-price spirals we hardwired to worry more about inflation than the labor
saw in the 1970s. Labor markets are expected to recoup market. Chairman Powell is an outlier among his peers;
what was lost to the crisis in the first half of 2022 and he has more humility about the Fed’s forecasting prowess
more fully recover by mid-year. and is not as skittish about inflation. He is willing to allow
the labor market to fully heal before raising rates.
Chart 2 Chart 3
5 Monthly Economic Outlook: One Way or AnotherThe key is what happens next. The Fed starts to chase Why do we care? Financial markets are the oil of our
down inflation forcefully. This gives us three rate hikes economy; if they seize, the engine of the entire economy
in 2022 and another five in 2023. That takes the fed comes to a halt, not just Wall Street. Those who can
funds rate back up to 2.125%, a bit below the peak we afford it least are hit the hardest and any recession that
saw in the last cycle, which represented an overshoot. results could be deeper and harder to recover from than
The rationale will be that both growth and inflation are we have seen in the wake of the pandemic.
much hotter this time around. Indeed, the peak in rate
hikes could be even higher than it was in 2018, given
much stronger growth and inflation the Fed is likely to
Bottom Line
encounter.
This Fed is still staffed with people who spent their careers
preempting a nonexistent inflation; there is no precedent
The yield curve inverts, demand slows and inventories go
for how they will react to a more sustained surge in
from being tight to bloated. The double ordering done to
inflation. Chairman Powell is an outlier among his peers
hedge against shortages earlier in the cycle comes home
on this front.
to roost. The economy slips into recession, with a lag, in
2024. Inflation slips back below the Fed’s 2% threshold.
The risk is that they panic and chase down inflation much
like the stalker in Blondie’s iconic hit. “One day, maybe
There is risk of a larger financial meltdown, especially as
next week. I’m gonna meet ya…I will drive past your
developing economies struggle to deal with a more rapid
house…I’ll see who’s around…I’ll get ya.”
tapering of the Fed’s asset purchase program and faster
rate hikes. China has been a big buyer of our debt for a
That will end our relationship with inflation but at a hefty
long time; it is no longer playing that role as it focuses on
price. It could tip the economy into a recession, or worse,
its own problems.
if those hikes reverberate across developing economies. I
prefer more civil breakups; I have had some experience.
6 Monthly Economic Outlook: One Way or AnotherEconomic forecast — November 2021
2021 2022 2023 2021:2(A) 2021:3(A) 2021:4 2022:1 2022:2 2022:3 2022:4 2023:1 2023:2
National Outlook
Chain-Weight GDP1 5.5 4.2 2.1 6.7 2.0 4.5 5.0 4.7 3.0 2.0 1.7 1.9
Personal Consumption 8.0 3.3 1.9 12.0 1.6 4.6 3.3 2.0 1.7 1.8 1.8 1.9
Business Fixed Investment 7.6 6.5 3.5 9.2 1.8 6.1 8.8 7.6 5.6 3.6 2.9 2.8
Residential Investment 8.6 -5.1 -7.7 -11.7 -7.7 -6.9 -4.2 0.6 -3.1 -10.9 -12.8 -8.2
Inventory Investment (bil $ ‘12) -92 94 144 -168 -78 -34 17 90 128 140 152 158
Net Exports (bil $ ‘12) -1265 -1290 -1243 -1236 -1303 -1301 -1306 -1293 -1289 -1274 -1258 -1241
Exports 3.7 5.2 6.9 7.6 -2.5 2.3 5.7 9.4 7.8 7.8 7.1 6.7
Imports 13.1 4.1 3.2 7.1 6.0 1.1 4.2 4.5 4.5 3.4 2.9 2.6
Government Expenditures 0.6 2.0 1.3 -2.0 0.8 -0.1 4.4 3.0 2.1 1.3 0.9 1.0
Federal 0.9 0.2 -0.2 -5.3 -4.7 -0.8 5.5 -0.1 0.3 -1.2 -0.2 0.3
State and Local 0.4 3.1 2.2 0.2 4.4 0.4 3.8 5.0 3.2 2.9 1.6 1.5
Final Sales 5.4 3.2 1.9 8.1 -0.1 3.6 4.0 3.3 2.3 1.8 1.5 1.8
Inflation
GDP Deflator 4.0 4.0 2.4 6.0 5.6 5.2 4.8 1.9 2.5 1.9 3.1 1.8
CPI 4.5 4.5 2.2 8.5 6.6 5.5 5.0 2.7 2.1 1.7 2.8 1.7
Core CPI 3.4 3.6 2.6 8.2 5.3 3.0 3.7 2.1 2.8 2.4 2.8 2.4
Special Indicators
Corporate Profits2 6.9 5.5 0.2 45.1 12.8 6.9 7.3 -1.3 1.3 5.5 0.0 -1.7
Disposable Personal Income 1.7 -3.4 2.5 -30.2 -5.6 -6.1 -1.3 3.7 3.2 1.8 2.3 2.7
Housing Starts (mil.) 1.58 1.43 1.18 1.59 1.57 1.55 1.54 1.51 1.41 1.28 1.21 1.18
Civilian Unemployment Rate 5.4 3.7 4.0 5.9 5.1 4.3 4.0 3.6 3.5 3.6 3.7 3.9
Total Nonfarm Payrolls (thous.)3 5963 917 66 1847 1883 1405 1021 1050 904 694 181 278
Vehicle Sales
Automobile Sales (mil.) 3.4 3.9 4.0 3.9 3.1 2.8 3.5 3.8 4.1 4.1 4.2 4.0
Domestic 2.2 2.5 2.5 2.6 2.0 1.8 2.2 2.4 2.6 2.6 2.6 2.5
Imports 1.2 1.4 1.5 1.3 1.1 1.0 1.3 1.4 1.5 1.5 1.6 1.5
Lt. Trucks (mil.) 11.8 12.2 12.8 13.0 10.3 10.8 11.1 12.1 12.6 13.0 13.0 12.8
Domestic 9.1 9.4 9.9 9.9 7.8 8.4 8.5 9.3 9.7 10.0 10.0 9.8
Imports 2.7 2.8 2.9 3.1 2.5 2.4 2.6 2.8 2.9 3.0 3.0 3.0
Combined Auto/Lt.Truck 15.2 16.1 16.8 16.9 13.3 13.6 14.6 15.9 16.7 17.1 17.2 16.8
Heavy Truck Sales 0.5 0.5 0.5 0.5 0.4 0.4 0.4 0.5 0.5 0.5 0.5 0.5
Total Vehicles (mil.) 15.7 16.6 17.3 17.4 13.8 14.0 15.0 16.4 17.2 17.6 17.7 17.3
Interest Rate/Yields
Federal Funds 0.1 0.3 1.1 0.1 0.1 0.1 0.1 0.1 0.3 0.7 0.9 0.9
10-Year Treasury Note 1.4 1.9 2.6 1.6 1.3 1.4 1.5 1.7 2.1 2.4 2.5 2.6
Corporate Bond BAA 3.5 3.9 4.7 3.6 3.3 3.4 3.4 3.7 4.1 4.5 4.5 4.7
Exchange Rates
Dollar/Euro 1.19 1.18 1.21 1.21 1.18 1.15 1.16 1.17 1.18 1.20 1.20 1.21
Yen/Dollar 109.4 111.4 109.9 109.5 110.1 111.9 111.7 111.5 111.3 110.9 110.6 110.2
1.
in 2020, GDP was $18.4 trillion in chain-weighted 2012 dollars.
2.
Corporate profits before tax with inventory valuation and capital consumption adjustments, quarterly data represents four-quarter percent change.
3.
Total nonfarm payrolls, quarterly data represents the difference in the average from the previous period. Annual data represents 4Q to 4Q change.
Quarterly data are seasonally adjusted at an annual rate. Unless otherwise specified, $ figures reflect adjustment for inflation. Total may not add up due to rounding.
Copyright © 2021 Diane Swonk – All rights reserved. The information provided herein is believed to be obtained from sources deemed to be accurate, timely and reliable. However, no assurance is
given in that respect. The reader should not rely on this information in making economic, financial, investment or any other decisions. This communication does not constitute an offer or solicitation, or
solicitation of any offer to buy or sell any security, investment or other product. Likewise, this communication serves to provide certain opinions on current market conditions, economic policy or trends
and is not a recommendation to engage in, or refrain from engaging, in a particular course of action.
“Grant Thornton” refers to Grant Thornton LLP, the U.S. member firm of Grant Thornton International Ltd (GTIL), and/or refers to the brand under which the GTIL member firms provide audit, tax and
advisory services to their clients, as the context requires. GTIL and each of its member firms are separate legal entities and are not a worldwide partnership. GTIL does not provide services to clients.
Services are delivered by the member firms in their respective countries. GTIL and its member firms are not agents of, and do not obligate, one another and are not liable for one another’s acts or
omissions. In the United States, visit grantthornton.com for details.
© 2021 Grant Thornton LLP | All rights reserved | U.S. member firm of Grant Thornton International Ltd
7 Monthly Economic Outlook: One Way or AnotherYou can also read


