Do mice matter? Impacts of house mice alone on invertebrates, seedlings and fungi at Sanctuary Mountain Maungatautari - New Zealand Ecological Society
←
→
Page content transcription
If your browser does not render page correctly, please read the page content below
WattsZealand
New   et al.: Impacts
                Journalofofmice
                            Ecology
                                alone
                                    (2022)
                                      on biodiversity
                                           46(1): 3472 © 2022 New Zealand Ecological Society.                                         1

                  RESEARCH

Do mice matter? Impacts of house mice alone on invertebrates, seedlings and fungi at
Sanctuary Mountain Maungatautari

Corinne Watts1* , John Innes1 , Deborah J. Wilson2 , Danny Thornburrow1 , Scott Bartlam1 ,
Neil Fitzgerald1 , Vanessa Cave3 , Mark Smale1, Gary Barker1 and Mahajabeen Padamsee4
1
  Manaaki Whenua – Landcare Research, Private Bag 3127, Hamilton 3216, New Zealand
2
  Manaaki Whenua – Landcare Research, Private Bag 1930, Dunedin 9054, New Zealand
3
  Cave Statistical Consultancy Ltd, Glentui Lane, Hamilton 3293, New Zealand
4
  Manaaki Whenua – Landcare Research, Private Bag 92170, Auckland Mail Centre, Auckland 1142, New Zealand
*Author for correspondence (Email: wattsc@landcareresearch.co.nz)

Published online: 30 January 2022

          Abstract: The advent of mammal-resistant fences has allowed multi-species eradications of mammals from
          ecosanctuaries on the New Zealand mainland. However, maintaining eradication of house mice (Mus musculus)
          has proven difficult, and at some fenced reserves they are the only exotic mammal present and reach a high
          population density. Over 5 years we examined the impacts of mice alone on biodiversity at Sanctuary Mountain
          Maungatautari by comparing forest blocks with relatively high and low numbers of mice. We managed two
          independently fenced sites within the sanctuary to achieve high mouse numbers (up to 46 per hectare) at one
          site and undetectable mouse numbers at the second site. We then reversed these treatments by eradicating mice
          from the first site and allowing their numbers to increase at the second. We found strong evidence that mice
          reduced the abundance of ground-dwelling invertebrates, in particular caterpillars, spiders, wētā, and beetles,
          and reduced the mean body size of some taxa. In addition, earthworm abundance, biomass and species richness
          increased with a decreasing mouse population in one study block. No significant impact of mice on land snails,
          seedlings or fungi was detected at Maungatautari. Overall, there is substantial biodiversity gain from eradicating
          the full suite of pest mammals other than mice. However, mice may be catastrophic in ecosanctuaries that focus
          on the recovery of invertebrates or lizards. We expect that mouse control tools will steadily improve so that in
          the future mice can be eradicated and excluded from forest reserves such as Maungatautari.
          Keywords: earthworms, ecosanctuary, invertebrates, Mus musculus, New Zealand, seedlings, wētā

Introduction                                                           of small invertebrates (3–12 mm long) and plant material.
                                                                       Caterpillars are often the most common invertebrate group
Worldwide, the impacts of invasive species on native                   eaten by mice in forests, followed by spiders, beetles, and wētā
ecosystems have become a significant conservation issue.               (Jones & Toft 2006; Murphy & Nathan 2021). For example,
Extinctions, species declines, and ecosystem changes have              invertebrates accounted for 94% of the stomach contents of
been well documented on southern hemisphere islands, with              mice from a podocarp–broadleaved forest in the Ōrongorongo
introduced mammals, particularly rodents (Rattus spp. and              River valley, southern North Island (Fitzgerald et al. 1996);
house mice Mus musculus), causing the majority of these                these included caterpillars (found in 51% of stomachs),
impacts (Towns & Broome 2003; Howald et al. 2007; Angel                spiders (45%), beetles (27%), and wētā (17%). On Rangitoto
et al. 2009). House mice are one of the most widespread                Island, Miller and Miller (1995) also found that invertebrates
invasive mammals on the planet due to their rapid population           were the major component of mouse diet, with Auckland tree
growth rate, varied flexible diet, and close association with          wētā (Hemideina thoracica) being a dominant prey item. In
humans (Murphy & Nathan 2021). Mice are the smallest (mean             alpine habitat in Fiordland, South Island, the diet of mice
weight range 17–26 g) of the four rodent species introduced to         was dominated by wētā, spiders, and grasshoppers (Wilson
New Zealand, arriving after Norway rats (R. norvegicus) and            & Lee 2010).
before ship rats (R. rattus) as stowaways on ships in the early             A few studies have shown that earthworms play a major
1820s. House mice quickly spread, and by the early 1900s               role in the diet of mice, particularly during the winter (Le Roux
occupied most suitable environments throughout the North and           et al. 2002; Jones et al. 2003). In contrast, two studies on sub-
South Islands (Murphy & Nathan 2021). New Zealand has no               Aantarctic islands, such as Marion and Macquarie, concluded
extant native terrestrial mammals except for bats.                     that earthworms are of negligible importance as a food item
     New Zealand studies have shown that mice eat a range              for mice (Gleeson & Van Rensburg 1982; Copson 1986). It is
DOI: https://dx.doi.org/10.20417/nzjecol.46.22
2 New Zealand Journal of Ecology, Vol. 46, No. 1, 2022
important to note that of the above studies, only Le Roux et al. (referred to hereafter as the preferred diet taxa). In addition,
(2002) and Jones et al. (2003) included earthworm chaetae in we investigated the earthworm and land snail communities to
their analysis. Until recently, without chaetae, the importance detect any responses by these little-studied groups. As seeds
of earthworms in animal diets could not be accurately are often an important component of mouse diets (Murphy &
determined, and the importance of soft-bodied prey, such as Nathan 2021), we also studied seedling responses to mice alone.
larvae and earthworms, is likely to have been underestimated We expected that the presence of numerous mice as
in many studies (Jones & Toft 2006). However, novel eDNA predators would reduce the abundance, species richness, and
techniques have the potential to identify invertebrate prey, mean body size of invertebrates, and the density and species
including soft-bodied organisms, from mammalian stomach richness of seedlings. Previous studies have established that
contents or faecal material (Clare et al. 2009). For example, various fungi (e.g. Rhizopogon; Elaphomyces) are components
Watts et al. (2020a) used DNA barcoding to identify a prey of mouse diets (Maser & Maser 1987; Frank et al. 2009);
fragment extracted from a rat stomach as cave wētā (Talitropsis however, these studies were primarily focused on hypogeous
sedilloti; 99% sequence identity). fungi (fungi with underground fruiting bodies e.g. truffles)
Worldwide, as well as in New Zealand, mice in unmanaged not known to be present at Maungatautari. We anticipated that
urban, rural, and wild ecosystems are typically uncommon and mice would eat the mushroom species found at Maungatautari.
inconspicuous when food is scarce and other competing and
predatory mammal species are present. In New Zealand, larger
introduced predatory mammals such as ship rats and Norway Methods
rats, mustelids (stoat Mustela erminea, feral ferret M. putorius,
and weasel M. nivalis) and feral cats (Felis catus) limit mouse Study area
abundance or activity and obscure their impacts (Innes et al. Maungatautari (3239 ha) is a highly eroded andesitic cone
1995; King et al. 1996; Harper & Cabrera 2010; Bridgman (797 m asl) surrounded by farmland, but with a diverse range
et al. 2013; Murphy & Nathan 2021). In contrast, overseas of native forest types remaining above 240 m asl. Rimu
examples show that mice alone on islands or in agricultural (Dacrydium cupressinum)–tawa (Beilschmiedia tawa) is the
crops with abundant food and few or no predators can become dominant forest type of the sites used in this study (Clarkson
abundant and cause substantial damage to biodiversity and et al. 2002).
crop yields (Pech et al. 1999; Jones et al. 2003; Angel & A mammal-resistant fence (Day & MacGibbon 2007)
Cooper 2006). The discovery that mice on Gough Island ate enclosing Maungatautari was completed in 2006, and a
the undefended chicks of large seabirds, including albatrosses sustained operation to eradicate mammals from inside the
(Cuthbert & Hilton 2004), greatly extended understanding fence followed (Speedy et al. 2007). Mice became scarce, but
of their potential impacts. This led, for example, to Angel it is likely that they were never eradicated completely (Wilson
et al. (2009) questioning whether the impacts of mice alone et al. 2018). Further mouse control ceased in February 2012
on islands should be regarded as equivalent to those of rats. and mice have since become abundant (for a detailed timeline,
Mouse populations also increase when they are the only see Table 1 in Wilson et al. 2018).
remaining terrestrial mammals on New Zealand islands Starting in April 2011 we used two independently
(Newman 1994; Russell 2012), or when food supplies become mammal-fenced sites with contrasting mouse densities at
plentiful, such as during mast seeding of beech trees (King Maungatautari (see Fig. 1 in Wilson et al. 2018). Our ‘M block’
1983; Fitzgerald et al. 1996), podocarp trees (Ruscoe et al. is a small (24 ha) part of the fenced 3400 ha Maungatautari
2004), and tussock grasses (Wilson & Lee 2010). Recently, reserve that received ongoing mouse control, and mice
mice have frequently been the only mammal species surviving were undetectable there when this study started. After aerial
in fenced wildlife sanctuaries on the mainland (Burns et al. poison drops in 2004, 2006, and 2008, c. 3200 inked cards
2012), either because they survive eradication attempts or in footprint tracking tunnels baited with peanut butter were
because they subsequently reinvade through fences that exclude placed across Maungatautari (c. 1 hectare−1). Tunnels were
larger mammals. In this situation, as on oceanic islands, mice initially checked monthly, then cards were replaced monthly
can become abundant and may prevent the achievement of but checked after one week. Each time a mouse was detected,
predator-removal objectives and biodiversity restoration goals alternating mouse traps in tracking tunnels and brodifacoum
(Goldwater et al. 2012). bait in bait stations were placed in a 25 × 50 m grid covering
Conservation managers, ecosanctuaries, and community a 200 × 200 m area around the location of the detection. In
groups in New Zealand that are engaging in mammal eradication September 2011, eradication efforts across Maungatautari were
or control where mice are now the only exotic mammal suspended until cost-effective mouse control methods might
present have raised concerns regarding the impacts of mice become available, because monitoring and removal were too
alone on native biodiversity. In response to this concern, we expensive to sustain. However, mouse control continued in
conducted a 5-year study examining the impacts of mice on M block due to our study design requirements.
native biodiversity in a mammal-resistant fenced sanctuary, Our ‘Q block’, approximately 100 m south of M block, is a
Sanctuary Mountain Maungatautari (referred to hereafter as mammal-fenced 17 ha, private forest block covenanted by the
Maungatautari), Waikato, New Zealand. We managed two Queen Elizabeth II National Trust (i.e. an agreement between
independently fenced sites within the sanctuary to achieve QEII Trust and a landowner protects land in perpetuity) and
high mouse numbers (up to 46 per hectare) at one site and separated from the main reserve only by a vehicle track. All
undetectable mouse numbers at the second site (Wilson et al. mammals were removed from Q block by 2008, but mice were
2018). We then reversed these treatments by eradicating mice detected in August 2009 and then became abundant.
from the first site and allowing their numbers to increase at In August 2013, half-way through our study, we switched
the second (Wilson et al. 2018). Here we focus on the impact mouse management treatments (referred to hereafter as the
of mice alone on invertebrates, particularly their common treatment switch) between the two blocks, to experimentally
dietary taxa, including caterpillars, spiders, wētā, and beetles test mouse impacts on indigenous biodiversity. MaungatautariWatts et al.: Impacts of mice alone on biodiversity 3
Ecological Island Trust (a private, non-profit-making registered of tunnels tracked by mice) was calculated for each occasion
charitable Trust established in 2001 to restore and sustain on each block.
Maungatautari) eradicated mice from Q block while mouse
control ceased in M block to allow the population to increase. Invertebrates
As a result, mouse population density in Q block was high Invertebrate sampling protocols and timing are summarised
from April 2011 to August 2013, and low from November in Table 1.
2013 to February 2016. We refer to these block–treatment
combinations as QH and QL, respectively (as in Wilson et al. Sampling the invertebrate community using pitfall traps
2018). In contrast, mouse density in M block was low and then
The ground-dwelling invertebrate fauna was sampled using
higher (ML and MH) on average during the same periods.
pitfall traps, each a 100 mm-deep plastic cup (105 mm diameter)
containing 100 mL of 50% monopropylene glycol. Pitfall traps
Mouse population density and abundance indices (traps
were placed at 5 m intervals along a 45 m transect located
and tracking tunnels)
between two tracking tunnels. Two transects were located
The population density of mice (mice hectare−1) in each study randomly within each study block, giving a total of 20 pitfall
block was estimated every 3 months using spatially explicit traps in each block. Traps were set for 1 month in April in
capture–recapture (Wilson et al. 2018). Relative indices of 2011–2015, and for 3 months over summer (late November
mouse abundance in each block were also estimated every to late February, set and collected each month) from 2011/12
3 months (autumn: April/May; winter: August; spring: to 2015/16. Specimens were preserved in 70% ethanol.
November; summer: February), between April 2011 and Captured invertebrates (≥ 3 mm in length) were sorted
February 2016, using footprint tracking based on established and counted to order level using a binocular microscope. We
protocols (Gillies & Williams 2013). We placed inked cards in focused on caterpillars, spiders, beetles, and wētā as these have
tracking tunnels (24 in Q block and 36 in M block) set in lines been identified previously as dominant prey items in diets of
150 m apart, each with 5–12 tunnels 50 m apart (a different mice (preferred diet taxa) in the presence of other mammals
layout from the standard method because of our small block (see references in Murphy & Nathan 2021). Beetles were sorted
sizes; Wilson et al. 2018). Tunnels were baited with peanut on the basis of external morphology into recognised taxonomic
butter and checked the next morning. Tracking rate (percentage units (RTUs; hereafter referred to as species, see Appendix
Table 1. Summary of methods used to sample invertebrates, seedlings and fungi in the study blocks M and Q at Sanctuary
Mountain Maungatuatari between April 2011–February 2016.
__________________________________________________________________________________________________________________________________________________________________
Target Group Sampling method Number of traps/samples Duration of sampling Frequency of collection
__________________________________________________________________________________________________________________________________________________________________
Ground-dwelling Pitfall trap 20 traps in each block April 2011–2015 Annually
invertebrate (10 traps located 5 m apart Summer 2011/12–2015/16 (1 month in April; late
community along a 45 m transect × 2) Nov–late Feb, collected
monthly)
__________________________________________________________________________________________________________________________________________________________________
Leaf-litter invertebrate Leaf-litter sample 32 sampling points in each April 2011–2015 Annually
community (33 cm diameter circular block
frame (0.086 m2))
__________________________________________________________________________________________________________________________________________________________________
Land snails Extracted via Tullgren 32 sampling points in each April 2011 and 2012 Twice
funnel from leaf-litter block
samples
__________________________________________________________________________________________________________________________________________________________________
Wētā Tracking tunnels 24 tracking tunnels in Q April 2011–February 2016 Every 3 months in Autumn
block; 36 tracking tunnels (April/May), Winter
in M block (August), Spring
(November) and Summer
(February)
__________________________________________________________________________________________________________________________________________________________________
Earthworms Searching leaf-litter 20 sampling points in each November 2013 and 2015 Twice
and soil (depth of 10cm) block
from 50 × 50 cm quadrats
(0.25 m2)
__________________________________________________________________________________________________________________________________________________________________
Seedlings Counted seedlings in 36 sampling points in each April 2011, April 2013 and Three times
(cotyledonary, circular 0.75 m2 plots block June 2016
mixed-leaf and true-
leaf seedlings)
__________________________________________________________________________________________________________________________________________________________________
Fungi
Offered mice six known One 48 hours in July 2011 Once
edible and other
mushrooms at cafeteria
and filmed with cameras
Fungal DNA from
mouse faecal pellets 54 faecal pellets examined August 2011 and February Once
2012
__________________________________________________________________________________________________________________________________________________________________4 New Zealand Journal of Ecology, Vol. 46, No. 1, 2022
S1 in Supplementary Materials) and, where possible, given plots, each 0.75 m2, placed systematically along transects in
generic and species-level identifications by Stephen Thorpe each of Q and M blocks in April 2011 (QH; ML), April 2013
(independent researcher, Auckland). Each beetle captured (QH; ML), and June 2016 (QL; MH). Plots were placed 5 m
was measured, and then mean beetle body length (mm) per from tracking tunnels, on alternating sides perpendicular to
trap was calculated. Wētā size was calculated by measuring each line of tunnels. In Q block, 12 additional plots were placed
the width of the pronotum (mm), and then a mean per trap opposite other plots to achieve 36 plots in each block. Total
was calculated. density of all seedlings (number metre−2), total seedling species
richness, and densities of cotyledonary, true-leaf and mixed-
Sampling the leaf-litter invertebrate community leaf seedlings were then calculated by species and size class.
Litter-dwelling invertebrates were collected from leaf-litter
samples, each within a 33 cm diameter circular frame (0.086 Sampling fungi
m2) at 32 sampling points in each block. Sampling points were Fungi sampling protocols are summarised in Table 1. Fruiting
chosen using a random compass bearing and distance (< 5 bodies of six known human-edible and other mushrooms
m) from each tracking tunnel. Eight extra litter samples (two were translocated from ML to QH and placed at a cafeteria
from each line of tunnels) were collected from the Q block to site at ground level. Video cameras were set up for a period
achieve 32 samples from each block. Each April, from 2011 of approximately 48 hr in July 2011 to observe if mice, when
to 2015, eight litter samples were taken weekly from each presented with a choice of mushrooms, would consume certain
block (32 samples per block). At collection, all leaf litter and species preferentially.
friable humus were scraped rapidly from the frame, placed In a second approach, mouse faecal pellets were collected
in individual bags and transported back to the laboratory. during trapping operations in August 2011 and in February
Invertebrates were extracted from the leaf litter over a 72 hr 2012. The pellets from August were analysed using molecular
period using Tullgren funnels (Moeed & Meads 1986). methods, and the pellets from February were analysed using
Preservation, sorting, counting and identification of both microscopy and molecular methods. DNA was extracted
invertebrates from the leaf litter followed the same protocols from pellets surface-cleansed with 70% ethanol. The internal
as used for the pitfall-trapped invertebrates. Litter weight was transcribed spacer region (ITS) was amplified using the
recorded per sample. fungal and Basidiomycota-specific primers ITS, 1F, and ITS
4B (Gardes & Bruns 1993), since the fungi most likely to be
Sampling land snails consumed by mice are larger Basidiomycota.
After the 72 hr Tullgren funnel extraction described above, Seventeen faecal pellets were examined microscopically.
land snails were extracted manually from the litter samples in Fungal tissues are mostly digested, leaving only spores in the
April 2011 (QH; ML) and 2012 (QH; ML) from both blocks. faecal matter (Castellano et al. 1989).
Sampling wētā with tracking tunnels Data analysis
Tracking tunnels used to monitor mice (described above) were Pitfall trap invertebrate community data
also used to record the footprints of invertebrates. Each tracking A linear mixed model (LMM) with smoothing splines over
card was examined for the presence of wētā footprints, which time, fitted using Residual Maximum Likelihood, was used
are readily recognisable. Protarsal, mesotarsal, and metatarsal to model the temporal trends in the pitfall trap invertebrate
prints longer than 2.5, 3.5, and 4.4 mm, respectively, indicate data for each study block (Q and M) and the covariance
the presence of adult Auckland tree wētā (H. thoracica; Watts structure of the repeated measurements. The random and
et al. 2011). Smaller wētā, including subadult and juvenile fixed effects of the LMM are described in Table 2. Mouse
Auckland tree wētā, all age classes of ground wētā (Hemiandrus density was not used as a predictor in our statistical models
species), and all age classes of cave wētā (Rhaphidophoridae because dates of mouse and invertebrate sampling sessions
species) were recorded as ‘other wētā’. differed, mouse density could be estimated only for capture
sessions when >1 mice were caught (Wilson et al. 2018), and
Sampling earthworms lags were expected between mouse density and its effects on
In November 2013 (QL; MH; 3 months after treatment switch) invertebrate populations.
and 2015 (QL; MH) a headlamp was used to search leaf litter Differences in the temporal trends between the two study
and then soil to a depth of 10 cm from within twenty 50 × blocks were examined by plotting 83% confidence intervals
50 cm quadrats (0.25 m2) in each of the Q and M blocks. To around the predicted mean values. Non-overlapping 83%
avoid potential trampling effects, each sampling point was confidence intervals indicate differences between the study
located 10 m west of a randomly selected tracking tunnel in blocks at the 5% significance level (Krzywinski & Altman
2013, and 10 m east of a tunnel in 2015. Earthworms were 2013). The total number of invertebrates caught (per trap),
immediately placed into labelled vials containing 70% ethanol; the number of preferred diet taxa invertebrates caught, the
later they were dabbed dry and individuals weighed to the number of beetle species caught, the mean beetle length, and
nearest milligram. Identification to RTU was completed using the mean wētā size were analysed as response variables. The
a binocular microscope and the keys of Lee (1959) and Sims number of spiders, beetles, wētā caught were also separately
& Gerard (1985). analysed, but the caterpillar count data were too sparse to
analyse separately. Residual diagnostic plots were inspected
Sampling seedlings for evidence of departures from the assumptions of normality
Seedling sampling protocols and timings are summarised in and homogeneity of variance. All count data were square-root
Table 1. We counted cotyledonary seedlings (i.e. with their first transformed prior to analysis to stabilise the variance.
leaf), true-leaf seedlings (< 15 cm tall) and mixed-leaf (both To assess the variation in beetle species composition
cotyledons and true leaves combined) seedlings in 36 circular and abundance between samples collected from the M andWatts et al.: Impacts of mice alone on biodiversity 5
Table 2. The random and fixed effects of the linear mixed models with smoothing splines over time used to model the
temporal trends and the covariance structure of the repeated measurements, for a) pitfall trap invertebrate community data,
b) leaf-litter invertebrate community data, and c) wētā tunnel tracking data.
__________________________________________________________________________________________________________________________________________________________________
Data Random effects Fixed effects
__________________________________________________________________________________________________________________________________________________________________
Pitfall trap invertebrate Temporal splines: overall, study block, transect and pitfall trap Covariates: time, number of trap
community Correlated random coefficients: pitfall trap plus pitfall trap nights
by time Fixed factor: study block
Random factors: transect, month Interaction: study block by time
Leaf-litter invertebrate
Temporal splines: overall, study block, transect and plot Covariates: time, weight of litter
community
Correlated random coefficients: plots plus plots by time sampled
Random factor: transect Fixed factor: study block
Interaction: study block by time
Wētā tunnel tracking Temporal splines: overall, study block and transect Covariates: time
Correlated random coefficients: transect plus transect by time Fixed factor: study block
Random factor: season Interaction: study block by time
__________________________________________________________________________________________________________________________________________________________________
Q blocks over the study, classification cluster analysis and were included to take account of the sampling structure. In
ordination techniques were performed within the PATN addition, a random intercept for sampling date and a sampling
multivariate analysis package (Belbin 1995). Species with only date by plot spline were included to account for additional
one specimen in the dataset were omitted from the analysis. temporal variability. Residual diagnostic plots were inspected
The procedures FUSE (agglomerative hierarchical fusion) for evidence of departures from the assumptions of normality
and SSH (semi-strong hybrid multidimensional scaling) were and homogeneity of variance. The number of snails collected
implemented. Furthermore, a flexible unweighted pair-group per plot was natural log + 1 transformed prior to analysis to
method using UPGMA clustering (with β = −0.1), where equal stabilise the variance, and back-transformed means and exact
weight is given to objects, not groups, and the Bray-Curtis back-transformed 95% confidence intervals were calculated.
association measure, which consistently performed well in data The significance of the study block by year interaction was
testing (Faith et al. 1987), were selected. A two-dimensional assessed using an F-test, and Fisher’s unprotected least significant
ordination with a stress value of 0.1867 was considered to differences at the 5% level were used to compare means.
summarise the data suitably (see Belbin 1995).
Earthworms
Leaf-litter invertebrate community data LMMs were used to assess the effects of study block, year
Similar to the analysis of the pitfall data, an LMM with (2013 and 2015), and their interaction on the mean abundance,
smoothing splines was used to model the litter invertebrate biomass (g), and species richness of earthworms collected within
data over time (Table 2). The total number of litter-dwelling the transect plots. Random terms for transect within block
invertebrates found per transect plot, the number of litter- and plot within transect were included to take account of the
dwelling spiders, beetles, caterpillars, and beetle species found sampling structure. Residual diagnostic plots were inspected for
per transect plot, and the mean beetle length of litter-dwelling evidence of departures from the assumptions of normality and
invertebrates found per transect plot were analysed. The wētā homogeneity of variance. To normalise the data, the variables
count data were too sparse to analyse separately. Residual (abundance, biomass, and species richness) were natural log
diagnostic plots were inspected for evidence of departures from transformed prior to analysis. Due to the presence of zeroes,
the assumptions of normality and homogeneity of variance. half the minimum non-zero value were added prior to logging.
Transformations were not needed. Back-transformed means and exact back-transformed 95%
confidence intervals were obtained. The significance of the
Wētā tunnel tracking data study block by year interaction was assessed using an F-test,
At each sampling time, the proportion of tunnels on a transect and Fisher’s unprotected least significant differences at the 5%
tracked by (1) adult Auckland tree wētā and (2) other wētā level were used to compare means.
was calculated. Similar to the analysis of the pitfall data, an
LMM with smoothing splines was used to model the tracking Seedlings
tunnel data over time (Table 2). Residual diagnostic plots were LMMs were used to assess the effects of study block, year (2011,
inspected for evidence of departures from the assumptions 2013 and 2016) and their interaction on the mean litter depth
of normality and homogeneity of variance. Transformations (cm), total density of all seedlings (number m−2), total seedling
were not needed. species richness, and densities of cotyledonary, mixed-leaf,
and true-leaf seedlings. The analysis was the same as for the
Land snails earthworm data except that we also included a power model of
LMMs were used to assess the effects of study block, year order one in the seedling LMMs to accommodate correlations
(2011 and 2012), and their interaction, on the number of snails between measurements taken on the same transect plot over
collected and the number of unique snail species found (i.e. the 3 years.
species richness) in the litter samples. Random terms for All statistical analyses were performed using Genstat version
transect nested within block and plot nested within transect 19 (VSN International 2017).6 New Zealand Journal of Ecology, Vol. 46, No. 1, 2022
Results observed for the total number of invertebrates caught, the
number of spiders, beetles, and wētā caught, and the number
Mouse population density and footprint tracking indices of beetle species caught in pitfall traps (Appendices S2–S7).
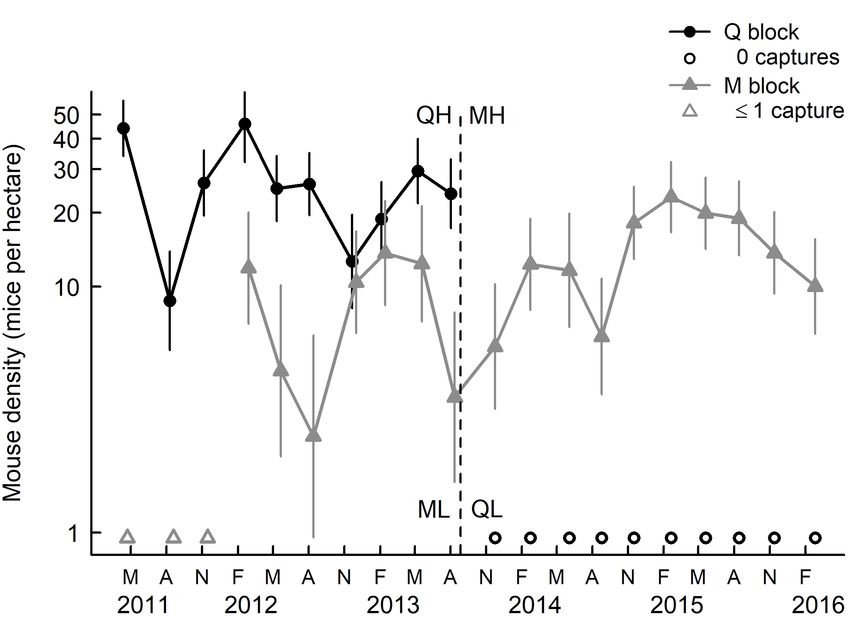
Mouse density fluctuated seasonally in both blocks, with On average, beetles with significantly shorter body length
relatively high summer or autumn densities following mouse were caught in pitfall traps at QH compared with ML, and
reproduction in spring and summer (Fig. 1). In QH, density was there was some evidence that the mean length of beetles caught
9–46 mice per hectare until mice were eradicated in August was longer in QL than in MH (Fig. 2b). A similar pattern was
2013. In ML, density was apparently zero until summer 2012, observed for mean wētā pronotum width (Appendix S7).
when the first mouse was caught there; in MH, density then The FUSE classification analysis and SSH ordination
increased to 6–23 per hectare. indicated a clear separation of four beetle coummunity groups
The percentage of tunnels with mouse tracks was positively associated with different mouse density treatments in Q and M
related to mouse density in the corresponding block and capture blocks (Fig. 3). Beetles collected from all pitfall trap transects in
session. Density could be estimated only for capture sessions low mouse density treatments (ML and QL) had similar species
where > 1 mice were caught; at these times tracking rates assemblages (Group I; Fig. 3). The transects in the summer
ranged from 8–92% in M block and 67–100% in Q block. In immediately after the treatment switch (December 2013–April
other sessions, where 0 or 1 mice were caught and density 2014) were distinct (Group II; Fig. 3), and transects in high
was not estimated, tracking rates were 0–11%. mouse density treatments (QH and MH) formed another group
Further details of mouse population density estimates (mice (Group III; Fig. 3). Finally, one transect (February 2016) in Q
per hectare) and abundance indices based on the percentage of block at low mouse density formed Group IV (Fig. 3), which
tunnels with footprints for each block throughout the 5-year was characterised by very high beetle abundance.
study are given in Wilson et al. (2018).
Leaf-litter invertebrate community
In total, 10 719 invertebrates were sampled from the leaf
Invertebrates litter during the study. The mean number of preferred diet
taxa leaf-litter invertebrates was lower in QH than in ML
Invertebrate community assessed with pitfall traps (Fig. 4a). Following the treatment switch there was strong
statistical evidence that the mean number of preferred diet
A total of 42 639 invertebrates were caught in pitfall traps taxa leaf-litter invertebrates was higher in QL than in MH
during the study. There was strong statistical evidence that, on (Fig. 4a). A similar pattern was observed for the total number
mean, the number of preferred diet taxa caught in pitfall traps of invertebrates caught, the number of beetles, caterpillars and
was lower in QH than in ML (Fig. 2a). In contrast, following spiders caught, and the number of beetle species sampled from
the treatment switch, there was strong statistical evidence that the leaf litter (Appendix S8–S12).
the mean number of preferred diet taxa caught in pitfall traps On average, beetles with significantly shorter body length
was higher in QL than in MH (Fig. 2a). A similar pattern was were found in the leaf litter in QH compared with ML. In QL
and MH there was no evidence of a difference in beetle lengths
between the two study blocks approximately 4 months after
the treatment switch (Fig. 4b).
Tracking rates of wētā in tunnels
During the first 2 years of the study (April 2011–July 2013),
mean tracking rates of adult Auckland tree wētā were
significantly higher in ML (range of predicted means: 36–51%)
compared with QH (9–23%; Fig. 5a). In the year after the
treatment switch, mean tracking rates of adult Auckland
tree wētā were similar in the two blocks. After August 2014,
mean tracking rates of adult Auckland tree wētā significantly
increased to more than 47% in QL, while in MH the predicted
the mean tracking rates was always < 30% (Fig. 5a).
Before the treatment switch, mean tracking rates of other
wētā were significantly higher in ML compared with tracking
rates in QH (Fig. 5b). Between August 2013 and February
2015 the mean tracking rates of other wētā in the two blocks
were similar. After February 2015, mean tracking rates of other
Figure 1. Estimated house mouse population density in Q and M
blocks within Sanctuary Mountain Maungatautari. Vertical lines
wētā were significantly higher in QL than in MH (Fig. 5b).
show 95% confidence intervals. Open symbols show trapping
sessions when density could not be estimated; i.e. when ≤ 1 mice Land snails
were captured in M block (triangles) early in the study, and when At both blocks, the number of snail species caught per leaf-
0 mice were captured in Q block (circles) after eradication. Timing litter sample decreased from 2011 to 2012 (Table 3), but there
of the treatment switch in August 2013 is shown with a dashed is no statistical evidence that this decline differed between ML
vertical line. Density is plotted on a logarithmic scale. QH, QL, and QH (F1,63.3 = 2.88; P = 0.095). Furthermore, there is no
MH, and ML indicate block–phase combinations; i.e. mouse
density treatments (High, Low) that switched between blocks
statistical evidence of any differences in the mean abundance
(Q, M) at or around August 2013. Reproduced with permission of snails collected from leaf litter samples between years or
from Wilson et al. (2018). between study blocks (Table 3).Watts et al.: Impacts of mice alone on biodiversity 7
Figure 2. Predicted mean number of a) preferred diet taxa
invertebrates and b) mean body length (mm) of beetles
caught per pitfall trap at study blocks M (grey solid line) and
Q (black solid line) at Sanctuary Mountain Maungatautari.
The dashed lines represent 83% confidence intervals around
the predicted values. Non-overlapping 83% confidence
intervals indicate differences between the study blocks
at the 5% significance level. Observed data for block M
are plotted with grey crosses and for block Q with black
circles. The vertical dashed line denotes the ‘treatment
switch’, where mice were eradicated from Q block and
mouse control ceased in M block. The observed data have
been jittered, by adding a small amount of random noise,
to prevent overplotting.
Figure 3. Distribution of beetle taxa caught in pitfall
traps in Q and M blocks at Sanctuary Mountain
Maungatautari, defined by two-dimensional SSH
ordination analyses. See Appendix S1 for beetle
species (RTUs). Four groupings with similar
beetle species composition identified by the FUSE
clustering analysis have been superimposed as hand-
drawn polygons around plots: Group I = transects in
low mouse density treatments (QL and ML); Group
II = transects in the summer (December 2013–April
2014) immediately after the treatment switch; Group
III = transects in high mouse density treatments (QH
and MH); Group IV = one transect (Feb 2016) in
Q block at low mouse density. Circles = Q block,
squares = M block. Open symbols = transects in
low mouse density treatments, grey symbols =
transects in the summer (December 2013–April
2014) immediately following the treatment switch,
black symbols = transects in high mouse density
treatments.8 New Zealand Journal of Ecology, Vol. 46, No. 1, 2022
Figure 4. Predicted mean number of a) preferred diet
taxa leaf-litter invertebrates and b) mean body length
(mm) of litter-dwelling beetles collected per plot at
study block M (grey solid line) and Q (black solid line)
at Sanctuary Mountain Maungatautari. The dashed
lines represent 83% confidence intervals around the
predicted values. Non-overlapping 83% confidence
intervals indicate differences between the study blocks
at the 5% significance level. Observed data for block
M are plotted with grey crosses and for block Q with
black circles. The vertical dashed line denotes the
‘treatment switch’ where mice were eradicated from
Q block and mouse control ceased in M block. The
observed data have been jittered, by adding a small
amount of random noise, to prevent overplotting.
Table 3. Means and 95% confidence intervals for the number of snails collected and the number of unique snail species
found in litter samples at study blocks M and Q in 2011 and 2012. For each variable, means without a letter in common are
statistically different at the 5% level.
__________________________________________________________________________________________________________________________________________________________________
Year Block–treatment combination Number of species Abundance*
Mean 95% CI Mean 95% CI
__________________________________________________________________________________________________________________________________________________________________
2011 ML 15.6 c (12.60, 18.66) 35.3 a (17.23, 71.47)
QH 11.1 b (8.07, 14.22) 24.6 a (11.79, 50.30)
__________________________________________________________________________________________________________________________________________________________________
2012 ML 7.2 ab (4.13, 10.20) 15.4 a (7.20, 31.63)
QH 5.5 a (2.40, 8.52) 10.3 a (4.66, 21.59)
__________________________________________________________________________________________________________________________________________________________________
* The means and 95% confidence intervals are back-transformed from the ln+1 scale.
Earthworms in Q block from 2013 to 2015 (QL) with a decreasing mouse
There was strong statistical evidence of an interaction between population, but there was no evidence of a change over time
study block and year on the mean log-transformed abundance at M block (Table 4).
(F1,70.8 = 9.82; P = 0.003), biomass (F1,70.9 = 7.92; P = 0.006)
and species richness (F1,71.3 = 7.53; P = 0.008) of earthworms Seedlings
collected, indicating that earthworm populations at the two There was weak statistical evidence of an interaction between
study blocks responded differently over time. The mean number study block and year on the mean log-transformed density of
of earthworms, biomass, and species richness per plot increased seedlings (number m−2; F2,92.5 = 2.82; P = 0.065). In Q block,Watts et al.: Impacts of mice alone on biodiversity 9
Figure 5. Predicted proportion of tunnels on each
transect tracked by a) adult Auckland tree wētā and
b) other wētā at study block M (grey solid line) and Q
(black solid line) at Sanctuary Mountain Maungatautari.
The dashed lines represent 83% confidence intervals
around the predicted values. Non-overlapping 83%
confidence intervals indicate differences between the
study blocks at the 5% significance level. Observed
data for block M are plotted with grey crosses and
for block Q with black circles. The vertical dashed
line denotes the ‘treatment switch’, where mice were
eradicated from Q block and mouse control ceased
in M block. The observed data have been jittered, by
adding a small amount of random noise, to prevent
overplotting.
Table 4. Back-transformed means and exact back-transformed 95% confidence intervals for the number, total weight (g)
and number of unique recognised taxonomic units of earthworms collected per plot at study blocks M and Q in 2013 (3
months after treatment switch) and 2015. For each variable, means without a letter in common are statistically different at
the 5% level.
__________________________________________________________________________________________________________________________________________________________________
Year Block–treatment Abundance Biomass (g) Species richness
combination Mean 95% CI Mean 95% CI Mean 95% CI
__________________________________________________________________________________________________________________________________________________________________
2013 MH 1.1 b (0.51, 2.09) 0.13 b (0.041, 0.380) 0.68 b (0.363, 1.117)
QL 0.3 a (−0.02, 0.75) 0.01 a (−0.001, 0.044) 0.19 a (0.005, 0.445)
__________________________________________________________________________________________________________________________________________________________________
2015 MH 1.4 bc (0.66, 2.50) 0.17 b (0.054, 0.487) 0.99 bc (0.586, 1.536)
QL 2.9 c (1.64, 5.01) 0.31 b (0.103, 0.883) 1.40 c (0.885, 2.098)
__________________________________________________________________________________________________________________________________________________________________
the density of seedlings was higher in 2016 (QL) than in 2011 study blocks cotyledonary seedling density decreased from
(QH) and 2013 (Table 5). Conversely, there was no evidence 2011 to 2013 and then increased from 2013 to 2016 (Table
of any differences in M block. For both mean litter depth and 6). However, these changes were greater for Q block, where
log-transformed species richness, there was no statistical the mouse population increased between 2011 and 2013 and
evidence of an interaction between study block and year (F2,116.5 decreased between 2013 and 2016.
= 1.26; P = 0.288, F2,95.8 = 0.54; P = 0.584, respectively), nor The mean log-transformed density of mixed-leaf seedlings
was there any statistical evidence that these means differed per plot exhibited a similar pattern over time to cotyledonary
over time at either study block (Table 5). seedlings (Table 6). However, there was no evidence that the
There was strong statistical evidence of an interaction density of mixed-leaf seedlings in Q and M blocks responded
between study block and year on the mean log-transformed differently over time (the interaction between study block and
density of cotyledonary seedlings per plot (F2,96.0 = 4.10; year was not statistically significant; F2,136.9 = 1.83; P = 0.164).
P = 0.020), indicating that cotyledonary seedling densities At both Q and M blocks the mean log-transformed density
on Q and M blocks responded differently over time. In both of true-leaf seedlings was lower in 2016 than in 2011 and10 New Zealand Journal of Ecology, Vol. 46, No. 1, 2022
Table 5. Means and 95% confidence intervals for the total density of all seedlings (number per m2), mean litter depth (cm),
and total seedling species richness per transect plot at study blocks M and Q in 2011, 2013 and 2016. For each variable,
means without a letter in common are statistically different at the 5% level.
__________________________________________________________________________________________________________________________________________________________________
Year Block–treatment Total density* Mean leaf litter Species richness*
combination Mean 95% CI Mean 95% CI Mean 95% CI
__________________________________________________________________________________________________________________________________________________________________
2011 ML 7.6 ab (4.98, 11.32) 3.5 ab (2.65, 4.30) 3.1 ab (2.38, 3.88)
QH 13.4 b (9.00, 19.91) 3.2 ab (2.39, 4.03) 3.9 ab (3.09, 4.94)
__________________________________________________________________________________________________________________________________________________________________
2013 ML 5.7 a (3.72, 8.61) 3.1 ab (2.32, 3.94) 2.8 a (2.17, 3.56)
QH 8.1 ab (5.36, 12.17) 2.9 ab (2.08, 3.71) 3.7 ab (2.90, 4.68)
__________________________________________________________________________________________________________________________________________________________________
2016 MH 7.5 ab (4.96, 11.29) 3.6 b (2.90, 4.27) 3.0 a (2.30, 3.76)
QL 20.9 c (13.87, 31.40) 2.4 a (1.73, 3.16) 4.5 b (3.54, 5.75)
__________________________________________________________________________________________________________________________________________________________________
*The means and 95% confidence intervals are back-transformed from the ln + 0.5 scale.
Table 6. Back-transformed means and exact back-transformed 95% confidence intervals for the densities of cotyledonary,
mixed-leaf and true-leaf seedlings per transect plot at study blocks M and Q in 2011, 2013 and 2016. For each variable,
means without a letter in common are statistically different at the 5% level.
__________________________________________________________________________________________________________________________________________________________________
Year Block–treatment Cotyledonary Mixed-leaf True-leaf
combination Mean 95% CI Mean 95% CI Mean 95% CI
__________________________________________________________________________________________________________________________________________________________________
2011 ML 1.03 b (0.653, 1.528) 0.97 bc (0.469, 1.739) 4.48 b (2.873, 6.843)
QH 3.15 c (2.257, 4.340) 2.68 cd (1.592, 4.323) 4.70 b (3.031, 7.154)
__________________________________________________________________________________________________________________________________________________________________
2013 ML 0.50 a (0.255, 0.827) 0.12 a (0.000, 0.442) 5.11 b (3.300, 7.772)
QH 0.62 ab (0.343, 0.998) 0.27 ab (0.005, 0.675) 6.67 b (4.357, 10.096)
__________________________________________________________________________________________________________________________________________________________________
2016 MH 2.54 c (1.791, 3.530) 3.50 de (2.128, 5.573) 0.93 a (0.468, 1.606)
QL 6.44 d (4.602, 8.945) 8.04 e (5.016, 12.717) 1.70 a (0.979, 2.783)
__________________________________________________________________________________________________________________________________________________________________
2013. However, there was no evidence that the density of Discussion
true-leaf seedlings at two study blocks responded differently
over time (the interaction between study block and year was Impacts of mice on biodiversity
not statistically significant; F2,134.3 = 1.31; P = 0.272). As expected, our data provide strong evidence that mice may
reduce ground-dwelling invertebrate abundance, particularly
Fungi preferred diet taxa such as wētā. The treatment switch between
No mice were filmed visiting fruiting bodies of known edible the two study blocks confirmed this inference. In addition, the
and other mushrooms in the 48 hr during which they were number, biomass, and species richness of earthworms increased
presented. in Q block from 2013 to 2015 (QL) with a decreasing mouse
Fungal DNA was amplified successfully from 14 of 54 population, but did not change over time at M block.
examined faecal pellets, but good-quality DNA sequence There are three important contextual perspectives when
data were obtained from only three of these. When the DNA considering mouse impacts measured in this project. First, the
sequence data were compared with the data from GenBank indigenous biota we examined at Maungatautari have already
(a repository of DNA sequences) via BLAST searches, survived c. 750 years of rodent predation and at least 150
the sequences were found to correspond to species from years of impacts of other introduced mammals. Kiore (Rattus
Polyporaceae (bracket fungi) or corticioid fungi (crust fungi). exulans) would have done the most damage to New Zealand
None of the sequences corresponded to fleshy mushrooms. invertebrates, being the first and smallest (mean weights
Several kinds of fungal spores were observed in 12 of 70–130 g at different locations; King & Forsyth 2021) rat to be
17 pellets examined microscopically, but most were in small introduced (c. 1280 ad; Wilmshurst et al. 2008). Therefore, in
numbers. These were typical of fleshy fungi, bracket fungi, this comparatively brief research project we looked for rapid
and arbuscular mycorrhizal fungi. Several spores from plant responses from the relatively resilient fauna that has already
pathogens, including rusts and hyphomycetes, were also survived for centuries in the presence of mammalian predators
observed. (Gibbs 2010). Second, the impacts of mice on invertebrates and
birds at Maungatautari are likely to be small compared with
the combined impacts of the larger mammalian predators and
browsers/tramplers, such as stoats, ship rats and Norway rats,
brushtail possums, hedgehogs (Erinaceus europaeus), feral
cats, feral goats (Capra hircus), red deer (Cervus elaphus),Watts et al.: Impacts of mice alone on biodiversity 11
and pigs (Sus scrofa; King 2005) that have been removed Our ordination analyses showed that pitfall-trapped beetle
successfully. Abundant mice may be more damaging to lizards community composition could be separated into three groups,
that routinely use small crevices as refuges, because the smaller associated with high and low mouse density treatments and
mice can access spaces unavailable to larger rodents, mustelids the period immediately following the treatment switch. In
and cats (Tingley et al. 2013; Norbury et al. 2014). Third, if another fenced New Zealand sanctuary, Zealandia, Watts
mice can also be eradicated, and extirpated bird and lizard et al. (2014) found that there were winners and losers in the
fauna can be at least partially restored by translocation, then beetle community after mammal eradication, with larger
there may be even greater predation pressure on invertebrates taxa benefiting from mammal eradication. More recently at
from these native predators (Sinclair et al. 2005; Watts et al. Maungatautari, Watts et al. (2020b) found that beetle taxa with
2014). The primary objective of restoration in New Zealand a roaming predatory lifestyle may be particularly vulnerable
sanctuaries is to restore pre-human ecological interactions to mammal predation. In the present study, a fourth group on
and processes (Lee et al. 2005) as much as possible, and not the ordination consisted of one outlying plot (February 2016)
to increase the abundances of all taxa. collected from Q block at low mouse density. This plot had
In New Zealand, invertebrates, particularly litter-dwelling very high beetle abundance (more than twice as many as any
caterpillars, beetles, spiders, and ground wētā, are often present other plot), mainly Saphobius inflatipes (Scarabaeidae) and
in the diet of mice in a wide range of habitats, implying that Sepedophilus spp. (Staphylinidae). The reason for this increase
these are significant food items (see Murphy & Nathan 2021). in numbers is unknown.
Studies have estimated that the proportion of the total biomass Our finding of higher tracking rates of adult Auckland
of invertebrates (excluding earthworms, which potentially have tree wētā and other wētā in low mouse density treatments
not been effectively surveyed) harvested daily by mice ranges may indicate that wētā populations responded to reduced
from 0.7% to 2.9% (Rowe-Rowe et al. 1989; Crafford 1990; predation (e.g. Krebs et al. 1995; Banks et al. 1998; Banks
van Aarde et al. 1996). A more recent estimate by Innes et al. 2000) and/or competition (Caut et al. 2007; Trewby et al.
(2010) suggests that in the presence of other mammals, mice at 2008; Ruscoe et al. 2011) by mice. Wētā are not only within
typical low density (i.e. < 6 ha−1, Wilson et al. 2018) consume the preferred prey size range of mice but are also mobile and
c. 9 g of invertebrates per hectare per night in North Island may be particularly attractive to mice because their movements
podocarp–broadleaved forest. The amount consumed by mice are readily detectable. The increase in wētā tracking rates
alone at high densities is likely to be higher. Therefore, it is not occurred relatively rapidly (i.e. adult Auckland tree wētā within
surprising that studies in New Zealand have implicated mice 12 months and other wētā within 14 months) after mouse
in the decline of invertebrate populations (Bull 1967; Ramsay eradication from the Q block. Watts et al. (2011) also observed
1978; Brignall-Theyer 1998). For example, mouse predation dramatic increases in wētā pitfall captures, wētā tracking rates,
has been cited as the most likely cause of the extinction of and the density of wētā footprints per tracking card within 2
two insect species, a predatory carabid beetle (Loxomerus years after mammals were initially eradicated from a 61 ha
sp.) and an unidentified wētā species, on Antipodes Island fenced exclosure on Maungatautari. This increase may reflect
(Marris 2000). changes in wētā abundance following mammal eradication, but
There have been few studies examining the impact of mice could also be a result of behaviour changes. For example, four
on invertebrate communities in New Zealand, particularly years after kiore were eradicated from Nukuwaiata (Chetwode
in forest ecosystems. One exception is a survey on Allports Islands), Wellington tree wētā (Hemideina crassidens) spent
Island, which found that of the invertebrate species commonly more time on the ground (Rufaut & Gibbs 2003). Watts et al.
found in pitfall traps, eight were caught in significantly larger (2020b) analysed another four summers of wētā response data
numbers on the island after mice were eradicated in 1989 (M. from Maungatautari and found that when most mammals were
Fitzgerald, pers. comm.; data also mentioned in Murphy & eradicated and mice were controlled to low numbers, wētā
Nathan 2021). In addition, a staphylinid beetle not caught on abundance was similar within the 61 ha fenced exclosure and
the island in 1986 was abundant by 1997/1998. outside the exclosure but inside the main sanctuary fence.
More studies have been carried out in coastal lowland However, wētā numbers declined in the following 2 years
vegetation of the sub-Antarctic islands. For example, a outside that exclosure as mouse abundance increased (Watts
comparison of invertebrates on islands with and without mice in et al. 2020b).
the South Indian Ocean suggested that predation by mice caused We observed no significant changes in earthworm biomass,
a reduction in the mean body size of medium- to large-sized abundance, and diversity in M block. In contrast, in Q block,
invertebrate taxa, significant negative effects on populations which started with high numbers of mice, earthworm biomass,
of some invertebrate species, and disruption of the mating abundance, and diversity increased once mouse density was
strategies of weevils (Crafford & Scholtz 1987; Crafford 1990; reduced after the treatment switch, suggesting that earthworm
Chown & Smith 1993). In New Zealand, evidence suggests that populations were in the early stages of recovery after years
mice on the Antipodes Islands had a markedly harmful effect of sustained mouse predation. A further unexpected and
on the diversity and abundance of the invertebrate fauna, with unwelcome observation in Q block was the apparently faster
two species apparently exterminated by mouse predation and recovery of invasive earthworm species (e.g. Octolasium
at least two others on the brink of extinction (Marris 2000). cyaneum and Eisenia japonica) populations in both abundance
In contrast, mouse-free exclosures on Marion Island did not and biomass, when compared to native species (e.g. Deinodrilus
reveal effects of mice on any of eight invertebrate prey groups’ agilis and Megascolides raglani) populations. However,
abundance or biomass, nor on community structure (diversity this result was not statistically tested and requires further
and composition; van Aarde et al. 2004). Despite these studies investigation.
being in differing ecosystem types, collectively they show that We did not detect a significant impact of mice on land
at some locations mice may limit invertebrates, either directly snails, seedlings or fungi at Maungatautari, although all are
by predation, or indirectly by competition for food such as likely to be minor diet items, and the faecal pellets examined
seeds, fruits, and other invertebrates. for fungi were not collected at the time of key autumn fruiting.You can also read