Discovering Lemur Diversity - Produced in collaboration with the Duke Lemur Center - miniPCR
←
→
Page content transcription
If your browser does not render page correctly, please read the page content below
Conservation Genetics Lab

Discovering
Lemur
Diversity
Produced in collaboration
with the Duke Lemur Center

miniPCR bio Learning LabTM         Version: 1.0
Conservation Genetics Lab          Release: April 2021
Instructor’s and Student’s Guide   © 2021 by miniPCR bio™
Instructor’s Guide

                                        Contents

                     Getting started
                               At a glance									P.03
                               Materials needed								P.04
                               Lab setup									P.06

                     Student’s guide
                               Background and significance                                               P.09
                               Today’s lab									P.13
                               Laboratory guide								P.20
                               Study questions								P.23
                               Lemur data cards								P.31
                               Extension: Using DNA squence data to identify species 			                 P.34
                               Extension: Using ecological data to evaluate the health of species        P.44
                               Extension: Research at Tsinjoarivo 						P.54

                     Instructor’s guide
                               Expected results 								P.58
                               Notes on lab design								P.60
                               Differentiation									P.62
                               Additional student supports							P.63
                               Extension activities								P.65
                               Placement in unit								P.67
                               Learning goals and skills developed						P.68
                               Standards alignment                                                       P.69
                               Appendix: Three ways to prepare agarose gels				                          P.71
                               Ordering information								P.74
                               About miniPCR bio Learning Labs™						P.75
                               About the Duke Lemur Center 						P.76

miniPCR bio Learning LabsTM. Conservation Genetics Lab Instructor’s Guide
Version: 1.0 - Release: April 2021 - © 2021 by miniPCR bio™                                                              P./2
Instructor’s Guide

        At a glance
        Scientists working in the forests of Madagascar think they may have rediscovered a species of lemur that
        was believed to be extinct. You will analyze authentic field data to make the call.

        In this lab, students will use real data collected at a field site in Madagascar to predict the species identity
        of lemurs. They will then use gel electrophoresis to evaluate their predictions. By using authentic field data
        and analyzing actual lemur DNA sequences, students will use the tools of conservation genetics to make
        decisions critical to maintaining biodiversity.

        TECHNIQUES                TOPICS                     LEVEL                   WHAT YOU NEED                   AP CONNECTION

        Micropipetting             Molecular ecology         General high school     Micropipettes                   AP Biology units
        Gel electrophoresis        Conservation                through               Gel electrophoresis             6.8, 7.6, 7.7, 7.9, 7.11,
        Bioinformatics                genetics               College                    and visualization            8.5-8.7
                                   Evolution                                            system                       Skills and Practices
                                   Biotechnology                                                                     1.A-C, 3.B, 3.D, 4.B,
                                                                                                                     5.D, 6.A-E

                                                                                                                     APES Units
                                                                                                                     2.1, 3.1, 5.2, 5.4, 9.9, 9.10
                                                                                                                     Skills and Practices
                                                                                                                     1.A-C, 3.A-E, 4.B-E

        Planning your time
                                                                                                                     5.A-E, 7.A-F

        -
                                                   SINGLE CLASS PERIOD: 60 MINUTES

        OR

                PERIOD 1 - 30 MINUTES                                              PERIOD 2 - 30 MINUTES

                Morphological analysis                          Gel electrophoresis                          Interpret results

                                                      Help your students build proficiency in pipetting and gel electrophoresis with
        Additional                                    additional instructional videos, worksheets, and activities available at:
                                                      https://www.minipcr.com/tutorials/
        Supports                                      Taking it further – extension activities, page 33.
        -                                                • Using DNA sequence data to identify species: Build a phylogenetic tree of the
                                                           lemurs from this lab using actual sequence data.
                                                         • Using ecological data to evaluate the health of species: Analyze authentic field
                                                           data to evaluate the health of the species discussed in this lab and the potential
                                                           threats that they face.

miniPCR bio Learning LabsTM. Conservation Genetics Lab Instructor’s Guide
Version: 1.0 - Release: April 2021 - © 2021 by miniPCR bio™                                                                                          P./3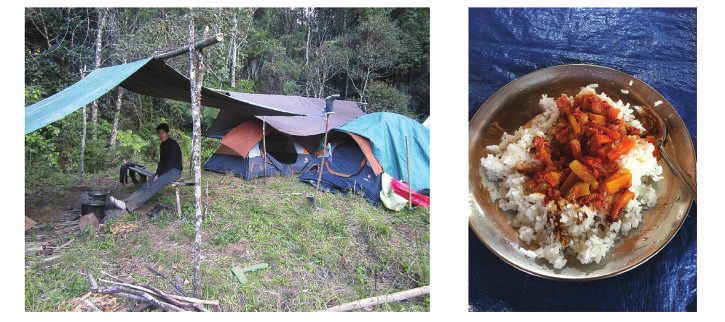
Instructor’s Guide

        Materials needed
        Supplied in kit (KT-1505-01)
            Reagents                              Amount                    Amount needed                         Teacher’s
            and supplies                          provided in kit           per lab group            Storage      checklist
            DNA samples                                   150 μl each                 15 μl each      Freezer
             • Alicia DNA                                                   Students will choose
             • Bema DNA                                                           and request 4
             • Garafa DNA                                                      samples to run on
             • Ihary DNA                                                                their gel.
             • Malala DNA
             • Mbola DNA
             • Razafy DNA
             • Rodolfo DNA

            Fast DNA Ladder 1                                    150 μl                      15 μl    Freezer

        Sold separately in Learning Lab Companion Kit
        (KT-1510-01)

            Reagents                              Amount                    Amount needed                         Teacher’s
            and supplies                          provided in kit           per lab group            Storage      checklist
            GelGreen® Agarose Tabs™                                   8         One tab per two        Room
                                                                                    agarose gels       temp.
                                                                                (1% agarose gel)

            TBE electrophoresis                       30 ml of 20X                    30 ml per        Room
            buffer                                      concentrate             blueGel™ system        temp.
             • 1X working solution                     Sufficient for
                                                       600 ml of 1X
                                                    working solution

            Plastic tubes                             50 microtubes                             5
                                                             (1.7 ml)

        Note: Gels can also be prepared with agarose powder or blueGel Agarose Tabs™, see appendix (pages 71-73).

miniPCR bio Learning LabsTM. Conservation Genetics Lab Instructor’s Guide
Version: 1.0 - Release: April 2021 - © 2021 by miniPCR bio™                                                                          P./4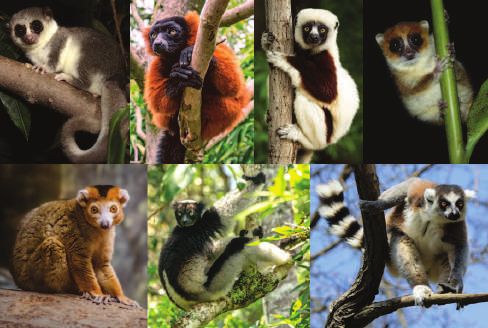
Instructor’s Guide

                            Materials needed (cont.)
                            Supplied by teacher

                             Reagents                                        Amount needed                    Teacher’s
                             and supplies                                    per lab group                    checklist
                             Horizontal gel electrophoresis apparatus:       1
                             e.g., blueGel™ electrophoresis system           If sharing gels, reserve one
                                                                             lane for ladder and four lanes
 Available at miniPCR.com

                                                                             for each group.

                             Blue light transilluminator                     1
                               * Note: A blue light transilluminator is
                                 integrated in the blueGel electrophoresis
                                 system

                             Micropipettes                                   1
                              • 2-20 μl: one per lab group

                             Disposable micropipette tips                    At least 5 per group

                             Microcentrifuge (optional; only needed to
                             collect liquid at tube bottom)

                             Distilled water for making agarose gels and     50 ml per gel
                             diluting TBE buffer

                             Flask or beaker to dissolve agarose

                             Microwave or hot plate to dissolve agarose

                             Other supplies:
                              • Disposable laboratory gloves
                              • Protective eyewear
                              • Permanent marker
                              • Cup to dispose of tips
                              • Scissors (for pre-lab activity)

miniPCR bio Learning LabsTM. Conservation Genetics Lab Instructor’s Guide
Version: 1.0 - Release: April 2021 - © 2021 by miniPCR bio™                                                                         P./5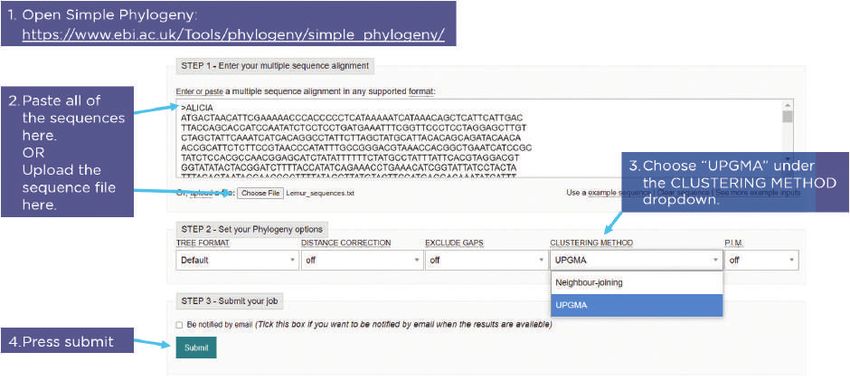
Instructor’s Guide

        Lab setup
        The following activities can be carried out by the instructor ahead of class. Reagents are sufficient
        to be used with 8 student groups. Reagents are stable at room temperature for 24 hours but should
        remain cold for short-term storage and frozen for long-term storage.

                    Gloves and protective eyewear should be worn for the entirety of this lab.

         A. Preparation for morphological analysis

            •   Distribute scissors or Lemur data cards.
                - Each group of students will need to cut out one set of Lemur data cards (provided on
                   pages 31-32 of the lab guide).
                - If performing this lab multiple times, you may wish to laminate sets of Lemur data cards and
                   save them for future use.

         B. Preparation for gel electrophoresis

            • Thaw tubes containing the Conservation
              Genetics Lab reagents by placing them on a
              rack or benchtop at room temperature.

                                                                                                                                                  DNA Ladder
                                                                                                                                       Rodolpho
                                                                                                                              Razafy
                                                                                            Garafa

                                                                                                             Malala

                                                                                                                      Mbola
                                                                            Alicia

                                                                                     Bema

                                                                                                     Ihary

            • For each lab group, label and dispense 15 μl
              of Fast DNA Ladder 1 into a labeled 1.7 ml
              tube.                                                                                    Defrost tubes
            • Provide each group with four empty 1.7 ml tubes.
            • When ready to perform electrophoresis, students will request four DNA samples they would
              like to test.

           Check          At the start of this experiment, every lab group should have:                                                           Amount
                          Fast DNA Ladder 1                                                                                                       15 μl
                          1.7 ml tubes                                                                                                            4
                          2-20 μl micropipette                                                                                                    1
                          Micropipette tips                                                                                                       5+
                          Fine tipped permanent marker                                                                                            1

miniPCR bio Learning LabsTM. Conservation Genetics Lab Instructor’s Guide
Version: 1.0 - Release: April 2021 - © 2021 by miniPCR bio™                                                                                                    P./6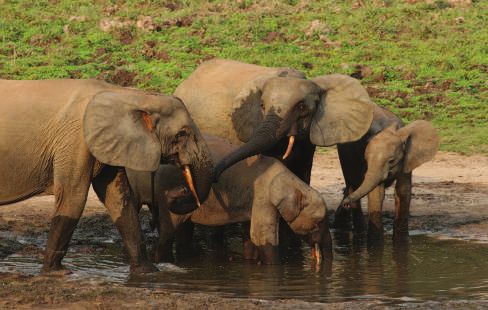
Instructor’s Guide

         C. Prepare for gel electrophoresis

            • Prepare 1X TBE buffer.
              - TBE buffer is typically provided in 20X concentration.
              - Add 1 part 20X buffer to 19 parts distilled water to make 1X buffer.
              - Volume to prepare depends on the method used to prepare gels; see “Important Note”
                 below.
            • Gels can be poured in advance of the class.
              - Pre-poured gels can be stored at ambient temperature in a sealed container or wrapped in
                 plastic wrap, and protected from light for up to three days.
              - Have the banding pattern of the Fast DNA Ladder 1 handy (page 22) to help interpret the
                 electrophoresis results.

        IMPORTANT NOTE: There are several ways to prepare agarose gels

            • Watch a video outlining three methods to cast agarose gels by scanning
              the QR code.
            • Continue to pages 71-73 for detailed instructions on how to prepare
              agarose gels using each method.
            • The video linked in the QR code uses a 2% gel as an example. This lab
              uses a 1% gel. To make a 1% gel, use the volumes specified on pages 71-73.

miniPCR bio Learning LabsTM. Conservation Genetics Lab Instructor’s Guide
Version: 1.0 - Release: April 2021 - © 2021 by miniPCR bio™                                                     P./7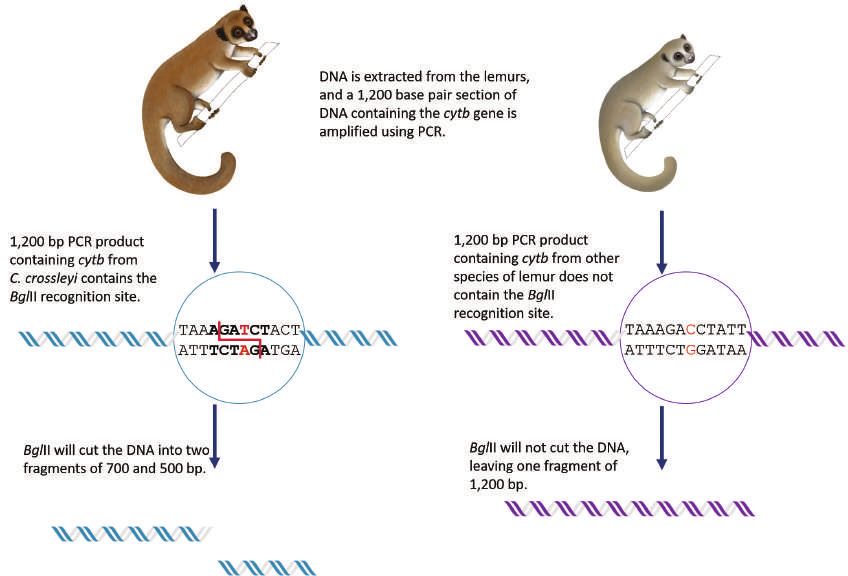
Student’s Guide

                                        Student’s
                                        Guide Contents

                    Background and significance                                          P.09

                    Today’s lab 									P.13

                    Pre-lab activity 								P.17

                    Laboratory guide               							P.20

                    Study questions - pre-lab							P.23

                    Study questions - post-lab							P.27

                    CER table                                                            P.29

                    Lemur data cards								P.31

                    Extension: Using DNA sequence data to identify species			            P.34

                    Extension: Using ecological data to evaluate the health of species   P.44

                    Extension: Research at Tsinjoarivo						P.54

miniPCR bio Learning LabsTM. Conservation Genetics Lab Student’s Guide
Version: 1.0 - Release: April 2021 - © 2021 by miniPCR bio™                                                   P./8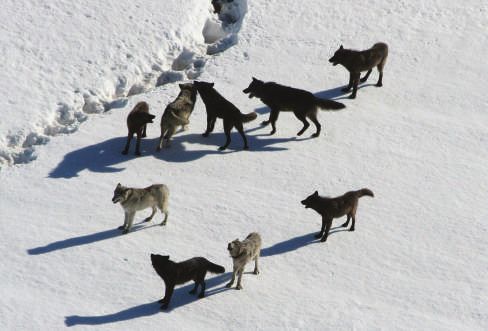
Student’s Guide

        Background and significance
        Overview
        -
        Today, many species are at risk from habitat destruction. To better understand how to protect
        species, conservation biologists must know how many species live in a particular area, whether they
        are rare or widespread, and how resilient they are in the face of ecological disruption.

        The island of Madagascar holds one of the most unique assemblages of species on Earth.
        Unfortunately, many of the species that live there are under threat of extinction from habitat loss.
        To understand how to protect these organisms, it is critical to know exactly how many species there
        are, where they live and how they interact with the environment. There are reports that a lemur
        species once thought to be extinct may have been spotted in an isolated forest on Madagascar.
        Today, you will analyze authentic data collected by researchers to determine if this lemur species has
        been rediscovered.

        Madagascar and lemurs
        -

        Madagascar is a large island off Africa’s east
        coast (Figure 1) with habitats unlike any others
        found on Earth. Because Madagascar has been
        isolated from other land masses for a long time,
        organisms that live there have been evolving
        separately from species on the mainland for
        tens of millions of years. As a result, many
        organisms found on Madagascar are unique. It’s
        estimated that roughly 90% of Madagascar’s
        species are found nowhere else in the world.

        Lemurs are perhaps the most iconic animals
        of Madagascar. Lemurs are small primates,
                                                                         Figure 1: Madagascar is located 250 miles off the east
        meaning they are part of the same order that                     coast of Africa and is the world’s 4th largest island.
        includes tarsiers, monkeys, apes, and humans.

        Scientists think that the common ancestor of all lemurs reached Madagascar approximately 40 to
        55 million years ago. Those first few animals likely floated on debris from the African coast all the
        way to Madagascar. The descendants of those first few animals quickly spread across the island. As
        different traits conferred advantages in different habitats, populations living separated from each

miniPCR bio Learning LabsTM. Conservation Genetics Lab Student’s Guide
Version: 1.0 - Release: April 2021 - © 2021 by miniPCR bio™                                                                       P./9
Student’s Guide

        other adapted to their local environments and
        eventually evolved into new species. Because
        Madagascar’s habitats are so varied and there
        were so many different ecological niches that
        lemurs could fill, early lemur populations evolved
        over the past 50 million years into the diverse
        array of species we see today (Figure 2).

        The fact that lemurs only live on Madagascar
        and are so well adapted to their specific habitats
        also means that they are particularly vulnerable
        to habitat loss. In Madagascar, slash-and-burn
                                                              Figure 2: Today there are over 100 different lemur
        farming practices have drastically reduced the        species. They range in size from the tiny mouse lemurs
        natural forests to small fragmented patches. By       (top right), where adults can be as small as 3 inches
        some estimates, over 80% of the island’s original     and weigh only one ounce, to the much larger indri
                                                              (bottom center), which weigh about 20 pounds and are
        forests are now gone. Furthermore, as the global      a little over two feet long, not including their tail. Some
        climate changes due to human fossil fuel use,         extinct lemur species may have been as large as 350
                                                              pounds, about the size of an adult male gorilla.
        the remaining forests in which lemurs live are
        also changing, further threatening the lemurs’        Dwarf lemur images courtesy Duke Lemur Center

        survival. According to the International Union
        for the Conservation of Nature (IUCN), 98% of lemur species are considered threatened and 31% are
        critically endangered.

        Measuring biodiversity
        -
        Protecting threatened species is a complex problem that requires the coordinated work of many
        different individuals and organizations. Often a first step in this work is to identify the biodiversity in
        an area. In terms of conservation, measuring biodiversity means identifying which species live in a
        particular region and estimating each species’ population.

        Scientists can sometimes disagree on how to define a species. Here, we use the word to mean a
        group of animals that are able to reproduce in the wild and share a particular set of characteristics
        and evolutionary history. Importantly, the members of a species have been breeding exclusively
        with members of their group for a long time. This means that all members of a species will be more
        closely related to each other than to any other organism.

        Of course, you can’t directly see exactly how organisms are related to each other, but things that
        are related do tend to look more similar. So, traditionally, we have relied on visual similarities and
        differences to identify species because members of different species tend to look different. For

miniPCR bio Learning LabsTM. Conservation Genetics Lab Student’s Guide
Version: 1.0 - Release: April 2021 - © 2021 by miniPCR bio™                                                                 P./10
Student’s Guide
example, lions and leopards look different, and
intuitively, these animals belong to distinct
species. Morphological differences, such as color
patterns, head shape, or limb length are easy for
us to measure and document.
The problem is that using only morphological
differences to classify species can end up
misrepresenting the actual number of unique
species. For example, sometimes species can
contain so much morphological diversity that we
may think there is more than one species just by
Figure 3: These wolves are a single pack and therefore
looking, but the organisms belong to a common closely related members of one species, even though
breeding population (Figure 3). Perhaps more some look very different from each other.
often, organisms may look nearly identical, but
exhibit different behaviors and habits, belong to
different breeding populations, and ultimately
represent separate species (Figure 4).
When different species are difficult to tell apart
based on morphology, we call them cryptic
species. To figure out whether multiple species
exist in a population of animals that look alike, we
have to use more tools than just morphological
measurements. We need to document their
behavior, communication systems, and, most
importantly, genetics—their DNA.
When organisms reproduce, random mutations
that occur in the DNA may be passed to the
offspring. Within a single species, these random
mutations have the opportunity to spread
through the population as different organisms
reproduce together. But in other groups, different
mutations will occur and eventually spread and
become more common. As long as the two
groups are not exchanging genes by reproducing
Figure 4: African forest elephant (top) and African bush
together, the specific mutations that spread and elephants (bottom) are difficult to distinguish based
become common will mostly be different (Figure on morphology, but scientists consider them different
species because they have been separate breeding
5). Scientists can compare these differences in
populations for almost two million years.
the DNA to identify which groups are distinct and
miniPCR bio Learning LabsTM. Conservation Genetics Lab Student’s Guide
Version: 1.0 - Release: April 2021 - © 2021 by miniPCR bio™ P./11Student’s Guide
how different groups are related. Even if organisms look and behave similarly, their DNA can tell us if
they are different species and how they are related evolutionarily.
Figure 5: When a population splits into two or more groups, individuals from the different populations may not
interbreed for many, many generations. When that happens, different mutations will spread and become more common
in each group. By comparing DNA sequences from many different individuals, scientists can find all the different places
where groups differ genetically. These genetic differences can help scientists identify different species.
In the end, DNA will provide evidence of how genetically distinct different groups are. Whether
different populations are distinct enough to be considered different species is a judgment call made
by experts.
What does it mean to be related?
When a person says they are related to someone biologically, they usually mean that they share
ancestors. A sibling is very closely related because you share ancestors just one generation
prior (your parents). A cousin is less closely related because your shared ancestors were two
generations ago (your grandparents). A second cousin is more distantly related still because of
how far back you need to go to find a common ancestor (your great-grandparents).
The same is true for species. When we say that species are closely related we are saying that
the individuals of those two species share common ancestors in the not too distant past. When
species are less closely related, it is because you need to go farther back in time to find their
common ancestors. The main differences is the amount of time. Species relationships are usually
measured in millions of years; family relationships are measured in a few generations.
miniPCR bio Learning LabsTM. Conservation Genetics Lab Student’s Guide
Version: 1.0 - Release: April 2021 - © 2021 by miniPCR bio™ P./12Student’s Guide
Today’s lab
Today, you will be joining our research team on an important expedition. We have reports of
lemurs living in the forest that resemble a species long thought to be extinct. Help us determine if
a lemur species has been rediscovered!
Today, we are trying to determine how many species of lemur live
in a particular forest of the central highlands of Madagascar. The
forest we are studying is a protected reserve near the town of
Tsinjoarivo (tsin-ju-a-reev-oo) (Figure 6). We know that one species,
Cheirogaleus crossleyi (Care-o-gal-ee-us cross-lee-eye), sometimes
called the furry-eared dwarf lemur, lives at Tsinjoarivo. C. crossleyi
is considered a vulnerable species, though it is known to still live
in several forests throughout the central highlands. But there have
been reports of lemurs living at Tsinjoarivo that seem to more
closely resemble a different species, Cheirogaleus sibreei (Care-
o-gal-ee-us sib-ree-eye), sometimes called Sibree’s dwarf lemur.
Having two such similar species living in the same forest would
be rare, but not unheard of. If species’ lifestyles are just different
enough, they can avoid competition for resources, allowing both
species to survive.
Figure 6: Tsinjoarivo is located
on the East side of Madagascar
near the edge of the central
If C. sibreei were living in Tsinjoarivo, it would be big news. This is
highlands, highlighted in yellow. because C. sibreei is a species of dwarf lemur that scientists have
long considered to be extinct. The last known population was wiped
out when its forest habitat was destroyed many years ago. Today, the only example we have is a
single preserved museum specimen. Unfortunately, due to regulations, taking samples from that one
specimen is prohibited, so we can only make hypotheses about the species’ genetics.
The problem is that from what we know of C. sibreei, the two species look very similar (Figure
7). This is true of all dwarf lemur species. In other words, dwarf lemur species are cryptic. Until
just recently scientists identified only two species of dwarf lemur based on their morphology
and geographical range. But as scientists have sampled more and more dwarf lemur populations,
accumulated new ecological data, and used new genetic tools, they have realized that there are
more dwarf lemur species than they previously thought. Today, we know that what scientists initially
characterized as two species of dwarf lemur are actually at least nine unique species.
Could it be that the population of C. crossleyi at Tsinjoarivo just contains a little more morphological
variation than usual? Or, have we truly rediscovered a species, C. sibreei, once thought lost to
history? You will need to analyze data, both morphological and genetic, to make the call.
miniPCR bio Learning LabsTM. Conservation Genetics Lab Student’s Guide
Version: 1.0 - Release: April 2021 - © 2021 by miniPCR bio™ P./13Student’s Guide
The field site
-
We will be working at a field site in the
forest of Tsinjoarivo. The forest of Tsinjoarivo
is one of the largest forest patches of the
Central Highlands left today. The forests
of the central highlands (a mountainous
region that runs through the center of
the island) have been a big target for
agricultural cultivation. As such, the high-
altitude forests are now very fragmented.
Instead of the large connected forests that
once dominated the landscape, today there
are only a few separated pockets of forest
left. Animals living in these pockets are
separated from other animals of the same
species. Each small isolated population has
fewer individuals that can reproduce and
therefore are much more vulnerable when
Figure 7: C. crossleyi lemurs (the furry-eared dwarf lemur,
compared to larger connected groups.
top left) are common at Tsinjoarivo, but some animals
Because of this, the pressures of ecological (top right) look less like C. crossleyi and more like the
disturbance from humans and climate extinct species C. sibreei (Sibreei’s dwarf lemur). An artist’s
rendition of the two species are shown for comparison (C.
change are of particular concern for animals crossleyi, bottom left; C sibreei, bottom right).
living in the forests of the Central Highlands.
Photos courtesy of Dr. Marina Blanco.
Illustrations courtesy of Sally Bornbusch.
Dwarf lemurs
-
This research expedition is specifically focused on dwarf lemurs at Tsinjoarivo. Dwarf lemurs are
small (about the size of a squirrel), nocturnal lemurs. Dwarf lemurs are also the only primates that
are obligate hibernators, which means that every dwarf lemur hibernates every year, no matter what.
Being small nocturnal animals that hibernate for a significant part of the year, dwarf lemurs can be
much more difficult to observe than many other lemur species. Doing so requires miles of hiking
through rugged terrain, setting traps high in the trees, and lots of patience.
miniPCR bio Learning LabsTM. Conservation Genetics Lab Student’s Guide
Version: 1.0 - Release: April 2021 - © 2021 by miniPCR bio™ P./14Student’s Guide
Data collection and analysis
-
To determine whether the lemurs living at Tsinjoarivo are all C. crossleyi or whether some of them
are C. sibreei, we start by trapping lemurs in the forest. To catch the lemurs, we set traps in the trees
baited with fermented fruit. We check the traps every morning, and bring any lemurs we catch back
to the field station. We then take photos and detailed morphological measurements of each lemur.
You will use these detailed measurements to establish how many species you think are present
based on morphological data. Finally, we take a small tissue sample to test the animals’ DNA.
These DNA samples will be used to make a final determination of how many species are present.
After sampling, we return the lemurs to the same spot where we caught them, ensuring as little
disturbance as possible to the animals.
Identifying species using DNA
-
cytb: The cytochrome b gene (cytb for short, pronounced
‘sight-bee’) is commonly used to identify different species.
cytb is a mitochondrial gene. Mitochondria are organelles
that convert energy in the cell, and they have their own
small circular genome that is separate from the DNA in
the cell nucleus (Figure 8). Scientists use cytb for species
identification. This is because mitochondrial genes tend to
evolve at such a rate that we observe meaningful differences
in the DNA when comparing mitochondrial genes across
species, but not when looking at members of the same Figure 8: Cytochrome B (cytb) is
species. We can figure out how many different lemur located in the mitochondrial genome.
The mitochondrial genome is a
species we have captured by looking at the similarities circular genome located outside the
and differences between the cytb DNA sequences from cell’s nucleus. Unlike other DNA,
different lemurs. Eventually, we will sequence the cytb gene, mitochondrial DNA is almost always
inherited only from the mother.
identifying the exact order of every nucleotide, to identify all
the differences between each lemur’s cytb sequences.
PCR-RFLP: Today we’re going to use a faster way to test many lemurs without having to sequence
the cytb gene. This method is called PCR-RFLP (polymerase chain reaction - restriction fragment
length polymorphism). This technique starts by using PCR (polymerase chain reaction), a method
for making many copies of a specific DNA sequence. Using PCR, the field team will make copies
of a 1,200 base pair (bp) segment of the lemur mitochondrial genome. The resulting 1,200 bp PCR
product will contain the entire 1,140 bp of the cytb gene. Then, the team will use a restriction enzyme
to cut those 1,200 bp PCR products at a particular point in their DNA sequence.
miniPCR bio Learning LabsTM. Conservation Genetics Lab Student’s Guide
Version: 1.0 - Release: April 2021 - © 2021 by miniPCR bio™ P./15Student’s Guide
Restriction enzymes recognize specific, short DNA sequences
(typically 4-8 base pairs long) and cut the DNA there. We
have previously identified two unique mutations in the cytb
gene of C. crossleyi (the furry-eared dwarf lemur) that are
not present in any other lemur species. These mutations allow
Figure 9: The restriction enzyme BgIII
the enzyme BglII (pronounced like “bagel 2”), to cut the cytb cuts the sequence AGATCT at the points
PCR product from C. crossleyi lemurs, but not from other marked in red.
species. In our experiment, if the 1,200 bp product is cut into
a 500 bp fragment and a 700 bp fragment, we will know that the DNA belonged to C. crossleyi. If
the restriction enzyme does not cut our cytb fragment, we will know the DNA came from a different
lemur species (Figure 10). To see if the DNA is cut, we run our samples on an agarose gel. The DNA
that you will run on your gel today is the 1,200 bp PCR product from cytb after it has been incubated
with BglII.
Figure 10: Overview of
experimental procedure.
Lemur illustrations courtesy
of Sally Bornbusch.
Are there Sibree’s dwarf lemurs living in Tsinjoarivo?
-
Your job today is to analyze the data the researchers gathered. First, you will analyze the
morphological data from several lemurs sampled by our field team at Tsinjoarivo. Then, based on
your analysis, you will decide on which lemurs you will perform genetic analyses and ultimately
determine whether you have rediscovered a lost species of lemur!
miniPCR bio Learning LabsTM. Conservation Genetics Lab Student’s Guide
Version: 1.0 - Release: April 2021 - © 2021 by miniPCR bio™ P./16Student’s Guide
Pre-lab activity: morphological
analysis
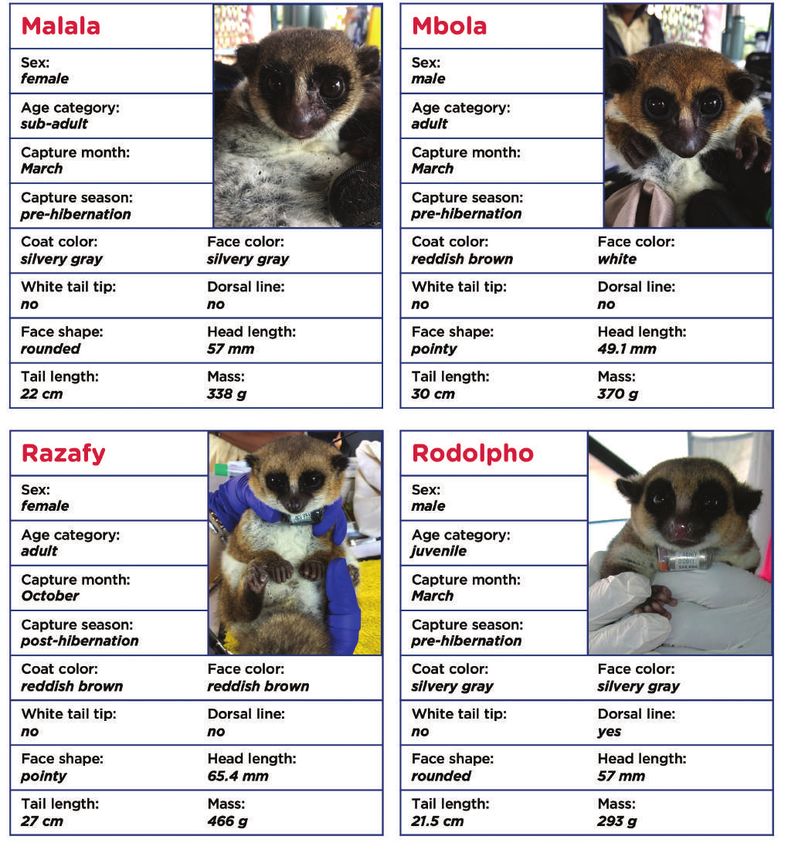
The team has trapped eight dwarf lemurs and brought them back to the field station for analysis
Remember that scientists originally characterized species mostly based on their morphology, or how
they looked. Species of dwarf lemurs tend to look very similar. But there are some key differences
that we look for and can measure. These are traits that often differ between different dwarf lemur
species and include:
• Mass
• Tail length
• Head length
• Presence or absence of a dorsal line
(a stripe that runs down the center of
the back)
• Presence or absence of a white tail tip
• Snout shape (pointy or rounded)
• Coat color
• Face color
Lemur illustrations courtesy of Sally Bornbusch
The full range of traits the team observed is summarized in the following table. Your job is to look
at the data for each lemur individually and and decide which may belong to C. crossleyi (the furry-
eared dwarf lemur) and which may belong to the thought-to-be-extinct species C. sibreei (Sibree’s
dwarf lemur).
When comparing C. crossleyi to the
Trait Summary of observations
historical descriptions of C. sibreei, we
Mass between 293 g and 466 g expect C. crossleyi to be larger and to
have longer tails than C. sibreei. They
Tail length between 23.5 cm and 30 cm
are also usually a reddish-brown color,
Head length between 49.1 mm and 65.4 mm with a white underbelly and black
around their eyes, snout, and tips of
Dorsal line some present; some absent
their ears. Sometimes there is also some
White tail tip some present; some absent white around their noses and eyes and
a white tip on the end of their tails.
Snout shape rounded or pointy
Like C. crossleyi, C. sibreei have a white
Coat color silvery gray or reddish-brown underbelly, with black around their eyes
and snout, but the restof their fur is
Face color white, silvery gray, or reddish-brown
thought to be a little grayer in color.
miniPCR bio Learning LabsTM. Conservation Genetics Lab Student’s Guide
Version: 1.0 - Release: April 2021 - © 2021 by miniPCR bio™ P./17Student’s Guide
Morphological analysis
-
The data collected from eight dwarf lemurs from Tsinjoarivo are presented on pages 31-32. From
these data, you need to decide whether you think all of the lemurs belong to the species C.
crossleyi (the furry-eared dwarf lemur) or whether some may belong to a different species, likely
the thought-to-be extinct species C. sibreei (Sibree’s dwarf lemur).
1. Decide how you want to group the lemurs that were found. Use the lemur data cards (pages
31-32) for this activity. You may choose to cut out each individual card in order to group the
lemurs more easily. You are trying to identify what you think are groups of lemurs that may
represent the same species. You may make as many or few groups as you choose, but you
must justify your groups based on the data. Remember, researchers are particularly interested
in whether there are two different species present, C. crossleyi and C. sibreei.
Name the lemurs you think may be C. crossleyi:
I believe the individuals in this group belong to the same species because:
Name the lemurs you think may be C. sibreei (if you think there is more than one species present):
I believe the individuals in this group belong to the same species because:
Based on the information provided, do you feel confident in the groups you made? Explain your
answer.
Do any individuals not fit in these two groups? If so, explain here.
miniPCR bio Learning LabsTM. Conservation Genetics Lab Student’s Guide
Version: 1.0 - Release: April 2021 - © 2021 by miniPCR bio™ P./18Student’s Guide
Gel electrophoresis - Pre-lab
-
You have collected data from eight lemurs, but at the field site, you have limited resources. For
your initial lab analysis, you will test four of the lemurs using genetic techniques. If these results
look promising, you will go ahead and analyze the entire cytb sequence from all of the lemurs in
the study.
1. Discuss with your team which four lemurs you would like to test genetically in order to
evaluate your hypothesis.
• In the pre-lab exercise, you made a hypothesis based on data from eight individual lemurs.
• Here, you will test your hypothesis by running DNA from four of those individuals on your
gel.
• Your job is to identify whether a lemur species other than C. crossleyi is living at the
Tsinjoarivo field site. If you find a species other than C. crossleyi we can assume that you
have rediscovered the species C. sibreei. You will be able to confirm this finding in the
extension: “Making phylogenetic trees using sequence data.”
Sample Animal name (from pre-lab activity) Justification for including this sample in your analysis
A
B
C
D
2. Above, you justified each sample individually. Now explain in a couple of sentences your
overall strategy for choosing the samples you chose. For example, did you look at any
specific characteristics? Did you try to capture a range of animals; did you try to key in on
very different ones?
3. Justify why you took the approach you did.
miniPCR bio Learning LabsTM. Conservation Genetics Lab Student’s Guide
Version: 1.0 - Release: April 2021 - © 2021 by miniPCR bio™ P./19Student’s Guide
Gel electrophoresis - Pouring gels (before and during
class period)
Gels can be prepared up to three days ahead of time and stored at
ambient temperature, covered in air-tight plastic wrap and protected
from light.
You will need four lanes plus one lane for ladder per group. If groups are
sharing gels, a single lane for ladder is sufficient.
These instructions are designed for use with the blueGel™ electrophoresis system by miniPCR
bio™. If using another electrophoresis system, these instructions may need to be adjusted according
to the manufacturer’s instructions.
1. Prepare 1X TBE buffer (to be completed by teacher in advance)
• TBE buffer is typically provided at 20X concentration.
• Add 1 part 20X buffer to 19 parts deionized water to make 1X buffer.
Comb
2. Prepare a clean and dry casting platform
with a gel tray and comb Gel tray
• Place the clear gel tray in the white
casting platform.
• Place a well-forming comb at the top
of the gel tray.
3. Prepare a 1% agarose solution using the
Casting
method indicated by your instructor
platform
IMPORTANT NOTE: There are several ways to prepare agarose gels
• Watch a video outlining three methods to cast agarose gels by scanning
the QR code.
• Continue to pages 71-73 for detailed instructions on how to prepare
agarose gels using each method.
• The video linked in the QR code uses a 2% gel as an example. This lab
uses a 1% gel. To make a 1% gel, use the volumes specified on pages 71-73.
miniPCR bio Learning LabsTM. Conservation Genetics Lab Student’s Guide
Version: 1.0 - Release: April 2021 - © 2021 by miniPCR bio™ P./20Student’s Guide
Protective gloves and eyewear should be worn for the entirety of this experiment.
Gel electrophoresis - Running the gel
These instructions are designed for use with blueGel™ electrophoresis system by miniPCR bio™. If
using another electrophoresis system, these instructions may need to be adjusted according to the
manufacturer’s instructions.
1. Obtain your reagents
• Label each of four 1.7 ml tubes with the name
of the animal you wish to test (from page 19).
• Your teacher will provide you with 15 μl of
DNA sample from each lemur you choose.
Gel tray
2. Place the gel tray containing your gel in the buffer
chamber Buffer
chamber
• Ensure that the clear buffer chamber is inside
the blueGel™ electrophoresis system.
Base
• The wells of the gel should be on the same
side as the negative electrode, away from the
power button.
3. Add 30 ml of 1X TBE electrophoresis buffer
• The buffer should just cover the gel and wells.
• Ensure that there are no air bubbles in the
wells (shake the gel gently if bubbles need to
be dislodged).
4. Load samples onto the gel in the following
sequence
• Lane 1: 10 μl Fast DNA Ladder 1
• Lane 2: 10 μl Sample A
• Lane 3: 10 μl Sample B
• Lane 4: 10 μl Sample C
• Lane 5: 10 μl Sample D
Note: Samples already contain loading dye.
miniPCR bio Learning LabsTM. Conservation Genetics Lab Student’s Guide
Version: 1.0 - Release: April 2021 - © 2021 by miniPCR bio™ P./21Student’s Guide
5. Place the orange cover on the blueGel™ electrophoresis system
• To prevent fogging, make sure that ClearView™ spray has been
evenly applied to the inside of the orange cover.
• Match the positive and negative electrode signs on the orange lid
with the corresponding positive and negative signs on the blue
base.
• The orange lid should sit flush with the blue base using little force.
6. Press the “Run” button
• Check that the green light beside the power button remains illuminated.
7. Conduct electrophoresis for 15-25 minutes
• The colored dye should progress to about half the length of the gel.
• Longer electrophoresis times will result in better size resolution.
Gel electrophoresis – Visualizing
results
1. Press the “light bulb” button to turn on the blueGel™
transilluminator
• For best viewing, dim lights or use Fold-a-View™
photo documentation hood with a smartphone
camera.
• Gels may be viewed at the end of the run or
periodically throughout the run.
• If the image appears hazy, wipe off the inside of the
orange cover and reapply ClearView™ spray.
Fast DNA bp ng / 10 μl
2. Ensure that there is sufficient DNA band resolution Ladder 1
in the 500-1200 bp range of the Fast DNA Ladder 1 1200 50
• Run the gel longer if needed to increase
resolution. 700 100
500 50
3. Document your results
• Compare the bands from samples A, B, C, and 300 50
D ladder to obtain size estimates.
200 50
• Place Fold-a-View™ photo documentation
hood on the blueGel™ electrophoresis system 100 50
to take a picture with a smartphone or other
digital camera.
miniPCR bio Learning LabsTM. Conservation Genetics Lab Student’s Guide
Version: 1.0 - Release: April 2021 - © 2021 by miniPCR bio™ P./22Student’s Guide
Study questions - pre-lab
-
Review
1. The majority of the species that live on Madagascar live nowhere else on earth. Give at least
one reason why scientists think Madagascar contains such a unique assemblage of species.
2. How many species of lemur live on Madagascar? How many species of lemur live in other
places in the world?
3. Biodiversity is a measure of how much biological variation there is in a particular area. What
specific measures of biodiversity are being used in this lab?
4. What do we mean when we say species are “cryptic species”?
5. Why must we use genetics to tell some species apart?
6. What about dwarf lemurs makes them more difficult to study compared to some other species
of lemur?
miniPCR bio Learning LabsTM. Conservation Genetics Lab Student’s Guide
Version: 1.0 - Release: April 2021 - © 2021 by miniPCR bio™ P./23Student’s Guide
7. What are two reasons why the cytochrome b (cytb) gene sequence is often used for
identifying species?
8. There are more species of dwarf lemur recognized today than there were 20 years ago. How
were these species identified, and why weren’t they recognized previously?
9. The gel on the right shows possible results 1 2 3 4 5
from today’s experiment. Lane 1 shows BASE
the DNA ladder. For lanes 2 and 3, identify PAIRS
whether you think the BglII restriction site
was present in the DNA fragment. Then,
1,200
based on that answer, say whether you think
the DNA came from a C. crossleyi (the furry- 700
eared dwarf lemur) individual or some other 500
species of lemur.
300
Lane 2: Did BglII cut? 200
100
• Reasoning:
• Did this DNA come from a C. crossleyi lemur?
• Reasoning:
miniPCR bio Learning LabsTM. Conservation Genetics Lab Student’s Guide
Version: 1.0 - Release: April 2021 - © 2021 by miniPCR bio™ P./24Student’s Guide
Lane 3: Did BglII cut?
• Reasoning:
• Did this DNA come from a C. crossleyi lemur?
• Reasoning:
10. In lane 4, draw what you think a result for a C. sibreei lemur would be.
• Explain your reasoning.
11. Challenge question: In lane 5, imagine that there was a lemur that was a hybrid offspring of
a C. crossleyi mother and a father that was another species of lemur. Draw in the results you
would expect for this hybrid offspring of lemur. (Hint: remember where in the genome the cytb
gene is found).
• Justify your answer.
miniPCR bio Learning LabsTM. Conservation Genetics Lab Student’s Guide
Version: 1.0 - Release: April 2021 - © 2021 by miniPCR bio™ P./25Student’s Guide
Critical thinking
1. There are over 100 species of lemur living on Madagascar today. These lemurs are all descended
from a small original population that landed on the island 40-55 million years ago. Imagine if
Madagascar were all just one type of habitat, say a rainforest. Do you think more or fewer species
of lemur would have evolved if Madagascar were all one type of habitat? Explain your answer.
2. In this lab, we defined species as distinct breeding populations that can be distinguished using
genetic tools. Different biologists will sometimes use different definitions of species, or “species
concepts,” depending on what they are studying. For example, paleobiologists (scientists that
study fossils), microbiologists (scientists that study microscopic life including asexual bacteria),
and conservation biologists likely do not use the same species concept in their work. Using these
examples or others of your choosing, why do you think biologists who study different things may
need to use different species concepts?
3. In this lab, we will use PCR-RFLP to tell the two species apart. Based on the description of PCR-
RFLP in this lab, do you think you could always use that technique to identify any two species?
Explain your answer.
miniPCR bio Learning LabsTM. Conservation Genetics Lab Student’s Guide
Version: 1.0 - Release: April 2021 - © 2021 by miniPCR bio™ P./26Student’s Guide
Study questions - post-lab
-
Review
1. On the blank image of a gel to the
right, draw what your results look
like (Use only as many wells as you
ran on your gel).
2. Based on these results, how many
species of dwarf lemur are living at
Tsinjoarivo?
3. Label each lane with the name of
the lemur that you tested.
4. Mark a result with a star if it indicates that the individual belongs to the species C. crossleyi
(furry-eared dwarf lemur).
5. Explain how you knew which lanes to mark in the previous question.
6. Do your results match your prediction from the morphology analysis section of this lab?
If not, how was it different?
miniPCR bio Learning LabsTM. Conservation Genetics Lab Student’s Guide
Version: 1.0 - Release: April 2021 - © 2021 by miniPCR bio™ P./27Student’s Guide
7. Look back at the data used in the morphological analysis. Which types of data now seem to be
reliable factors on which to base your species designations?
8. Which morphological data now seem to be less reliable factors on which to base your species
designations?
miniPCR bio Learning LabsTM. Conservation Genetics Lab Student’s Guide
Version: 1.0 - Release: April 2021 - © 2021 by miniPCR bio™ P./28Student’s Guide
CER Table
Fill in the table based on your results from the lab. Use the rubric on the next page to help your
answers.
Question:
Is there more than one species of dwarf lemur living at Tsinjoarivo?
Claim
Make a clear statement
that answers the above question.
Evidence
Provide data from the lab
that supports your claim.
Reasoning
Explain clearly why the data you
presented supports your claim.
Include the underlying scientific
principles that link your evidence
to your claim.
miniPCR bio Learning LabsTM. Conservation Genetics Lab Student’s Guide
Version: 1.0 - Release: April 2021 - © 2021 by miniPCR bio™ P./29Student’s Guide
CER table rubric
Score 4 3 2 1
CLAIM Makes a clear, Makes an accurate Makes an accurate Makes a claim that is
A statement accurate, and and complete claim. but incomplete or inaccurate.
that answers the complete claim. vague claim.
original question/
problem.
EVIDENCE All of the evidence Provides evidence Provides relevant Only provides
Data from the presented is highly that is relevant and but insufficient evidence that does
experiment that relevant and clearly sufficient to support evidence to support not support claim.
supports the sufficient to the claim. the claim. May
claim. support the claim. include some non-
Data must be relevant evidence.
relevant and
sufficient to
support the
claim.
REASONING Provides reasoning Provides reasoning Provides reasoning Provides reasoning
Explain why that clearly links that links the that links the that does not link
your evidence the evidence to evidence to the evidence to the the evidence to
supports your the claim. Relevant claim. Relevant claim, but does not the claim. Does not
claim. This must scientific principles scientific principles include relevant include relevant
include scientific are well integrated are discussed. scientific principles scientific principles
principles/ in the reasoning. or uses them or uses them
knowledge that incorrectly. incorrectly.
you have about
the topic to
show why the
data counts as
evidence.
Rubric score 3 4 5 6 7 8 9 10 11 12
Equivalent Grade 55 60 65 70 75 80 85 90 95 100
We recommend that teachers use the following scale when assessing this assignment using the rubric.
Teachers should feel free to adjust this scale to their expectations.
miniPCR bio Learning LabsTM. Conservation Genetics Lab Student’s Guide
Version: 1.0 - Release: April 2021 - © 2021 by miniPCR bio™ P./30Student’s Guide
Lemur data cards
Use these Lemur data cards to complete the activity on the following pages. You may wish to cut
out the eight individual cards.
(Lemur photos courtesy Dr. Marina Blanco)
miniPCR bio Learning LabsTM. Conservation Genetics Lab Student’s Guide
Version: 1.0 - Release: April 2021 - © 2021 by miniPCR bio™ P./31Student’s Guide
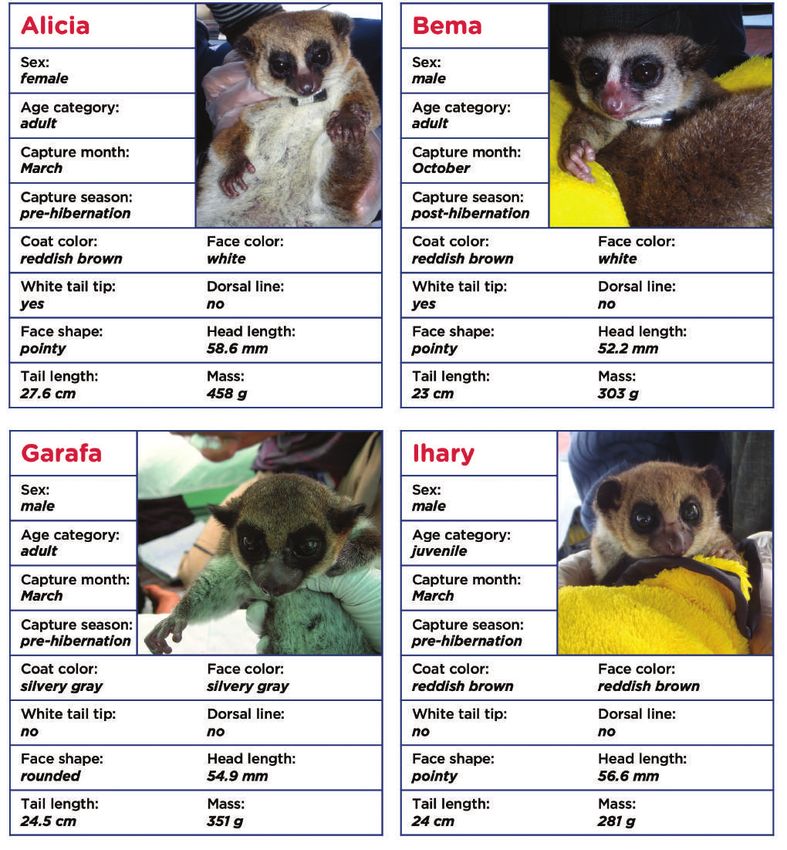
Lemur data cards (cont.)
Use these Lemur data cards to complete the activity on the following pages. You may wish to cut
out the eight individual cards.
(Lemur photos courtesy Dr. Marina Blanco)
miniPCR bio Learning LabsTM. Conservation Genetics Lab Student’s Guide
Version: 1.0 - Release: April 2021 - © 2021 by miniPCR bio™ P./32Additional
Supports
Extension
Activities
Using DNA sequence data to identify species P.34
Using ecological data to evaluate the health of species P.44
Research at Tsinjoarivo P.54
miniPCR bio Learning LabsTM. Conservation Genetics Lab Instructor’s and Student’s Guide
Version: 1.0 - Release: April 2021 - © 2021 by miniPCR bio™ P./33Additional
Supports
Extension: Using DNA sequence
data to identify species
In this lab, you used molecular techniques to investigate whether individual lemurs from Tsinjoarivo
belonged to the same species of dwarf lemur. The RFLP analysis you did is often done as a
preliminary analysis when comparing DNA sequences. To be more comprehensive, scientists can
sequence the entire cytb gene.
Today, you will look at the cytb DNA sequences of the lemurs you analyzed in your lab activity.
Using their cytb DNA sequences, you will establish how these individuals are related to each other
and to other species of lemurs. This type of analysis will answer whether the groups you identified
previously are indeed evolutionarily distinct. That means that the groups have been reproducing
separately for long enough that we can recognize differences in their DNA. You will use this analysis
to further evaluate the conclusions you drew from the RFLP analysis in the lab exercise.
Using DNA to build relationships
-
Establishing how species are related to each other evolutionarily is a field of biology called
phylogenetics, and the description of how a species is related to other species evolutionarily is
called a phylogeny.
Using DNA sequences, we can build a more complete picture of how individuals are related to
each other. We usually display these relationships by building a phylogenetic tree—sometimes just
called an evolutionary tree. Building a phylogenetic tree is based on a relatively simple idea. If two
organisms’ DNA sequences share a unique mutation, it is likely that they share a common ancestor in
which that mutation occurred (Figure 1). By looking for these shared variants, we can start to build
relationships, understanding how individuals and groups of individuals are connected through their
common ancestors. These connections are then presented in the form of a tree.
Figure 1: The eight sequences presented here are all
different. But by looking at similarities between sequences
we can start to put them into groups. Sequences A,
B, and C share mutations highlighted in blue. We can
make the assumption that they share ancestors in which
those mutations occured. Sequences D, E, and F share
mutations highlighted in pink, making it likely that they
share common ancestors that carried these mutations.
Sequences G and H share mutations highlighted in orange.
miniPCR bio Learning LabsTM. Conservation Genetics Lab Instructor’s and Student’s Guide
Version: 1.0 - Release: April 2021 - © 2021 by miniPCR bio™ P./34Additional
Supports
Tree thinking
-
All phylogenetic trees are made of two basic features: branches and nodes. Branches are the lines
of the tree and represent a population as it evolves over long periods of time and many, many
generations. Nodes are the places where branches diverge. A node represents the last common
ancestor of the branches that are connected to it. Understanding at which nodes two branches
connect will tell you how organisms are related to each other.
You can draw these connections in different styles, but their meanings are the same. Sometimes
lines are drawn at an angle, making a series of connected “V”s (Figure 2, top). Sometimes lines look
more rectangular and advance from left to right (Figure 2, bottom) as in the trees you will produce
today, but they can be oriented in any direction. Sometimes they are even drawn as a circle.
Figure 2: In these trees, the branches are drawn with blue lines. The
nodes are numbered and marked with red dots, though, in most
trees, the nodes are not labeled. The nodes are places where one
branch splits into two.
The two trees to the left may look different, but to a
phylogeneticist, they are identical. In both trees, organisms A and
B are most closely related to each other. They share a common
ancestor at node 1. Organism C is more distantly related to A and B.
All three organisms share a common ancestor at node 2. Node 2 is
deeper in the tree than node 1, meaning the organisms represented
by node 2 lived before the organisms that lived at node 1. In fact,
node 2 represents the ancestor of all the organisms on the tree. For
this reason, we call node 2 the root of the tree.
Interpreting a tree
-
Interpreting a phylogenetic tree involves putting organisms into groups based on relatedness. We
call these groups clades. A clade includes all the organisms descended from a single node on a
tree, and only those organisms. A clade may be very large if a node represents an organism that
lived a long time ago and has many, many species that are descended from it. Or a clade may be
as small as a single species. In the tree on the next page (Figure 3), using the genus Panthera (also
known as the big cats) as an example, you can see several clades. For example, lions and leopards
form a clade (highlighted in pink), because they share an ancestor at node 1. Lions, leopards, and
jaguars form a larger clade (highlighted in orange) because they are all of the organisms descended
from node 2. Tigers and snow leopards form a clade (highlighted in purple) because they are all
miniPCR bio Learning LabsTM. Conservation Genetics Lab Instructor’s and Student’s Guide
Version: 1.0 - Release: April 2021 - © 2021 by miniPCR bio™ P./35Additional
Supports
of the organisms descended from node 4, while
all the big cats together form a larger clade
(highlighted in yellow). In this tree, the domestic
cat, which is not a member of the genus Panthera,
is also included. The domestic cat represents an
outgroup, meaning that all the other organisms on
the tree are part of a clade (highlighted in yellow)
to which the domestic cat does not belong. In
other words, all the other cats on this tree are
more closely related to each other than they are
to a domestic cat. An outgroup is often included
in a tree intentionally. Scientists do this by
choosing an organism they know in advance to be
more distantly related. In some software programs Figure 3: Phylogeny of the genus Panthera, the big
cats. Here, nodes are numbered 1-5 for reference.
used to build phylogenies, this is needed for Different clades are shaded in different colors.
technical reasons, but generally, it can help to Domestic cats are included in the tree as an outgroup,
give the tree some perspective. The outgroup will meaning we knew in advance that they do not belong
to the same clade as the other organisms.
branch off of the deepest node in the tree, node
5 in this example. The deepest node in your tree
represents what is called the root of the tree. The root represents the common ancestor to all the
organisms in the tree.
1. Panthera is the genus that includes lions, leopards, jaguars, tigers, and snow leopards. Which
node on this tree tells you that all those organisms form a clade?
2. According to this tree, is a jaguar more closely related to a tiger or a lion? Justify your answer
with evidence from the tree.
miniPCR bio Learning LabsTM. Conservation Genetics Lab Instructor’s and Student’s Guide
Version: 1.0 - Release: April 2021 - © 2021 by miniPCR bio™ P./36Additional
Supports
Building a dwarf lemur evolutionary tree
-
In today’s activity, you will look at the cytb gene sequences of the eight individual lemurs that you
analyzed in the first part of this lab. These sequences were obtained by sequencing the DNA of
organisms caught in the field in Madagascar. You will also analyze animals that belong to two other
species of dwarf lemur: C. major (greater dwarf lemur), C. medius (fat-tailed dwarf lemur), and
finally, you will analyze the sequence of one species from a different genus of lemurs: Microcebus
murinus (grey mouse lemur). These other sequences were collected from the online sequence
database GenBank.
Data to be analyzed:
Source of data Genus Species Number of individuals
Data collected from Cheirogaleus ? 8
Tsinjoarivo
Data from GenBank Cheirogaleus major 3
Data from GenBank Cheirogaleus medius 3
Data from GenBank Microcebus murinus 1
For each of the 15 lemurs, you will analyze all 1,140 bp of the cytb sequence. To compare many DNA
sequences by hand would be extremely difficult and time consuming, so scientists use powerful
computers and complex algorithms.
Bioinformatics is the field of biology that uses computers to analyze biological data, including
genetic sequences. Bioinformatics combines computer science, statistics, and biology to look at
large complex data in ways that would be impossible to do by hand. Today, you will use a program
provided by EMBL-EBI (European Molecular Biology Laboratory - European Bioinformatics
Institute). EMBL-EBI is one of a few large publicly funded bioinformatics resources available on the
internet. We will use the program Simple Phylogeny, which, as its name suggests, is designed to
give relatively quick results to tree-building problems. Often scientists will use much more powerful
algorithms that take hours or even days to run. Simple Phylogeny will build our trees in a couple of
minutes.
miniPCR bio Learning LabsTM. Conservation Genetics Lab Instructor’s and Student’s Guide
Version: 1.0 - Release: April 2021 - © 2021 by miniPCR bio™ P./37Additional
Supports
Accessing your data
-
1. Download the sequence file Lemur_Sequences.txt from the following web address:
https://www.minipcr.com/wp-content/uploads/Lemur_sequences.txt
2. Open the file in any text editing software.
• For example: Notepad or TextEdit. Microsoft Word or Google Docs will also work.
• If opening in Word, Google Docs or a similar word processor, make sure to save the file as
a .txt file if you make any changes.
The sequences in this file are in FASTA format. FASTA is a file format widely used in bioinformatics
because it is a simple way of organizing sequence data that can be accessed easily by many
different programs and programming languages.
In FASTA format, a new sequence is marked by a “greater than” (>) symbol. Everything written after
the > is considered identifying information until a paragraph mark (new line) is reached. Starting
with the new line, everything is considered part of the sequence, ignoring numbers, spaces and
new line entries. The sequence ends when a new line starts with a > (indicating the start of the next
sequence) or the end of the document is reached.
For example, the following two DNA sequences are identical, and while they are formatted
differently, both are written in acceptable FASTA format.
>1 SAMPLE DNA sequence in FASTA format
gcgcgattagcgcatcgcgatagatatattttcgatgcgcgcatgctagc
tacgtacatgattacggctatagccgtatataaagcctatgctagggtcc
gataggcccttaaatcgcgtaaggctaatatgtcctctagataatcgatg
>2 SAMPLE DNA sequence in FASTA format
1 GCGCG ATTAG CGCAT CGCGA TAGAT ATATT TTCGA TGCGC GCATG CTAGC
51 TACGT ACATG ATTAC GGCTA TAGCC GTATA TAAAG CCTAT GCTAG GGTCC
101 GATAG GCCCT TAAAT CGCGT AAGGC TAATA TGTCC TCTAG ATAAT CGATG
miniPCR bio Learning LabsTM. Conservation Genetics Lab Instructor’s and Student’s Guide
Version: 1.0 - Release: April 2021 - © 2021 by miniPCR bio™ P./38You can also read