DIGITAL INVESTMENT PREDICTION IN CRYPTOCURRENCY
←
→
Page content transcription
If your browser does not render page correctly, please read the page content below
International Research Journal of Engineering and Technology (IRJET)                                           e-ISSN: 2395-0056
           Volume: 09 Issue: 05 | May 2022                  www.irjet.net                                               p-ISSN: 2395-0072

             DIGITAL INVESTMENT PREDICTION IN CRYPTOCURRENCY
                              Sweetha S1 | Vignesh K2 | Vishnupriya B3, Dr. V. Dhanakoti4

                  1,2,3SRM  Valliammai Engineering College - Kattankulathur, Kanchipuram, Tamil Nadu.
      4Associate    Professor, SRM Valliammai Engineering College - Kattankulathur, Kanchipuram, Tamil Nadu.
  -----------------------------------------------------------------------***--------------------------------------------------------------------
Abstract: Bitcoin is a digital currency (cryptocurrency) that is used for digital payment, exchange, and
investment purposes all over the world. Bitcoin is a decentralized good, meaning that no one owns it. Bitcoin has
always been based on the immutable blockchain concept. Bitcoin transactions are simple because they are not
tied to any country. Different marketplaces are known as "bitcoin exchanges" are available for investment. These
enable people to own and trade Bitcoins in a variety of currencies. Mt Gox is the most well-known Bitcoin
exchange. Bitcoins are stored in a digital wallet, which functions similarly to a bank account. A place called
Blockchain stores the history or record of all transactions as well as the timestamp data. A block is a single record
in a blockchain. Each block has a reference to the previous data block. On the blockchain, all data is encrypted at
all times. The value of Bitcoin fluctuates similarly to that of a stock, but in a different way. For stock market price
prediction, enormous algorithms are used. The factors that influence Bitcoin, on the other hand, are distinct. As a
result, predicting the value of Bitcoin is critical to making informed investment decisions. Unlike the stock
market, the value of Bitcoin is unaffected by economic events or government intervention. As a result, we believe
that forecasting the value of a single bitcoin is essential. Cryptocurrency (Bitcoin) is gaining popularity in this
decade and is proving to be a lucrative investment for traders. Bitcoin's price fluctuates, unlike stocks or other
foreign exchanges, because it trades 24 hours a day, seven days a week. Traders and investors need a way to
accurately predict the Bitcoin price trend to reduce risk and increase capital gain. Many previous works on
cryptocurrency value prediction have had lower accuracy and have not been cross-validated.

Keywords: RNN(Recurrent Neural Network), Minmax Scaling, LSTM(Long Short-Term Memory), BTC[CAD].

1. Introduction                                                             it in real-time. Each paper has its own set of
                                                                            methodologies for predicting bitcoin prices. In
         Because of advancements in financial                               proportion to how many people can predict and how
technology, a new type of asset known as cryptocurrency                     many cannot, the market is extremely volatile, which
has emerged, as well as a significant research                              presents an opportunity in terms of prediction. In
opportunity. Price volatility and dynamism are so                           addition, Bitcoin has set a benchmark in cryptocurrency
numerous, that forecasting cryptocurrency value is a                        around the world with growing improvements over time.
complicated process. Hundreds of thousands of                               It functions on a decentralized, peer-to-peer, and
cryptocurrencies are in use across the globe. Bitcoin has                   trustless system in which all transactions are posted to
recently become a household pet due to its incredible                       an open ledger called the blockchain. Other financial
growth, unpredictable irregularity, and engaging                            markets have never seen such transparency.
applications. While the cryptocurrency market is still
unproven and untested as a viable currency, it is                           Although various theories and algorithms for predicting
undeniably a promising concept backed by solid                              bitcoin prices have been developed, the majority of them
blockchain technology. As a result, predicting the                          have been shown to need to be reconsidered to avoid
cryptocurrency market is just as important as predicting                    overfitting and errors caused by large datasets. The
the traditional stock market.                                               LSTM algorithm can be used to forecast bitcoin's future
                                                                            value. The LSTM is very efficient and gives us the most
Machine learning (ML) is a type of artificial intelligence                  precise results. We can save a large amount of data and
that uses past data to predict the future. Prior research                   predict the most accurate results by using this algorithm.
has shown that ML-based models have several
advantages over other forecasting models, including                         2. Methodology
delivering a prediction that is close to or identical to the
actual result and improving the accuracy of the outcome.                    2.1 Machine Learning
Neural networks (NN), support vector machines (SVM),
                                                                                    The Machine Learning forecasting algorithm
and deep learning are examples of machine learning
                                                                            employs more complex features and predictive methods,
concepts. We discovered the advantages and
                                                                            but the method's main goal is to improve prediction
disadvantages of bitcoin value prediction by combining
                                                                            accuracy while lowering the loss function (sum of
information from various reference papers and applying
                                                                            squares due to errors in prediction).

© 2022, IRJET           |    Impact Factor value: 7.529               |     ISO 9001:2008 Certified Journal                  |   Page 274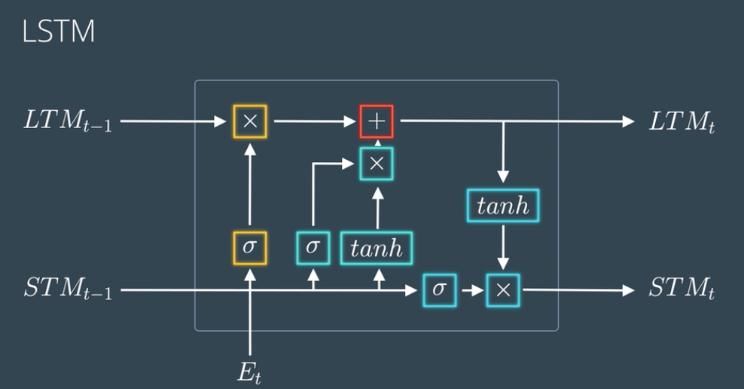
International Research Journal of Engineering and Technology (IRJET) e-ISSN: 2395-0056
Volume: 09 Issue: 05 | May 2022 www.irjet.net p-ISSN: 2395-0072
2.2 Deep Learning in this work to build a deep learning model. There are 9
columns and 1098 rows in the entire dataset. The
Deep Learning is a popular method for time dataset's CSV file contains prices based on a variety of
series forecasting because it can learn and handle factors, including open, high, closing market price,
temporal dependence and structures like trends and market volume, and weighted price.
seasonality, as well as handle arbitrary complex input-
output mappings and support multiple inputs and 3.2 DATA PRE-PROCESSING
outputs.
This is the most important step in deep learning
2.3 Recurrent Neural Network because it aids in the development of a high-accuracy
model for analysis. Data collected from the site is
A type of Neural Network is a Recurrent Neural converted to a clean data set in this step. The data is then
Network (RNN). The output of the previous step is used divided into two groups: testing and training. (For
as the input to the current step. The hidden state is the instance, data can be divided into 80 percent training
most important feature of RNN. The hidden state keeps data and 20% testing data.)
track of some sequence information. RNN has a
"memory" that stores all information about the 3.3 DATA SCALING PHASE
calculations. It uses the same parameters for each input
because it produces the same output by performing the
The data is scaled here to meet the model's
same task on all inputs or hidden layers. Unlike other
requirements. It reshapes data to improve the model's
neural networks, this reduces the complexity of the
suitability.
parameters.
3.4 MODEL-BUILDING PHASE
3. Proposed System
The proposed system is an automated The best-performing model is built using the
application that uses machine learning and a technical pre-processed data. Tensor flow is used as the backend
trend indicator to predict a price increase in engine, and Keras is used to improve the prediction
cryptocurrency for various time series. With weekly model's accuracy.
price prediction, we also try to answer the question:
Does cryptocurrency like Bitcoins have the potential to 3.5 MODEL LEARNING PHASE
become a primary method of transaction, replacing the
US Dollar and other traditional currencies? After the training data has been defined, the
model is configured to begin the learning phase. The
The advanced approach for developing a deep learning compile method of the Keras sequential model is used to
model to predict bitcoin coin values includes the accomplish this. The data is passed to the model for
following steps: training after the fully configured neural network has
been defined. The fit method is used to accomplish this.
The model is trained using an LSTM(Long Short-
Term Memory)-based classifier that uses BTC-CAD 3.6 EVALUATION
cost information.
This is an important component because it aids
The use of BTC-CAD cost information and news in the selection of the best model for representing data
announcements related to crypto enables us to value and the accuracy of the prediction. The model is fed
the significance of these distinct sources and types of input values, and the output is the predicted value. To
information. calculate accuracy and RMSE values, the output is
compared to the testing data.
The proposed method for developing a deep learning
model to forecast bitcoin coin prices included the Time-Series data is a type of sequential data in which the
following steps: occurrence of events is determined by the passage of
time. If a proper output is to be obtained from the data, a
3.1 GATHERING DATA network with access to prior knowledge is required to
fully comprehend the data. A Recurrent Neural Network
The need for a dataset is entirely dependent on is used to accomplish this.
the project. The data can come from a variety of places,
including files, databases, and even sensors. Kaggle.com It uses its internal state to process sequential data
provided the dataset of bitcoin (BTC[CAD]) values used (memory).
© 2022, IRJET | Impact Factor value: 7.529 | ISO 9001:2008 Certified Journal | Page 275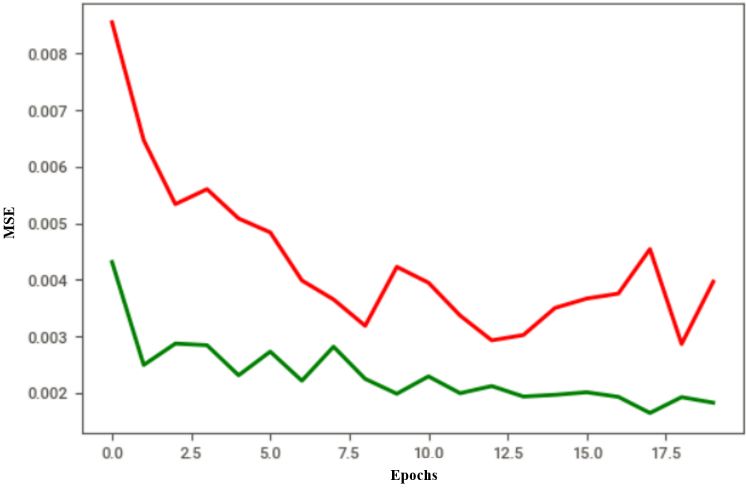
International Research Journal of Engineering and Technology (IRJET) e-ISSN: 2395-0056
Volume: 09 Issue: 05 | May 2022 www.irjet.net p-ISSN: 2395-0072
There are three layers in total: but it is most commonly used in classification. Each data
value in SVM is plotted in n-dimensional space, with each
The input is received by the input layer, which is feature representing a coordinate in the space. The two
defined by its weights and biases ( in sigmoid classes are distinguished by classification, which forms
function ). the hyper-plane for excellent class differentiation. The
thumb rule for identifying the hyperplane is to choose
The activation function is applied here, and the the hyperplane that separates the two classes the best.
output is sustained in the output layer.
4. System Architecture
When long-term dependencies are present, this type of
neural network faces the problem of vanishing gradient. A quick method for predicting cryptocurrency values:
Because the parameters are so large, data training
becomes a challenge. Many solutions have been Obtaining real-time cryptocurrency information
developed to address this issue. Gather information for training and testing units.
Using deep learning and the LSTM neural network
The LSTM and GRU solve the long term dependencies architecture, predict the price of the cryptocurrency.
successfully – Create a visual representation of the prediction
results.
Long Short Term Memory (LSTM): The advancement
of recurrent neural network architecture used in deep
learning models to deal with the problem of vanishing
gradient of RNN is known as long short term memory. In
terms of module architecture, LSTM differs from RNN.
The RNN has only one neural network layer, whereas the
LSTM has four layers that interact to produce output.
Gated Recurrent Unit (GRU): The advanced version of
the LSTM neural architecture, the gated recurrent unit,
also solves problems with long-term dependencies. The
LSTM and GRU neural networks produce similar results
at times, but their architecture is different. This network
is capable of simultaneously managing long-term and
(Figure-4.1 - Architecture of the proposed system)
short-term dependencies. The LSTM network's three
gates are replaced by two gates in GRU, reducing the
We use Python and Flask to deploy our model to the
network's complexity.
website. The dataset is prepared for the deep learning
model, and all of the changes are passed on to the
Convolution Neural Network(CNN): A convolution
framework, which employs user interfaces. Authorized
neural network (CNN) is another important deep
licensed use is limited to obtaining user data before
learning algorithm that has made significant progress in
making a prediction.
the field of computer vision. This neural network is
related to the mathematical term convolution, as the
The deployment is carried out in the following manner:
name suggests. In comparison to other deep learning
algorithms, data preprocessing is much less. CNN's
architecture is similar to that of fully connected The file containing the code for the LSTM model for
networks found in the brain. A layer's single neuron is bitcoin price prediction is saved in the same
connected to all neurons in the adjacent layer. The data directory as the files below.
is overfitted as a result of these fully connected Another file is created, containing Flask APIs that
networks. Because this network cannot remember, it receive data from the user via GUI or API calls.
only considers the input rather than the hidden state, as
an RNN does. Inside the file, a request module will be created,
which will be used to call an API and display the
Support Vector Machine(SVM): We developed SVM as returned value.
a machine learning regressor algorithm to compare our Finally, HTML templates and CSS styling are created
deep learning models. In comparison to another to develop Flask's GUI and are saved in the same
backpropagation algorithm, it has proven to be a good directory as the other files.
prediction algorithm for stock prices. This algorithm can
be used in both classification and regression problems,
© 2022, IRJET | Impact Factor value: 7.529 | ISO 9001:2008 Certified Journal | Page 276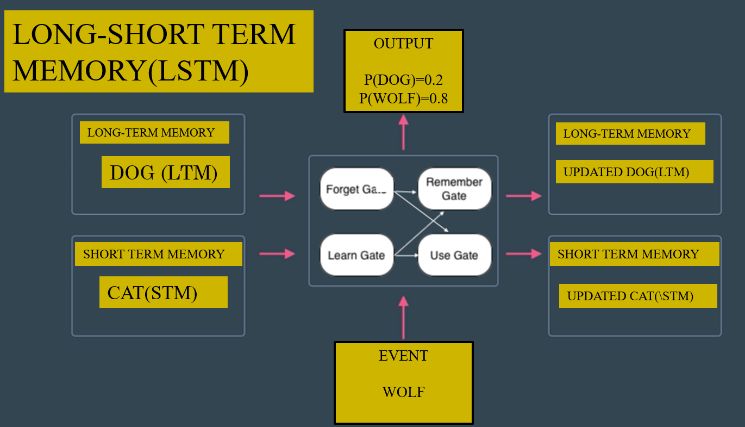
International Research Journal of Engineering and Technology (IRJET) e-ISSN: 2395-0056
Volume: 09 Issue: 05 | May 2022 www.irjet.net p-ISSN: 2395-0072
4.1 Technologies Used
4.1.1 ANACONDA: Anaconda is the most popular
Python distribution platform for data science and
machine learning, as well as dealing with large data and
its predictions. It includes a variety of environments,
including Spyder, Jupyter notebook, Jupyter lab, and
Pycharm, all of which can be run and maintained
independently. Its cloud repository contains
approximately 7500 packages. Instead of using
command line commands, the Anaconda Navigator, a
desktop GUI that comes with the Anaconda individual (Figure-4.2-Graph of the trained and tested dataset)
edition, can be used.
4.2.2 Normalize_min_max
4.1.2 FLASK: Flask is a Python web framework that
allows users to create applications such as web pages, After the train test split, the developed model is
blogs, and wikis using its tools and libraries. It's a scaled using the cyclic learn min-max scalar, as
Unicode-based debugger and development server. In the shown in Figure 4.1.
project, this framework is used to deploy the built model. Because scaling may cause data leakage from the
test to the train set, this is done after the training
4.2 Modules and testing phases.
The Min-max scalar converts each data point into a
4.2.1 Train_test_split range of zeros to ones.
After that, the data generator function is used to
As shown in Figure-4.1, the entire dataset is divided prepare our data for the LSTM model feed.
into two sets: a train dataset and a test dataset.
Items in the train dataset are compromised from the def normalise_zero_base(df):
start to the end of the prediction days. return df / df.iloc[0] - 1
The test dataset contains all values from a specific
index that is between the entire length of the series def normalise_min_max(df):
and the prediction days, i.e. the back dataset. return (df - df.min()) / (data.max() -
Once the process is complete, the Technical Trend df.min())
Indicator is used to generate a graph (Figure-4.2).
def extract_window_data(df, window_len=5
def train_test_split(df, test_size=0.2): , zero_base=True):
split_row = len(df) - window_data = []
int(test_size * len(df)) for idx in range(len(df) - window_len):
train_data = df.iloc[:split_row] tmp = df[idx: (idx + window_len)].copy(
test_data = df.iloc[split_row:] )
return train_data, test_data if zero_base:
train, test = train_test_split(hist, test_size=0. tmp = normalise_zero_base(tmp)
2) window_data.append(tmp.values)
return np.array(window_data)
def line_plot(line1, line2, label1=None, label
2=None, title='', lw=2): def prepare_data(df, target_col, window_len
fig, ax = plt.subplots(1, figsize=(13, 7)) =10, zero_base=True, test_size=0.2):
ax.plot(line1, label=label1, linewidth=lw) train_data, test_data = train_test_split(df,
ax.plot(line2, label=label2, linewidth=lw) test_size=test_size)
ax.set_ylabel('price [CAD]', fontsize=14)
ax.set_title(title, fontsize=16) X_train = extract_window_data(train_data
ax.legend(loc='best', fontsize=16); , window_len, zero_base)
X_test = extract_window_data(test_data,
line_plot(train[target_col], test[target_col], ' window_len, zero_base)
training', 'test', title='')
y_train = train_data[target_col][window_l
en:].values
© 2022, IRJET | Impact Factor value: 7.529 | ISO 9001:2008 Certified Journal | Page 277International Research Journal of Engineering and Technology (IRJET) e-ISSN: 2395-0056
Volume: 09 Issue: 05 | May 2022 www.irjet.net p-ISSN: 2395-0072
y_test = test_data[target_col][window_len X_train, output_size=1, neurons=lstm_neu
:].values rons, dropout=dropout, loss=loss,
optimizer=optimizer)
if zero_base: history = model.fit(
y_train = y_train / train_data[target_col X_train, y_train, validation_data=(X_test, y
][:-window_len].values - 1 _test), epochs=epochs, batch_size=batch_siz
y_test = y_test / test_data[target_col][:- e, verbose=1, shuffle=True)
window_len].values - 1
import matplotlib.pyplot as plt
return train_data, test_data, X_train, X_tes plt.plot(history.history['loss'],'r',linewidth=
t, y_train, y_test 2, label='Train loss')
plt.plot(history.history['val_loss'], 'g',linewi
dth=2, label='Validation loss')
4.2.3 Build_Lstm_model plt.title('LSTM')
plt.xlabel('Epochs')
We will face a VANISHING GRADIENT PROBLEM in plt.ylabel('MSE')
our model because we are working with a large set plt.show()
of data and multiple RNN layers.
LSTM is used to solve this problem because it is
capable of recalling RNN weights and inputs over a
long period.
We predict validation loss and dataset loss using
lstm to find epochs, then mean square error, as
shown in Figure-4.3.
The trained dataset is indicated by the red line, while
the tested dataset is indicated by the green line.
def build_lstm_model(input_data, output_si
ze, neurons=100, activ_func='linear',
dropout=0.2, loss='mse', optimiz
er='adam'):
model = Sequential() (Figure-4.3 - Generated graph of LSTM model)
model.add(LSTM(neurons, input_shape=(
input_data.shape[1], input_data.shape[2])))
4.2.4 Inverse_Transform
model.add(Dropout(dropout))
model.add(Dense(units=output_size))
For prediction, we use Inverse Transform to convert
model.add(Activation(activ_func))
the 0's and 1's values back to normal values.
model.compile(loss=loss, optimizer=opti
mizer) It takes any probability distribution and generates a
return model random number.
np.random.seed(42) The graph shows the actual and predicted values
window_len = 5 (Figure-4.4).
test_size = 0.2
zero_base = True targets = test[target_col][window_len:]
lstm_neurons = 100 preds = model.predict(X_test).squeeze()
epochs = 20 mean_absolute_error(preds, y_test)
batch_size = 32
loss = 'mse' from sklearn.metrics import mean_squared
dropout = 0.2 _error
optimizer = 'adam' MAE=mean_squared_error(preds, y_test)
MAE
train, test, X_train, X_test, y_train, y_test = p
repare_data( from sklearn.metrics import r2_score
hist, target_col, window_len=window_len, R2=r2_score(y_test, preds)
zero_base=zero_base, test_size=test_size) R2
model = build_lstm_model( preds = test[target_col].values[:-
window_len] * (preds + 1)
© 2022, IRJET | Impact Factor value: 7.529 | ISO 9001:2008 Certified Journal | Page 278International Research Journal of Engineering and Technology (IRJET) e-ISSN: 2395-0056
Volume: 09 Issue: 05 | May 2022 www.irjet.net p-ISSN: 2395-0072
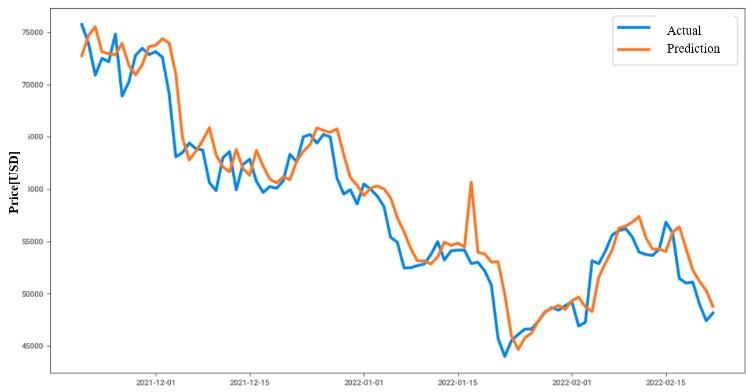
preds = pd.Series(index=targets.index, data known as cells. The cell state and the hidden state are
=preds) both transferred to the next cell. Memory blocks are in
line_plot(targets, preds, 'actual', 'prediction' charge of remembering things, and memory
, lw=3) manipulation is accomplished through three major
mechanisms known as gates.
5.1 Forget Gate: As shown in Figure 5.3, the LTM enters
the forget gate and forgets information that is no longer
useful. The sigmoid layer is responsible for this.
(Figure-4.4 - Graph of actual and predicted value)
5. Algorithm of the overall process
(Figure - 5.3 – Forget Gate)
5.2 Learn Gate: As shown in Figure 5.4, the event
(current input) and STM are combined so that the
necessary information learned from STM can be applied
to the current input.
(Figure-5.1 - LSTM Architecture)
The mathematical architecture of the Long-Short Term
Memory(memory) is shown in the following Figure-5.2 (Figure - 5.4 – Learn Gate)
5.3 Remember Gate: Remember gate combines LTM
information that we haven't forgotten with STM and
Event to create an updated LTM as shown in Figure 5.5.
(Figure-5.2 – Mathematical Architecture of LSTM)
LSTMs deal with both Long Term Memory (LTM) and (Figure - 5.5 – Remember Gate)
Short Term Memory (STM), and they use the concept of
5.4 Use Gate: As shown in Figure 5.6, this gate also uses
gates to make calculations simple and effective, as shown
LTM, STM, and Event to predict the output of the current
in the LSTM architecture diagram (Figure-5.1). A typical
event, which functions as an updated STM.
LSTM network is made up of various memory blocks
© 2022, IRJET | Impact Factor value: 7.529 | ISO 9001:2008 Certified Journal | Page 279International Research Journal of Engineering and Technology (IRJET) e-ISSN: 2395-0056
Volume: 09 Issue: 05 | May 2022 www.irjet.net p-ISSN: 2395-0072
combination of the activations from the previous layer
along with weight vectors. As a result, this activation is
linear. It could be passed as a parameter to the previous
dense layers if desired.
The long short-term memory network, or LSTM, is a
recurrent neural network that addresses the problem of
disappearing gradients. This is a type of recurrent neural
network used in profound learning because it can train
very large architectures. As a result, the network can
(Figure - 5.6 – Use Gate) develop long-term trust. The forget and remember gates
in an LSTM cell allow the cell to decide whether to block
The RNN (Recurrent Neural Network with Long Short- or transmit information based on its strength and
Term Memory) is a type of artificial neural network that importance.
connects nodes to form a directed graph along a
sequence, allowing the network to exhibit dynamic As a result, weak signals that keep the gradient from
temporal behavior for a time sequence. Long short-term dissolving can be blocked. The RNN and LSTM network's
memory networks (LSTM) are a type of RNN that can performance is evaluated to determine the model's
learn long-term dependencies, making them ideal for effectiveness and efficiency. The input, output, and forget
predicting time-series data like cryptocurrency price gates of the LSTM unit are used to control the data that
trends. flows in and out of the unit. These gates are also used to
remember values over arbitrary time intervals of 15
The main feature of LSTM networks is that each neuron seconds. To handle possible lags in time series, LSTM is
can hold a state and can remove or add information to it commonly used for classifying and making predictions
using custom structures called gates. A sigmoid neural based on time series data.
network layer and a pointwise multiplication operation
are used to create these gates. A sigmoid layer produces 6. Advantages of the Proposed System
a value between 0 and 1 that represents the amount of
each component that is allowed through. The system makes use of efficient technologies to
make it more robust, resulting in accurate and
Three gates regulate and control the state of the neurons promising results.
in an LSTM neural network.
The model developed with LSTM is more accurate
The first step in an LSTM process is deciding what than traditional deep learning models.
information from the cell state to discard. The forget
gate makes this decision based on the previous In our case, LSTM (Long Short-Term Memory) is an
output and current input. efficient learner in terms of recognizing long-term
Based on the previous state and the new input, the dependencies in training data.
next step is to determine the neuron's new state,
which is controlled by another gate called the input This project uses daily Bitcoin price fluctuations to
gate. investigate the model's future predictability with
The final step is to filter the updated state and hourly price fluctuations.
calculate the neuron's final output. The output gate
will make this decision based on the current input 7. Performance Analysis
and the updated state of the cell while keeping a
The LSTM is much better at learning long-term
copy for the next input.
dependencies in terms of temporal length. As a result,
LSTM layer: The LSTM layer is the internal one, and all of selecting a long window had a lower impact on the
the gates mentioned earlier are implemented using LSTM. The autocorrelation lag was used as a guideline in
Keras, with a hard-sigmoid activation by default. this process, which was similar to the RNN. On smaller
window sizes, the LSTM performed poorly. The most
Dropout layer: This comes before the dense layer. A accurate method was LSTM. The performance benefits of
dropout can be added after any hidden layer in Keras, parallelizing machine learning algorithms on a GPU are
but we do so after the LSTM. evident in the training of the LSTM model, which
improved by 70.7 percent. It may be possible to achieve
Dense layer: This is a connected layer. better results by approaching the task solely from the
standpoint of classification.
Activation layer: Because we're dealing with a regression
problem, the final layer should provide a linear
© 2022, IRJET | Impact Factor value: 7.529 | ISO 9001:2008 Certified Journal | Page 280International Research Journal of Engineering and Technology (IRJET) e-ISSN: 2395-0056
Volume: 09 Issue: 05 | May 2022 www.irjet.net p-ISSN: 2395-0072
8. Conclusion [3] E. Pintelas, “Fundamental Research Questions and
Proposals on Predicting Cryptocurrency Prices Using
The LSTM is much better at learning long-term DNNs”, 2020. Available:
dependencies in terms of temporal length. As a result, http://hdl.handle.net/10889/13296
selecting a long window had a lower impact on the
LSTM. The auto-correlation lag was used as a guideline [4] E. S. Karakoyun and A. O. Cibikdiken, "Comparison of
in this process, which was parallel to the RNN. On ARIMA Time Series Model and LSTM Deep Learning
smaller window sizes, the LSTM performed poorly. The Algorithm for Bitcoin Price Forecasting", The 13th
highest accuracy was achieved by LSTM. The Multidisciplinary Academic Conference in Prague 2018
performance benefits of parallelizing machine learning (The 13th MAC 2018), pp. 171-180, 2018.
algorithms on a GPU are evident in the training of the
LSTM model, which improved by 70.7 percent. Looking [5] H. Jang and J. Lee, "An Empirical Study on Modeling
at the task solely from the perspective of vast and Prediction of Bitcoin Prices With Bayesian Neural
classification, it may be possible to improve prediction Networks Based on Blockchain Information," in IEEE
output. RNN and LSTM deep learning models are Access, vol.06, pp. 5427-5437, 2018.
effective for Bitcoin prediction, with the LSTM being
more capable of recognizing longer-term dependencies. [6] Hota HS, Handa R & Shrivas AK, “Time Series Data
Overall, given the numerous forces influencing the Prediction Using Sliding Window Based RBF Neural
market, predicting a price-related variable is difficult. Network”, International Journal of Computational
Add in the fact that prices are heavily influenced by Intelligence Research, Vol.13, No.05, pp. 1145-1156,
prospects rather than historical data. However, we now 2017.
have a better understanding of Bitcoin and the LSTM
[7]
architecture thanks to the use of deep neural networks.
http://wp.firrm.de/index.php/2018/04/13/building-a-
Implementing hyperparameter tuning to obtain a more
lstm- network-completely-from-scratch-no-libraries/
accurate network architecture is currently in progress.
Other characteristics can also be considered (although [8] I. Madan, S. Saluja, and A. Zhao, “Automated Bitcoin
from our experiments with Bitcoin, more features have Trading via Machine Learning Algorithms,” URL
not always led to better results). http//cs229. Stanford. edu/proj2014/Isaac\% 20Madan,
vol. 20, pp. 1–5, 2015
Various deep learning algorithms, such as GRU,
LSTM, and CNN, were found to be successful in [9] Jang Huisu, Jaewook Lee, Hyungjin Ko, Woojin Le,
prediction, and they were compared to the machine “Predicting Bitcoin price using Rolling Window LSTM
learning algorithm SVM. Deep learning models are model”, DSF, ACM ISBN 123-4567-24- ^567/08/06,
thought to take a long time to train. Because bitcoin price vol.04, pp. 550- 580, 2018.
prediction is based on a large dataset, it was a difficult
task. Without real-time deployment, machine learning or [10] John Mern1, Spenser Anderson1, John
deep learning models are useless. API was created Poothokaran1, “A Using Bitcoin Ledger Network Data to
specifically for this purpose. This is our current work in Predict the Price of Bitcoin”
progress.
[11] K. Gunawardana, “Predicting stock price
9. Future Work performance: A neural network approach”, 2007.
There is always room for improvement as we [12] L. Kristoufek, “What are the main drivers of the
work. It is possible to increase the number of neurons. bitcoin price? Evidence from wavelet coherence
Large column data sets will yield better results. It is analysis,” PLoS One, vol. 10, no. 4, pp. 1–15, 2015.
always better to include more features or parameters.
We can also develop an android app or a website for the [13] L. Piehl and T. Kaizoji, "Volatility Analysis of Bitcoin
same in the future, depending on our needs. Price Time Series", Quantitative Finance and Economics,
vol. 1, no. 4, pp. 474-485, 2017.
10. References
[14] M. Balcilar, E. Bouri, R. Gupta and D. Roubaud, "Can
[1] A. Greaves and B. Au, “Using the Bitcoin Transaction volume predict Bitcoin returns and volatility? A
Graph to Predict the Price of Bitcoin,” 2015. quantiles-based approach", Economic Modelling, vol. 64,
pp. 74-81, 2017.
[2] Amin Azari, “A Bitcoin Price Prediction: An ARIMA
Approach an” Available at: [15] M. Briaere, K. Oosterlinck, and A. Szafarz, “Virtual
https://www.researchgate.net/publication/328288986, currency, tangible return: Portfolio diversification with
2018. Bitcoins”, 2013.
© 2022, IRJET | Impact Factor value: 7.529 | ISO 9001:2008 Certified Journal | Page 281International Research Journal of Engineering and Technology (IRJET) e-ISSN: 2395-0056
Volume: 09 Issue: 05 | May 2022 www.irjet.net p-ISSN: 2395-0072
[16] M. Chen, N. Narwal, and M. Schultz, “Predicting Price and Replies", PLOS ONE, vol. 11, no. 8, pp. e0161197,
Changes in Ethereum,” no. 2016, pp. 1–6, 2017. 2016.
[17] M. Matta, I. Lunesu, and M. Marchesi, “Bitcoin [31] Y. Sovbetov, "Factors Influencing Cryptocurrency
Spread Prediction Using Social And Web Search Media,” Prices: Evidence from Bitcoin Ethereum Dash Litcoin and
UMAP Work. 2015, 2015. Monero", Journal of Economics and Financial Analysis,
vol. 2, no. 2, pp. 1-27, 2018.
[18] M. Muzammal, Q. Qu and B. Nasrulin, "Renovating
blockchain with distributed databases: An open source
system", Future Generation Computer Systems, vol. 90,
pp. 105-117, 2019.
[19] McNally, Sean & Roche, Jason & Caton, Simon,
“Predicting the Price of Bitcoin Using Machine Learning”,
2018.
[20] O. Poyser, “Exploring the determinants of Bitcoin's
price: an application of Bayesian Structural Time Series”
[Online].
[21] Q. Guo, S. Lei, Q. Ye, and Z. Fang, ‘‘MRC-LSTM: A
hybrid approach of multi-scale residual CNN and LSTM
to predict bitcoin price”, 2021.
[22] Ruchi Mittal, Shefali Arora, M.P.S Bhatia,
“Automated cryptocurrencies price prediction using
machine learning”, an ICTACT JOURNAL ON SOFT
COMPUTING, Vol.08, Issue.07, 2018.
[23] S. Nakamoto, “Bitcoin: A Peer-to-Peer Electronic
Cash System”, Available at: https://Bitcoin.org/Bitcoin.
Accessed in 2008.
[24] S. Mcnally, Jason Roche, Simon Caton, “Predicting
the Price of Bitcoin using Machine Learning”, 26th
Euromicro International Conference on Parallel,
Distributed and Network-based Processing(PDP), 2018.
[25] S. Siami-Namini and A. S. Namin, Forecasting
Economics and Financial Time Series: ARIMA vs. LSTM,
vol. abs/1803.06386, 2018.
[26] Siddhi Velankar, Sakshi, Valecha, Shreya Maji, “A
Bitcoin Price Prediction using Machine Learning”, 20th
International Conference on Advanced Communication
Technology (ICACT) on, vol.05, pp. 855- 890, 2018.
[27] Sin, Edwin & Wang, Lipo, “Bitcoin price prediction
using ensembles of neural networks”, 2017.
[28] T. Awoke, ‘‘Bitcoin price prediction and analysis
using deep learning models,’’ in Communication
Software and Networks. Singapore: Springer, 2021.
[29] T. Guo and N. Antulov-Fantulin, “Predicting short-
term Bitcoin price fluctuations from buying and sell
orders,” 2018.
[30] Y. B. Kim et al., "Predicting Fluctuations in
Cryptocurrency Transactions Based on User Comments
© 2022, IRJET | Impact Factor value: 7.529 | ISO 9001:2008 Certified Journal | Page 282You can also read