DIE GROSSE WIEDERERÖFFNUNG: NEUE CHANCEN, BEKANNTE RISIKEN - WIE KANN IHR UNTERNEHMEN DAS WACHSTUM OPTIMAL FÜR SICH NUTZEN? - Euler Hermes
←
→
Page content transcription
If your browser does not render page correctly, please read the page content below

DIE GROSSE WIEDERERÖFFNUNG:
NEUE CHANCEN, BEKANNTE RISIKEN.

WIE KANN IHR UNTERNEHMEN DAS
WACHSTUM OPTIMAL FÜR SICH NUTZEN?

              Webinar 29.06.2021
IHRE REFERENTEN

          Ludovic Subran             Anna-Katharina Wichmann
                Chef-Volkswirt              Vertriebsdirektorin
          Allianz und Euler Hermes         Euler Hermes DACH

                                                                  2
©Mārtiņš Zemlickis

GRAND
                       Textmasterformat bearbaiting

REOPENING:
NEW
OPPORTUNITIES,
OLD RISKS

Allianz Research
June 29, 2021

 © Copyright Allianz
Textmasterformat bearbaiting
MESSAGE #1: VACCINES SECURITY MATTERS
Expected date of herd immunity Asia relapse: Sanitary situation vs. stringency & mobility
(at current vaccination speed) impact, as of end of May (bubble size = vaccine doses administered
as % of population; pink bubbles where stringency increased over past month)
1,5 EU Mexico 5
Argentina Indonesia South Africa New Zealand
Japan 0 South Korea
70% of adult1 Indonesia
population Thailand
Brazil Egypt -5 Hong Kong
Turkey
Stringency x Mobility
0,5 Chile Japan
USA -10 Australia Thailand
0 -15
Vietnam
-20
-0,5 EU Turkey
Brazil Philippines
Egypt -25 Singapore
Vulnerable-1 Japan
Thailand Taiwan
population Indonesia -30
Mexico
(+65y)
Chile USA Argentina -35
-1,5
01-21 07-21 02-22 08-22 03-23 10-23 04-24 11-24 05-25 12-25 06-26 -10 0 10 20 30 40 50 60
Daily new Covid-19 cases per 1mln people, 7-day average
Sources: Our World in Data, Duke University, Allianz Research Sources: Our World in Data, University of Oxford, Google, Allianz Research
Most countries should reach herd immunity (1st dose) by the Ultimately, vaccination is likely to determine the pace of the
summer, but demand-side hurdles will be more and more visible. return-to-normal. APAC is a case in point: many economies
Advanced economies seem overall closer to ‘normality’, while had managed the pandemic well in 2020, but they recently
EMs are still likely to remain ‘closed’ due to the supply gap in had to implement restrictions again amidst new outbreaks
vaccines.
© Copyright Allianz
and low vaccination rates. 4
Textmasterformat bearbaiting
MESSAGE #2: FROM K-SHAPE TO V-SHAPE
Mobility data, level compared to pre-crisis Global demand by sector Container traffic volumes
(New orders + Backlogs of work) (12m/12m)
30
Germany Belgium United Kingdom
20% North America to Asia
115
United States France Netherlands Europe to Asia
10
110
Asia to North America
15%
105 Asia to Europe
-10
100
10%
95
-30
90 5%
-50 85 Consumer Goods Consumer Services
0%
80
Industrials Technology
-70 75
Basic Materials -5%
70
01/01/2021
01/02/2021
01/03/2021
01/04/2021
H1 2010
H2 2010
H1 2011
H2 2011
H1 2012
H2 2012
H1 2013
H2 2013
H1 2014
H2 2014
H1 2015
H2 2015
H1 2016
H2 2016
H1 2017
H2 2017
H1 2018
H2 2018
H1 2019
H2 2019
H1 2020
H2 2020
-90
02-20 04-20 06-20 08-20 10-20 12-20 02-21 04-21
-10%
2016 2017 2018 2019 2020 2021
Sources: various, Euler Hermes, Allianz Research Sources: Markit, Euler Hermes, Allianz Research Sources: Markit, Euler Hermes, Allianz Research
Mobility has picked up strongly over the Global demand prospects have The US is indeed the driving force of the
course of May and should continue to accelerated strongly since the start of the recovery, but this is also capturing a lot of
recover significantly in June amid greater year and stand at a record high level the global transportation capacity, with
re-openings in most European countries. across all sectors. container prices at a record 5-year high.
© Copyright Allianz 5
Textmasterformat bearbaiting
MESSAGE #3: REVENGE SPENDING TO ABSORB
ONLY PART OF RESIDUAL SAVINGS
US retail sales (%, y/y) Eurozone consumer confidence Catch-up consumption expected
vs retail sales growth in 2021, % of GDP
3,0
20
2%
10
2,5
0%
0
-2%
2,0
-10 -4%
1,5
-20 -6%
-8%
-30 1,0
-10%
General economic expectation over the next 12 months
-40
-12% 0,5
Financial situation over the next 12 months
-50
Savings over the next 12 months -14%
0,0
Italy
Norway
Czechia
Netherlands
Germany
Austria
Spain
France
Poland
Denmark
Sweden
US
UK
Belgium
Portugal
Eurozone
-60 Retail sales (3M yoy, rhs) -16%
11 12 13 14 15 16 17 18 19 20 21
Sources: US Census Bureau, Allianz Research Sources: US Census Bureau, Allianz Research Sources: Eurostat, Euler Hermes, Allianz Research
Demand-supportive policies more than Consumer confidence in the Eurozone is close to pre-crisis levels. The glut of household
offset the lack of automatic stabilizers in savings could generate a consumption boom of EUR170bn in 2021. Looking at individual
the short-term. Household consumption is countries, we estimate pent-up consumption could reach 3% of GDP in the US and the UK
expected to grow by +7.8% y/y in 2021 vs in 2021, and around 1.5% in most European countries. Nevertheless, roughly EUR500bn
-3.8% y/y in 2020. of Covid-19 residual savings will still remain at the Eurozone level at end-2021.
© Copyright Allianz 6
Textmasterformat bearbaiting

MESSAGE #4: MULTI-FACETED RECOVERY
                            2019   2020    2021                           2022
                                                                                                                                2022 GDP, compared to 2019 and to pre-crisis forecast
World GDP growth            2.4    -3.5         5.5                       4.1
United States               2.2    -3.5         6.3                       4.0
                                                                                                                      6                                             2022 GDP higher than 2019
                                                                                                                                                                      and pre-crisis forecast
Latin America               0.2    -7.1         5.2                       2.9                                                                                                                               Turkey

                                                                                 % change from pre-crisis forecast
Brazil                      1.4    -4.4         3.8                       2.5                                         4

United Kingdom              1.4    -9.9         6.0                       4.9                                         2
                                                                                                                                                         Netherlands      US
Eurozone members            1.3     -6.5        4.2                       4.2                                         0
Germany                     0.6     -5.1        3.4                       3.8                                                              Germany Russia
France                      1.5     -8.2        5.4                       3.6                                                           France                  Emerging Europe            China
                                                                                                                      -2                         Eurozone        World
Italy                       0.3     -8.9        4.4                       4.6                                                     Italy
                                                                                                                                              Belgium                         Asia-Pacific
Spain                       2.0    -10.8        5.1                       5.3                                         -4        Japan                    Africa
                                                                                                                         South                               Saudi Arabia
Netherlands                 1.6     -3.7        3.0                       4.2                                                                     Brazil
                                                                                                                      -6 Africa           UK
Belgium                     1.8     -6.3        3.5                       4.0                                                                            Latin
                                                                                                                                   Spain
                                                                                                                                                      America
Russia                      2.0    -3.1         3.1                       3.2                                         -8                   Middle East
Turkey                      0.9    1.8          8.3                       4.1                                                2022 GDP lower                                                2022 GDP higher than
                                                                                                                     -10      than 2019 and                                                 2019 and lower than
Asia-Pacific                4.1    -1.1         6.3                       4.8                                               pre-crisis forecast                                              pre-crisis forecast
                                                                                                                                                                            India
China                       6.0    2.3          8.2                       5.4                                        -12
Japan                       0.3    -4.9         2.5                       1.9                                              -5                     0                  5                10                 15
India                       4.1    -7.5         7.9                       6.4                                                                                   % change from 2019
Middle East                 0.0    -5.0         2.8                       3.0                                              Sources: various, Allianz Research
Saudi Arabia                0.3    -4.1         2.4                       2.9
Africa                      1.7    -2.8         2.7                       3.5
South Africa                0.3    -7.0         2.2                       1.9
  © Copyright Allianz                                                                                                                                                                                         7
NB: fiscal year for India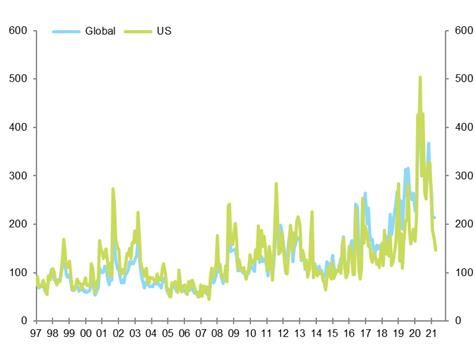
Textmasterformat bearbaiting
MESSAGE #5: STRONG TRADE MOMENTUM DESPITE
SHORT-TERM HURDLES DUE TO BOTTLENECKS
Global trade in goods and services, %y/y Global trade in goods & leading indicator Taiwan production shortfall vs. US &
Asia Pacific North America Eurozone input shortage
Western Europe Central and Eastern Europe
Latin America Middle East and Africa 30 54 6 Production shortfall - Taiwan (HP-filtered)
40
World (volume) World (value)
15,9% 25
53 Input shortage - US & Eurozone (average),
20 rhs
4 30
52
13% 15
10,0% 9,5% 10 51 20
8,4% 2
8% 7,7%
5 50
6,2% 10
5,4% 0
4,3% 49 0
3,8%
3% 3,0% -5
2,4% 0
0,7% -10 48
1,8%
-2
-2% -15 47 -10
-2,0% -1,6%
-20 EH Trade Momentum Index (right 46 Stronger relationship
scale) -4
-7% -25 from April 2012 -20
-8,0% Value global goods trade growth 45
-30 y/y
-10,7%
-12% -9,9% -35 44 -6 -30
14 15 16 17 18 19 20 21 22 07 09 11 13 15 17 19 21 07 08 09 10 11 12 13 14 15 16 17 18 19 20 21
Sources: IHS Markit, IMF, Allianz Research Sources: CPB, Allianz Research Sources: IHS Markit, Allianz Research
We expect global trade to grow by +7.7% in Such a strong pace of growth for full-year The global supply-demand imbalance could
volume in 2021, and by +15.9% in value 2021 is partly ensured by favorable base be exacerbated in Q2 and the summer,
terms, likely driven by robust exports from effects and a stronger-than-expected given the new Covid-19 outbreak in Taiwan
APAC and strong imports in the US, momentum in the first months of the year. – on which the world has become
Europe and China. However, there are short-term risks. increasingly dependent in the electronics
© Copyright Allianz 8
sector.
Textmasterformat bearbaiting
MESSAGE #6: LIVING WITH HIGHER INFLATION
Assessment of shortages and selling price European companies’ pricing power Nominal wage growth (%)
expectations by firms, by sector (Europe) Eurozone
Risk on
profitability 6
Pricing
due to input
Shortage in factor of production - compared to Power
prices Eurozone USA
pre covid levels (*) Selling price
Electricity
Material, equipment & expectations (**)
Labor Pharmaceuticals 5
space
Wood & related 4 25 61 Computers
Paper & related 1 18 61 Consumer
Basic metals 2 8 51 Electronics
Furniture 0 22 47 Food & non-alcoholic 4
Rubber/plastics 0 32 43
beverages
Coke and refined products -2 19 40
Tobacco
Fabricated metal products 3 17 37
Wines from grapes
Electrical equipment 8 27 36 3
Textiles 4 5 35 Automobile
Machinery/equipment -1 14 32 Household
Chemicals -1 16 30 Appliances
Other non-metallic mineral 1 7 30 Diesel/Petrol 2
Food -4 -1 24
Textile
Motor vehicles -2 30 18
Printed media
Computer/electronic -2 22 17
Leather 3 3 14 Cleaning products
Repair/installation -4 10 13 Air transport 1
Other manufacturing -12 -8 13 Postal services
Construction 24 3 11
Telephone services
Beverages -2 -4 10
Restaurants, cafés
Pharmaceuticals -6 -9 4
and the like
0
2011
2012
2013
2014
2015
2016
2017
2018
2019
2020
2021
2022
Wearing -2 1 4
Accommodation
Other transport equipment -7 -10 4
Printing 0 6 3 services
(*) Q2’21 vs. to Q4’19 levels; (**) As of May 2021 surveys
Sources: Eurostat, Euler Hermes, Allianz Research Sources: Allianz Research Sources: Allianz Research
Input shortages are particularly acute in the Indeed, the rise in input prices is not being Wages are likely to rise in those sectors
automotive and computer/electronic sectors transferred onto output prices. We find that that face labor shortages. However we
(semiconductors!). Surveys find that selling European companies in particular are most don't expect a blanket boost with total
prices could rise in Europe going forward, at risk, having limited pricing power for now. wages galloping out of control.
alleviating some pressure from cost inflation.
© Copyright AllianzMESSAGE #7: GOVERNMENTS TO OVERSTAY THEIR
Textmasterformat bearbaiting
WELCOME
Eurozone public debt (% GDP) US public debt (% GDP) EMs: Differential between past economic
growth and current cost of debt*
NGA
BRA
ZAF
UKR
KEN
RUS
COL
TUR
MEX
PER
CHL
IDN
IND
THA
MYS
HUN
CZE
ROU
PHL
CHN
POL
Sources: Refinitiv, Allianz Research. Sources: Refinitiv, Allianz Research. -5% 0% 5% 10% 15%
Differential Avg Coupon Avg YoY Nom. Growth 2015-2019
We still see EZ heavyweights France, Italy and US public debt is expected at close to 160% * A positive differential indicates future debt sustainability risks.
Sources: Refinitiv, Allianz Research.
Spain boast debt ratios close to or notably above of GDP at the horizon of 2030. The
100% of GDP in 2035. In contrast, Germany, sustainability of US public debt won't be at Nigeria, Brazil, South Africa, Ukraine and
Ireland and the Netherlands cement their position risk as the spread r-g is expected to remain Kenya face high debt rollover risks in the
as low-debt countries by pushing debt notably pretty low alongside cooperative monetary medium term.
below the 60% Maastricht target by 2035.
© Copyright Allianz
policy and resilient growth 10Textmasterformat bearbaiting
MESSAGE #8: CREDIT RISK UNDER CONTROL
Changes in EBITDA margin between EH S&P credit rating monitoring Global sectors, timeline recovery
FY2019 and FY2020, by sector – debt weighted sector rating (baseline scenario)
(1 = AAA ; 20 = Default)
Sources: Refinitiv, Allianz Research Sources: S&P, Euler Hermes, Allianz Research Sources: Euler Hermes, Allianz Research
The sectorial asymmetry of the shock lead to wide heterogeneity across sectors in terms of revenue, profits and ultimately margins, with
a stronger hit in sectors in front face with social and mobility restrictions such as hotels and restaurants and transportation, and
conversely with substantial positive performance in chemicals, pharmaceuticals, retail and agrifood. We expect the recovery to lead a
‘rebalancing’ in credit ratings from the wave of deteriorations posted in 2020, but the former will be gradual and uneven due to the multi
speed recovery among sectors.
© Copyright Allianz 11Textmasterformat bearbaiting
MESSAGE #8B: INSOLVENCY NORMALIZATION TO
ACCELERATE IN 2022
Business insolvencies – Year-to-date figures (selected countries) Yearly changes in insolvencies in 2021 and 2022 (in %)
Share in the Last point (y/y change in %)
Global
Country Last Last Last Ytd vs Ytd vs
Insolvency As of Last m Comments
3m 6m 12m 2020 2019
Index
U.S. 28,7% 2021 Q1 -29% -21% -14% -29% -25% Steady decrease
Canada 2,3% 04-2021 37% -5% -18% -19% -16% -40% Steady decrease
Brazil 2,8% 05-2021 -13% 8% -6% -22% -1% -25% Steady decrease
Colombia 0,4% 2020 Q4 18% 21% 2% 2% Upside trend
Chile 0,4% 04-2021 15% 3% 11% 9% 4% 15% Upside trend
Germany 5,3% 05-2021 5% 3% -9% -17% -9% -15% Recent upside trend reversal
France 3,8% 05-2021 34% 20% -21% -29% -15% -49% Recent upside trend reversal
United Kingdom 4,1% 05-2021 8% -14% -25% -34% -31% -42% Steady decrease
Italy 2,9% 05-2021 456% 191% 42% 0% 57% -12% Upside trend
Spain 1,9% 03-2021 85% 29% 16% 0% 29% 38% Upside trend
The Netherlands 1,2% 05-2021 -52% -51% -49% -39% -52% -51% Steady decrease
Sw itzerland 1,0% 04-2021 121% 10% -5% -13% -1% -20% Recent upside trend reversal
Sw eden 0,8% 05-2021 -22% -30% -18% -18% -25% -14% Steady decrease
Norw ay 0,6% 04-2021 24% -11% -17% -21% -23% -34% Steady decrease
Belgium 0,7% 05-2021 56% 8% -30% -30% -23% -45% Recent upside trend reversal
Austria 0,6% 2021 Q1 -59% -59% -52% -59% -63% Steady decrease
Denmark 0,5% 05-2021 -29% -11% -4% -11% 3% -10% Recent dow nside trend reversal
Finland 0,4% 2021 Q1 -13% -25% -24% -13% -1% Steady decrease
Portugal 0,3% 02-2021 -41% -6% -10% -6% -4% -10% Steady decrease
Ireland 0,5% 2021 Q1 -30% -11% -1% -30% -43% Recent dow nside trend reversal
Luxembourg 0,1% 05-2021 95% 73% 15% 17% 39% -4% Upside trend
Russia 2,0% 03-2021 -1% -25% -28% -22% -25% -11% Steady decrease
Turkey 1,3% 04-2021 138% 33% 2% 8% -15% -11% Recent upside trend reversal
Poland 0,7% 03-2021 207% 116% 110% 67% 116% 99% Steady increase
Romania 0,3% 04-2021 731% 82% 13% 8% 44% -3% Upside trend
Lithuania 0,1% 03-2021 16% -47% -53% -57% -25% -61% Steady decrease
Latvia 0,0% 05-2021 -47% -44% -32% -33% -43% -65% Steady decrease
South Africa 0,5% 03-2021 49% 19% 20% 5% 19% 11% Upside trend
Morocco 0,2% 03-2021 246% 15% na na 15% 6% Recent upside trend reversal Sources: Euler Hermes, Allianz Research
China 17,2% 05-2021 -37% -24% -18% -11% -19% -9% Steady decrease
Japan 7,5% 05-2021 50% -12% -22% -15% -22% -23% Steady decrease By 2022, business insolvencies are likely to exceed pre Covid-
India 1,9% 2021 Q1 -52% -70% -75% -52% -44% Steady decrease
Australia 1,9% 04-2021 14% -34% -42% -51% -37% -49% Steady decrease 19 levels in most countries (by 17% on average) with the US to
South Korea 2,3% 05-2021 -30% -29% -24% -19% -27% -60% Steady decrease
Taiw an 0,8% 12-2020 -28% -2% -5% -2% -2% Steady decrease see low-for-longer insolvencies and uneven dynamics among
Singapore 0,5% 04-2021 -26% -9% -51% -50% -40% -9% Steady decrease
Hong Kong
New Zealand
0,5%
0,3%
05-2021
04-2021
-
37%
300%
-4%
153%
-14%
75%
-16%
183%
-13%
7% Recent upside trend reversal
-22% Steady decrease
European countries (due to different share of Covid-19
TOTAL 100% -8% -16% -16% -17% -21%
sensitive sectors and differences in support packages.
© Copyright AllianzTextmasterformat bearbaiting
USA: THE FED COMFORTABLE WITH A TEMPORARY
OVERHEATING OF THE ECONOMY
US housing prices and shelter CPI index Labor shortages in the US Fed's balance sheet (USD bn)
(% y/y)
Sources: BLS, Allianz Research Sources: BLS, Allianz Research Sources: Fed, Allianz Research
Overheating in the housing market: We Labor shortages are still half-way of their The Fed will envisage an operation twist
expect the shelter subcomponent of the maximum level (expected for H1 2022). by allocating less to MBS and more to
CPI to be heading toward levels > 3.5% y/y Average salaries are now expected in US Treasuries starting from Q2 2022 and
before the end of 2022. overheating areas at around +3.8% y/y then progressively reduce securities
compared with 3.5% y/y in our previous purchases from USD120bn per month to 0
scenario. at the horizon of H2 2023. 13
© Copyright AllianzTextmasterformat bearbaiting
A NEW US PATERNALISM UNTIL THE MID-TERM
ELECTIONS IN 2022?
Economic Policy Uncertainty index
Towards a leadership by the law
• “A family approach” by adopting a multilateral
strategy with a comeback to international
organizations and a leading role in
international discussions
• “Educating” by sanctioning in the short-term
but opening the door to improvements of
relations over the long-term with Russia and
China
• “Protecting” by continuing the America First
Policy initiated by Barack Obama and
reinforced by Donald Trump
• “Making the law” by imposing new norms at
Sources: EPU, Allianz Research
the level of digital, tax and environment
policy (a diplomacy aiming at establishing Biden's administration, until recent events in the Middle
leadership by the law) East, had contributed to attenuate global political risk.
Tactical multilateralism is the new leitmotiv of
international relations, which is less confrontational
© Copyright Allianz though this does not mean lower protectionism. 14Textmasterformat bearbaiting
CHINA: SUPPORTIVE EXTERNAL CONDITIONS AND
THREE LAYERS OF DOMESTIC RECOVERY
Exports and leading indicator Investment by sector, 2y CAGR (%) Household survey and savings rate
estimate
40% 20% 100
64 28,0 22,0 23,3 22,3
30% 15% 80
59
25,0 25,3 28,6
20% 10% 26,3
54 60
10% 5% 40
49
0% 0%
44 20
-10% 45,7 53,0 51,4 49,1
39 -5%
0
01-19
04-19
07-19
10-19
01-20
04-20
07-20
10-20
01-21
Infrastructure (value)
-20% 34 -10%
Exports 2y CAGR (%)
Housing starts (volume), HP-filtered
-30% -15% More consumption
29
Official manufacturing PMI - new export More investment
Manufacturing (value)
orders (rhs) More saving
-40% 24 -20%
08 09 10 11 12 13 14 15 16 17 18 19 20 21 10-2019 04-2020 10-2020 04-2021 Savings as % of disposable income
Sources: National Bureau of Statistics of China, China Customs, Allianz Research
We maintain our GDP growth forecasts Domestically, the 2020 recovery was To make the domestic recovery fully
for China at +8.2% in 2021 (after +2.3% driven by a first layer of public and broad-based, a third layer is private
in 2020) and +5.4% in 2022. The policy-driven investment (infrastructure consumption. Labor market indicators
external environment continues to be and real estate). 2021 is likely to be are encouraging (unemployment rate
supportive
© Copyright Allianz and domestic growth drivers more focused on a second layer, lowest since 2019), but household 15
are gradually shifting. private investment (manufacturing). confidence is not back to normal.Textmasterformat bearbaiting
EUROZONE: ECONOMIC REBOUND UNDERWAY (+4.2%
IN 2021-22), BUT NO SWIFT HAPPY END FOR ALL
Real GDP (Index: 100=Q4 2019) EU Recovery & Resilience facility (EUR bn)
Sources: Refinitiv, Allianz Research Sources: EU Commission, Allianz Research
The Eurozone as a whole will return to pre-crisis GDP The NGEU fund is supposed to keep divergence at bay,
levels in Q1 2022, however will Germany will already hit however we think it could be 18% (EUR150bn) smaller than
that milestone later this year, for Spain it will take until advertised given the lackluster uptake of loans. Hence, we
2023. Divergent recovery speeds will complicate policy are more cautious on the expected growth impact: +1ppt in
setting in the monetary union.
© Copyright Allianz 2022 assuming no meaningful implementation delay.ECB: MIND THE H2 ‘HAWK TRAP’, THE PEPP CLIFF
Textmasterformat bearbaiting
EDGE & GERMAN DEBT LIMITS FROM 2022 ONWARDS
ECB public sector asset purchases under PEPP & PSPP Germany: public sector debt outstanding (EURbn)
Sources: Refinitiv, ECB, Allianz Research Sources: Refinitiv, ECB, Allianz Research
The ECB will have to navigate challenging moments soon: Bigger headaches loom ahead as the ECB looks
Engage in a dovish tapering while avoiding the hawk trap in increasingly set to run into its self-imposed limits. Given our
H2 – i.e. pre-committing to a lower PEPP pace in the early expectations for German net issuance, the ECB will have
recovery phase which then calls for communication flip- enough room for maneuver for max. 10 months of QE at a
flopping should spreads widen. And prepare markets for a life pace of EUR40bn per month unless limits are lifted or eased.
after PEPP
© Copyright Allianz and navigate the looming cliff edge. The substitution via higher supranational purchases would 17
hurt peripheral spreads.FRANCE: RECOVERY IGNITED BUT WATCH OUT FOR
Textmasterformat bearbaiting
POLITICS!
Household bank deposits (EURbn) and confidence (index) French elections: stumbling along in a summer haze
30 000 (index) 110
Industrial
25 000 competitiveness
105 • What economic incentives to bring strategic industries back to
20 000
France and boost exports?
15 000 • Going beyond the -EUR10bn/year with the production cost cut?
100 • Which policies to tackle skill shortages, improve human capital
10 000 and R&D performance?
5 000 95 Fiscal reforms
0 • Pension reform: A cosmetic or profound solution? Where to push
the retirement age? A systemic or parametric reform?
90
-5 000 • How to reduce the deficit of the Social Security system?
• Universal income? What fiscal solutions to support the poor?
-10 000 Overnight deposits With agreed maturity
85
Savings accounts Total deposits Green Policy
-15 000
Consumer confidence (rhs) •What evolutions to the current climate law?
-20 000 80 •Who will push for a European solution for a CO2 tax at the EU
03/19
05/19
07/19
09/19
01/20
03/20
05/20
07/20
11/20
01/21
03/21
05/21
01/19
11/19
09/20
borders?
•Which financial support to NFCs that bear the cost of Green transition?
Sources : Markit, Euler Hermes, Allianz Research Source: Euler Hermes, Allianz Research
Household excess savings reached EUR142bn in Q1 The unemployment insurance reform (as of 1st
2020 on the back of continued state support and July) is suspended because of unions’ appeal. End
precautionary motives. With improving confidence as 2021, the Government may choose to move
of Q2 2021, the unleashed savings may boost forward with a softer version of the controversial
consumption up to +2pps.
© Copyright Allianz
‘pension reform’, this can lead to social unrest with 18
detrimental economic consequences.Textmasterformat bearbaiting
ITALY: EUROPE’S AMERICA – GOING BIG ON FISCAL
Italy with 2nd largest Recovery Plan (2021-26) Lifting growth potential back to early 2000s levels?
(in % of GDP) (real GDP and potential GDP, Index 100 = 2000)
20% 112 Projection
108
15%
104
10%
100
5%
96
0% 92
Greece Italy Portugal Spain France Germany 2000 2005 2010 2015 2020 2025 2030
EU Grants EU Loans Domesting Funding Real GDP Potential GDP
Sources: National Recovery Plans, Allianz Research Sources: Refinitiv, Allianz Research
Italy with 2nd largest recovery plan in EU in terms of Recovery plan projects a raise of potential growth by
GDP (15%) and the largest in absolute terms (EUR 0.4% to 0.6% p.a. This would add up to 3.6% of
248bn) of GDP) of which EUR192bn will be funded growth until 2026 and reach growth potential last
by NGEU with EUR69bn being grants. seen shortly after Italy entered the euro area.
© Copyright Allianz 19Textmasterformat bearbaiting
GERMAN ELECTIONS: EVOLUTION, NO REVOLUTION
Germany: Election poll (%) What could a Black-Green coalition (baseline scenario) entail?
Source: Infratest Dimpa Source: Allianz Research
Current election polls suggest three feasible coalitions to emerge from Agreeing on a coalition contract will prove challenging as
the September vote, with the Green Party and the FDP likely to be positions on a number of key topics are far apart between
kingmakers: 1) CDU/CSU & Green Party (plus FDP), 2) CDU/CSU, the CDU/CSU and the Green Party (the most likely
SPD & FDP and 3) Green Party, SPD & FDP. Approaching the election scenario). Even under the pragmatic leadership of Baerbock
date, we expect the governing CDU/CSU to receive more support in and Laschet a deal could take several months to be sealed,
polls, withAllianz
© Copyright progress on the vaccination front and an improvement in the as agreement will require deviating from party lines. 20
outlook.©Mārtiņš Zemlickis
Textmasterformat bearbaiting
THANK YOU
Allianz Research
June 25, 2021
© Ekaterina Pokrovsky - stock.adobe.com
© Copyright AllianzIM DIALOG
Ludovic Subran Anna-Katharina Wichmann
Chef-Volkswirt Vertriebsdirektorin
Allianz und Euler Hermes Euler Hermes DACH
22WIR BEANTWORTEN IHRE FRAGEN.
Fragen können Sie über
die Chatfunktion stellen.
23SICHER WACHSEN
WIR HELFEN IHNEN, DIE BESTEN CHANCEN ZU ERKENNEN
24GESCHÄFTE MACHEN – MIT
VERTRAUEN
WIR KENNEN DIE RISIKEN UND ÜBERNEHMEN SIE
25VIELEN DANK FÜR IHRE TEILNAHME
Bei Fragen wenden Sie sich gerne an Ihren persönlichen
Ansprechpartner bei Euler Hermes oder an:
Tel.: 040 / 8834 3536
E-Mail: service.de@eulerhermes.com 26You can also read