Development Research on Integrating CNC Machine Tool with Plasma for On-line Surface Heat Treatment
←
→
Page content transcription
If your browser does not render page correctly, please read the page content below
Preprints (www.preprints.org) | NOT PEER-REVIEWED | Posted: 23 June 2021 doi:10.20944/preprints202106.0583.v1

 ARTICLE

 Development Research on Integrating CNC Machine Tool with
 Plasma for On-line Surface Heat Treatment
 Shao-Hsien Chen1* and Bo-Ting Wang 2

 1 The Graduate Institute of Precision Manufacturing, National Chin-Yi University of Technology, No.57, Sec.
 2, Zhongshan Rd., Taiping Dist., Taichung 41170, Taiwan
 2 Department of Mechanical Engineering, National Chin-Yi University of Technology, No.57, Sec. 2,

 Zhongshan Rd., Taiping Dist., Taichung 41170, Taiwan
 * Corresponding author: Email e6036@ncut.edu.tw

 Abstract
 In this study, the plasma was integrated with a lathe, and the online heat treatment was performed to
 achieve mechanical strength and hardness, to reduce the machining process and handling. However, for
 online heat treatment cast iron FC25, it is important to study the parameters of the lathe and plasma, and
 the research method is used eventually to optimize the process, reduce the machining cost and machining
 error. The variable factors in the surface online real-time heat treatment are spindle speed, feed rate, and
 current, the objective function is the hardness of mechanical properties. In the screening experiment, the
 interaction of factors was discussed using a full factorial experiment. The Central Composite Design was
 combined with the Lack-of-Fit test for the optimization experiment, the R2 coefficient was used to determine
 whether the regression model is appropriate. The optimum parameters were derived from the contour dia-
 gram and response surface diagram. The experimental results show that the significant factors include spin-
 dle speed, feed rate, and current, the optimum parameters include spindle speed 168rpm, feed rate
 0.068mm/rev, and current 86A. The experimental results of optimum parameters show that the surface
 hardness is increased from 306HLD to 806HLD, the surface hardening effect is enhanced by 163%, so the
 online real-time heat treatment equipment has the best hardening effect.

 Keywords: plasma hardening; response surface methodology; cast iron

 1. Introduction
 Under the large output value of the automobile industry, the demand for automobile
 metal plates increases gradually. The automobile metal plates are machined by stamping,
 bending, and stretching, so the machining or handling of the large-sized metal plate molds
 takes a lot of time. The metal plate molds are high-cost processed bests. To prolong the
 service life of molds, surface heat treatment is required during machining to implement
 surface hardening. The flame treatment is mostly used at present. This study will use
 plasma in the lathe (CNC lathe) to study parameters, aiming at online real-time surface
 heat treatment, to achieve mechanical properties and surface hardening. Li et al. [1] used
 high energy density of plasma for quench hardening of tank parts. The result showed that
 the part surface hardness was higher than HRC55, the deformation was 0.01mm, the
 depth of hardening was 0.02mm, applicable to partial hardening, the result was best, the
 service life of parts was prolonged. For long-term operation and maintaining the stability
 of the plasma machine, Zhou [2] designed a plasma control system, and the machine val-
 ues were visualized. This system extracted the current and voltage variations in the ex-
 periment, it was used in multiple steel products for surface treatment, the average surface
 hardness was HRC52~62. Cui et al. [3] used the plasma surface treatment technique for
 enhancing the gear hardness, the result showed that the plasma surface treatment en-
 hanced the gear surface hardness and wear resistance, and the gear size and tooth shape
 would not be deformed by the treatment process. The surface hardening value was
 750~850HV, 15~20 times of the material hardness before treatment, the hardened layer
 was 0.15~0.3mm thick. Yang [4] performed mathematical derivation for the theoretical

 1

 © 2021 by the author(s). Distributed under a Creative Commons CC BY license.
Preprints (www.preprints.org) | NOT PEER-REVIEWED | Posted: 23 June 2021 doi:10.20944/preprints202106.0583.v1

 basis of plasma arc surface quenching temperature simulation and built a plasma heat
 source model. The analytical software ANSYS was used for analyzing the distribution of
 the overall temperature field of quenching, and the arc power, feed rate, plasma head
 nozzle hole diameter, workpiece preheating, and the parameters of different cooling
 methods were tested. The validation experiment was performed at last. The experimental
 results matched the software analysis results. 5. Used finite element analysis to study the
 distribution patterns of temperature field and stress field of 40Cr steel product and used
 X-ray stress detector to test the residual stress after quenching of 40Cr steel product. In
 terms of the plasma quenching cooling method, the workpiece generates stress by its heat
 transfer, this stress is residual compressive stress [5]. The fatigue failure of the workpiece
 surface can be improved effectively according to analysis, but the workpiece is likely to a
 flaw. The result showed that the nozzle diameter and output current had a relatively
 greater influence on residual compressive stress. The used laser to treat the surface of AISI
 4140 intermediate-carbon chrome-molybdenum steel, and analyzed the improved me-
 chanical properties after treatment. The result showed that the metallographic structure
 was changed from materials ferrite and pearlite into plumose martensite structure, the
 surface hardness was increased by 238% from Hv237 to 771, the material yield strength
 was 94kg/ mm2, and 125kg/mm2 after laser processing, the amplitude was 33%, the tensile
 strength was increased by 14% from 118kg/mm2 to 139kg/mm2 [6]. The used laser to treat
 the surface of AISI 4140 chrome-molybdenum steel, M2 tool steel, and a new type of steel
 KDIIS. The experimental results showed that the surface hardness of AISI 4140 was Hv750
 after laser surface treatment, that of M2 tool steel was Hv1200, and that of a new type of
 steel KDIIS was Hv1200. In the experimental process, the temperature rose rapidly to aus-
 tenitizing temperature and dropped rapidly, and the carbon atoms in the material had no
 time to generate cementite. The BCT crystal was obtained, and the lattice was distorted,
 so the hardness was quite high, and it was a martensite structure [7].
 The hardened layer hardness distribution and metallographic structure variation af-
 ter laser surface treatment of material carbon tool steels SK3, SK5, and SK7 and die steel
 SKD61. The case hardness of carbon tool steel SK3 was Hv910, the case hardness of SK5
 was Hv900, the case hardness of SK7 was Hv950, and the case hardness of die steel SKD61
 was Hv1100. The main hardening condition of dies steel SKD61 depended on whether the
 carbides were dissolved in the base austenite or not. The structure was divided into three
 parts after quenching, including hard zone, transition zone, and substrate zone. The dis-
 tribution of carbides in the hard zone decreased obviously because the high temperature
 of laser surface treatment dissolved surface carbides in the base, the hard zone had the
 highest hardness value, the transition zone and substrate zone were tempered martensite
 structure and fine carbides [8,9,10]
 The mechanical properties of medium carbon steel AISI 1045, chrome-molybdenum
 steel AISI 4140, and nickel-chromium-molybdenum steel AISI 4340 after laser surface
 treatment. The experimental results showed that the hardness of medium carbon steel
 AISI 1045 was increased from 316HV to 755HV, the surface hardness was increased by
 138%. The hardness of chrome-molybdenum steel AISI 4140 was increased from Hv396 to
 Hv801, the surface hardness was increased by 102%. The hardness of nickel-chromium-
 molybdenum steel AISI 4340 was increased from 441HV to 833HV, the surface hardness
 was increased by 88%. The depth of hardening of medium carbon steel AISI 1045 was
 0.85-1.45mm, the depth of hardening of chrome-molybdenum steel AISI 4140 was 0.96-
 1.65mm, the depth of hardening of nickel-chromium-molybdenum steel AISI 4340 was
 0.91-1.88mm. According to the above references, laser hardening was mostly used. This
 study will combine plasma hardening with response surface methodology to study pa-
 rameter optimization, the hardening effect can be achieved at a lower cost, but there is no
 related study at present [11,12]. Reviewing data published in the literature reveals that the
 phenomenon reported in this paper has not surface hardening of the Plasma and lathe
 integration observed. The objectives of this study include (1) evaluating the hardening
 efficiency of plasma heat treatment, (2) comparing the effects of experimental parameters
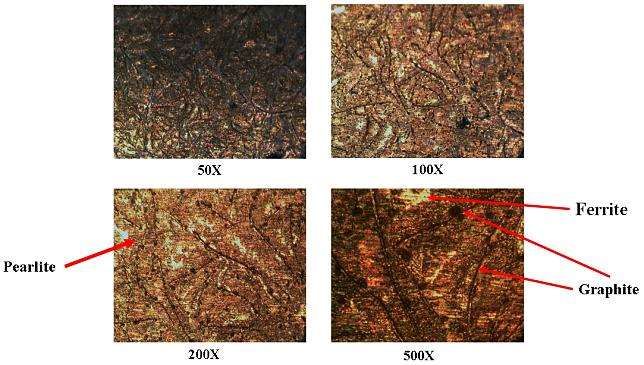
Preprints (www.preprints.org) | NOT PEER-REVIEWED | Posted: 23 June 2021 doi:10.20944/preprints202106.0583.v1

 current、spindle speed and feed on hardening results, and (3) investigating the optimi-
 zation and verification of plasma heat treatment parameters.

 2. Research content and method
 The heat source model and parameters shall be determined before the test because
 the selection of an equivalent plasma heat source mathematical model will directly influ-
 ence the heat distribution of the concentrated heat source. When the concentrated heat
 source works [13], the temperature distribution on the metal surface close to the center of
 the concentrated heat source depends on the heat source type, and the temperature dis-
 tribution on the metal surface far from the center of the heat source is determined by the
 thermophysical property of metal material. The common concentrated heat sources in-
 clude point line, and surface heat sources [14,15]. It is a Gaussian heat source during
 plasma arc quenching [16,17]. Figure 1 shows the distribution of heat flux of Gaussian
 heat source, the heat flow follows Gaussian distribution, the Gaussian heat source func-
 tion is expressed as Eq. (1).
 ( ) = exp (− ) (1)
 In Eq. (2.2): ( ) is the heat flux density (W/m2) at radius ; is the heat flux den-
 sity (W/m2) at the center of arc column; is the distance (m) from the center point of
 plasma heat source to any point of the hot zone; is the Gaussian heat source distribu-
 tion curve shape coefficient ( )

 Figure 1. Gaussian heat flux distribution [16].

 The effective power of plasma for heating workpiece is [18,19,20]
 = 0.24 × × × (2)
 On equation (2): V is the plasma voltage, I is the plasma current value, is the
 plasma thermal efficiency

 3. Experimental equipment and planning:
 The experimental sample is FC25 gray cast iron in this study, which has the best cast-
 ing property, cutting characteristic, and wear resistance. The metallographic structure of
 the material comprises ferrite + pearlite + flake graphite. The graphite content in the struc-
 ture can achieve a self-lubricating effect. This study uses DC plasma heat source output
 to simulate immediate surface heat treatment after lathe finish machining. As the material
 metallography shall be analyzed after hardening, cutting machining is required, prevent-
 ing the heat generated in the cutting process from changing the end product surface metal-
 lography. Therefore, this study uses a sample in the outside diameter of 40mm and thick-
 ness of 20mm, the material sample is prepared before the experiment.
 A single-spindle lathe as an experimental carrier and a hollow cylinder sample is
 used for the experiment. The lathe spindle controls the spindle speed (rpm), the plasma gun
 head is fastened to the cutting tool rest to control the feed rate (mm/rev), so as to uniformly
 heat up the material surface. The plasma device for the experiment is of transferred arc
 type, numerically controlling the movement, making the plasma gun head approach the
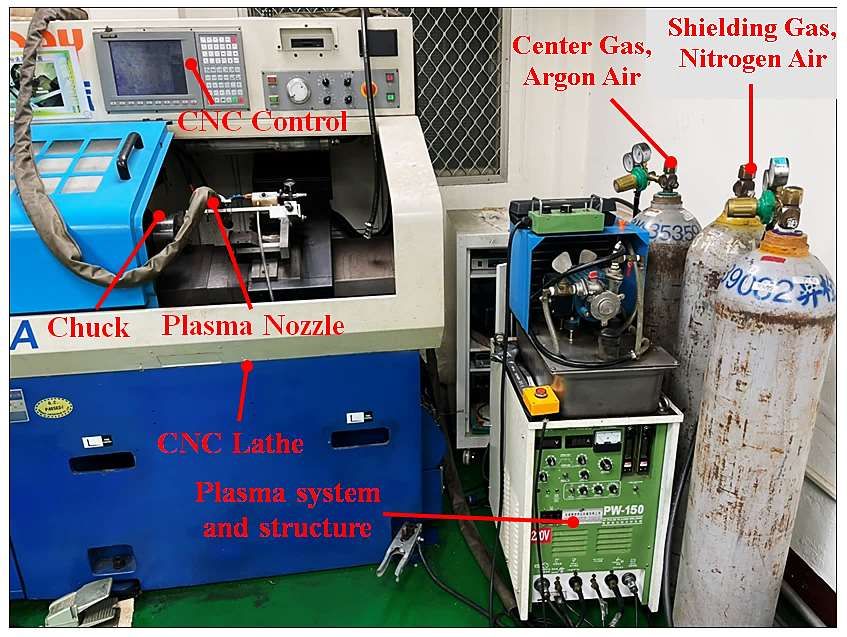
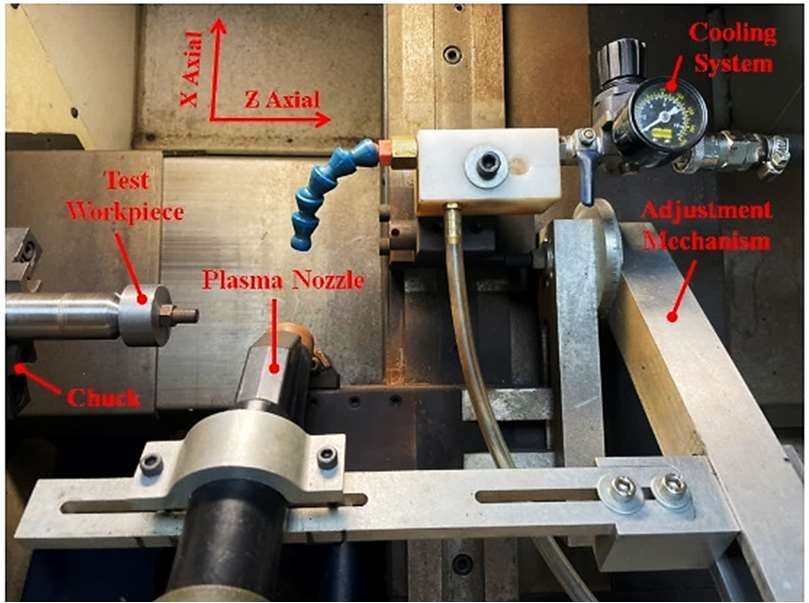
Preprints (www.preprints.org) | NOT PEER-REVIEWED | Posted: 23 June 2021 doi:10.20944/preprints202106.0583.v1

 workpiece to form a loop, generating an electric arc for heating. In terms of heat source
 output, the current (A) controls the output of heat source energy magnitude. The experi-
 mental configuration is shown in figure 2. The flow chart of the experimental analysis and
 model establishment of this research is shown in figure 3.

 Figure 2. Lathe and plasma experiment equipment and system.

 Figure 3. Experimental flowchart and process. Figure 4. Experimental workpiece clamping

 The material used in this study is cast iron FC25. The mechanical properties and compo-
 nents are shown in tables 1-2, the diameter, thickness, and hole of the workpiece were 40mm,
 20mm, and 12mm, respectively. As shown in figure 4.

 Table 1、FC25 Chemical Composition(%)
 C P Si Mn S Ti
 FC25 3~3.3 ≤0.12 1.65~2.05 0.7~1.1 ≤0.12 ≤0.05
 Table 2、FC25 Mechanical Properties
 Tensile strength Extension Reduction of area Hardness
 FC25 830 N/mm2 ≥20% ≥45% 306 HLD

 4. Results and Discussion
 4-1. Relationship between temperature and material
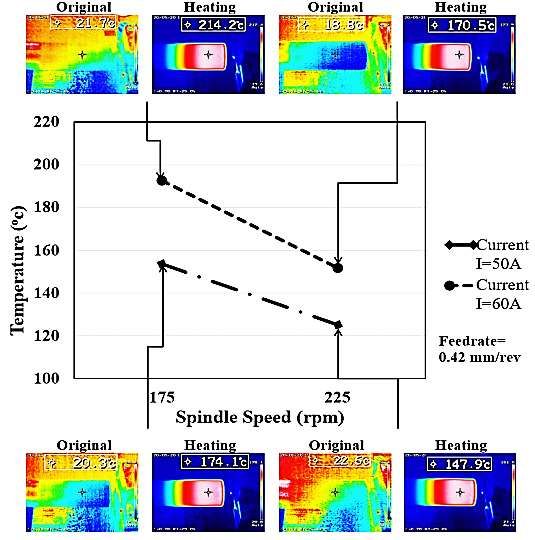
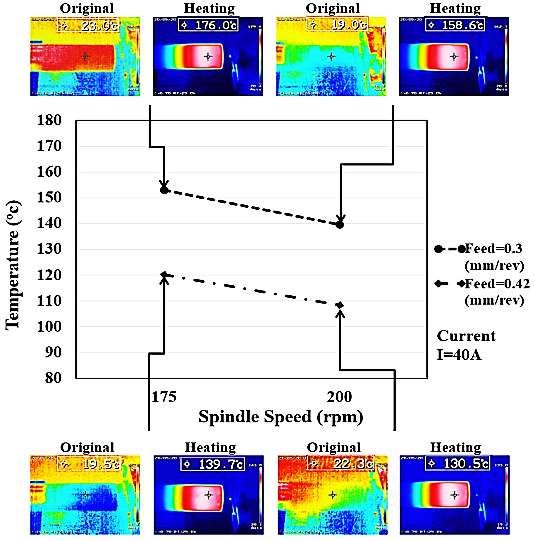
Preprints (www.preprints.org) | NOT PEER-REVIEWED | Posted: 23 June 2021 doi:10.20944/preprints202106.0583.v1

 4-1-1. Temperature prediction model building
 This study mainly uses plasma for sudden heating of the material to generate ce-
 mentite and steatite deposition, to harden the surface. Therefore, the temperature predic-
 tion model shall be built before research to confirm the current, the full factorial experi-
 ment is used in temperature prediction modeling experiment, the parameter setting ex-
 periment conditions: the outside diameter of FC25 gray cast iron is 40mm, the heating
 distance is 50mm, the estimated temperature rise is 100°C~300°C, the established param-
 eters are shown in table 3, parameter setting refers to equation 2 ,the voltage, current, and
 plasma thermal efficiency of the parameter were V=220 V, I=40A~60A, and η=0.23, respec-
 tively.

 Table 3. Experimental factors and levels.

 Level I Level II Level III
 (A) Spindle Speed rpm 175 200 225
 (B) Feed rate mm/rev 0.3 0.36 0.42
 (B) Current A 40 50 60
 The experimental parameters are designed by using RSM. The experimental results
 are discussed below. When the feed rate is fixed at 0.42 mm/rev, the Spindle speed is
 175~225rpm and the current is 50~60A, the temperature rises as the current increases, the
 current is proportional to the thermal power according to Eq. 7, the maximum tempera-
 ture difference is 25%. In terms of spindle speed, the higher the spindle speed is, the
 shorter is the single-point heating time, so the temperature effect is inversely proportional
 to the spindle speed, the maximum temperature difference is 18%. When the current is fixed
 at 40A, the spindle speed is 175~200rpm and the feed rate is 0.3~0.42 mm/rev, the tempera-
 ture drops as the spindle speed increases because the single-point heating time is shorter,
 the temperature is lower, the maximum temperature difference is 10%, as shown in figure
 5. The lower the feed rate is, the higher is the temperature, the maximum temperature
 difference is 22.5%. When the spindle speed is fixed at 225rpm, the current is 40~60A, and
 the feed rate is 0.3~0.36 mm/rev, the higher the current is, the higher is the temperature.
 The current is proportional to the thermal power according to equation 7, the maximum
 temperature difference is 60.4%.

 Figure 5. Relationship of different spindle speed and temperature.

 The temperature prediction model is built by using temperature measurement after
 the test. The Partial Least Squares Method and Regression (PLSMR) and Least Square
 Method and Regression (LSMR) are compared. The parameters are designed by using
 RSM. The P-value 0.9 in analysis. The result of PLSMR is shown in
 Figure 6. It is observed that the current value is a significant factor, the order of
Preprints (www.preprints.org) | NOT PEER-REVIEWED | Posted: 23 June 2021 doi:10.20944/preprints202106.0583.v1

 contributions is current >feed > spindle speed, the regression prediction model is expressed
 as equation 4:
 Temp =231.5-0.621N-333.1F+3.454I (3)

 Figure 6. Partial Least Squares Method and Regression Analysis chart.

 When the LSMR is used, the experimental significance level α=0.05, and F value =50,
 F>F (0.05,4,2) so the null hypothesis is rejected. The test coefficient R2=0.9709 means 97.09%
 of the total variance in the model can be explained by the independent variable, the re-
 gression model has high fitness, as shown in figure 7. It is observed that the current value
 is a significant factor, the order of contributions is current > feed > spindle speed, the re-
 gression prediction model is expressed as Eq. 8:
 .
 F= = 221 < ( . , , ) = 19.2468 (4)

 Pareto Chart of the Standardized Effects
 (response is Temp, α = 0.05)
 Term 2.45
 Factor Name
 A Rotation Speed (rpm)
 B Feed (mm/rev)
 C Currect (A)
 C

 B

 A

 0 2 4 6 8 10 12
 Standardized Effect

 Figure 7. Least Square Method and Regression Analysis chart.

 4-1-2. Temperature model verification
 Five groups of arbitrary parameters will be used for temperature validation after
 modeling. The temperature parameters are shown in table 4. The predicted values and
 experimental values are analyzed. The model verification uses MAPE (Mean Absolute
 Percentage Error) as a measurement indicator. The MAPE of the PLSMR model is 0.5935%,
 and the MAPE of the PLSMR model is 1.335%, so the PLSMR has higher accuracy, as
 shown in table 5. However, both of the estimation methods are in the permissible range,
 the results are shown in Table 6.

 Table 4. Validation experiment parameter list.
Preprints (www.preprints.org) | NOT PEER-REVIEWED | Posted: 23 June 2021 doi:10.20944/preprints202106.0583.v1

 Experimental pa- Current
 Spindle speed rpm Feed rate mm/rev
 rameter A
 Group 1 213 0.33 45
 Group 2 213 0.39 45
 Group 3 188 0.33 55
 Group 4 188 0.39 55
 188 0.39 45

 Table 5. Prediction model analysis and comparison.

 Actual Forecasted Absolute Forecasted Absolute Precent
 (LSMR) Precent Error (PLSMR) Error
 1 143.8 146.13 1.62 144.73 0.65
 2 124.7 126.15 1.16 124.75 0.038
 3 195.7 196.20 0.25 194.80 0.46
 4 173.5 176.21 1.56 174.81 0.76
 5 138.8 141.67 2.07 140.27 1.06
 MAPE 1.34 0.59

 Table 6. Validation experiment measurement results.

 Original Temperature after Original Temperature after
 temperature heating temperature heating

 1 4

 21.1oC 164.9oC 18.0oC 191.5oC

 2 5

 20.1oC 144.8oC 21.6oC 160.2oC

 3

 20.7oC 216.4oC

 4-2. Influence of different parameters on material properties
 The influence of different spindle speed, feed rates, and current values on material
 properties is analyzed, the spindle speed is 200~300rpm, the feed rate is 0.1~0.2mm/rev, and
 the current value is 60~80A. Different parameters correspond to different workpiece sin-
 gle-point action thermal effects, so the material properties are analyzed and discussed,
 aiming at the material hardness and metallographic structure changes. The relationships
 between different parameters and mechanical properties are described below.

 4-2-1 the influence of spindle speed and feed on material hardness.
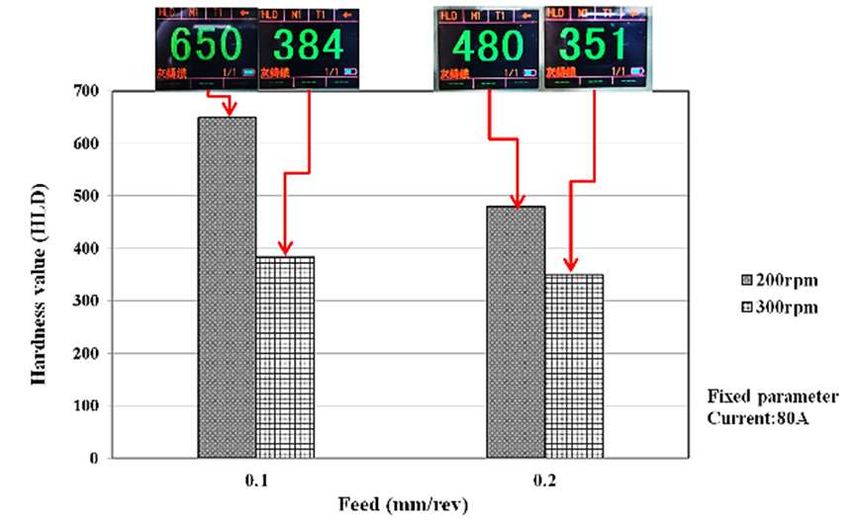
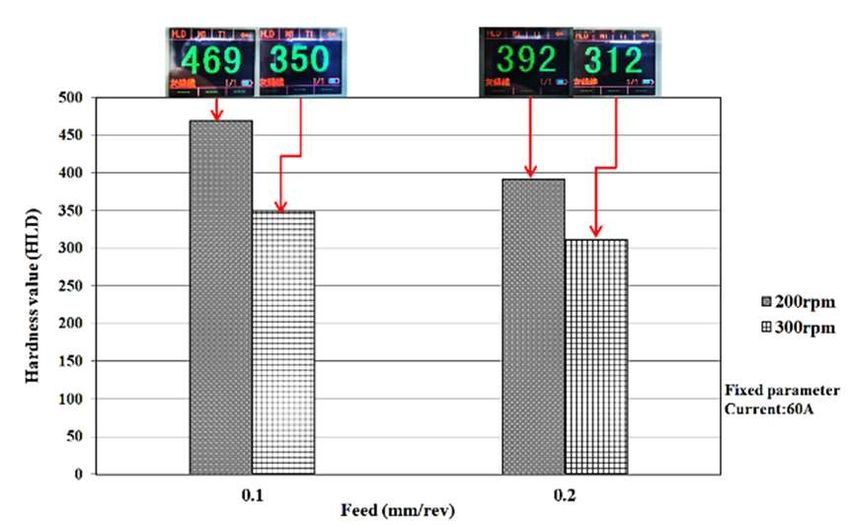
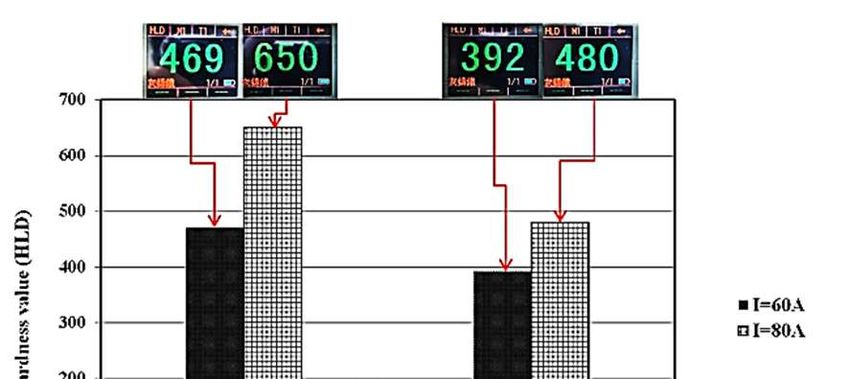
Preprints (www.preprints.org) | NOT PEER-REVIEWED | Posted: 23 June 2021 doi:10.20944/preprints202106.0583.v1

 The influence of different spindle speed and feed rates on the hardness of mechanical
 properties is mainly the influence of operative temperature at a material single point,
 when the plasma power is fixed at I = 80A, as shown in figure 8, the hardness value is
 relatively higher when the spindle speed is lower because the workpiece spindle speed
 directly influences the heating time. When the feed rate is 0.1mm/rev, the workpiece spin-
 dle speed is adjusted from 300rpm to 200rpm, the hardness value is increased by 35.4%.
 The influence of feed rate on hardness is observed in this experiment. The lower the feed
 rate is, the higher is the hardness value, the first cause is the single-point heat source action
 time. When the workpiece spindle speed is 200rpm, the feed rate is adjusted from
 0.2mm/rev to 0.1mm/rev, the hardness value is increased by 69.3%.

 Figure 8. Relationship of different spindle speed to a hardness value.

 When the plasma current is reduced to I = 60A, the spindle speed is N = 200~300rpm,
 and the feed rate is F = 0.1~0.2mm/rev. The fundamental purpose is to heat the workpiece
 uniformly to achieve a hardening effect, when the spindle speed is adjusted from 300rpm
 to 200rpm, the hardness value is increased by 19.6%. When the workpiece spindle speed
 is 200rpm, the feed rate is adjusted from 0.2mm/rev to 0.1mm/rev, the hardness value is
 increased by 34%. According to the aforesaid data, the longer the unit residence time is,
 the higher is the relative hardness. Under variable plasma current, the higher the current
 is, the more obvious is the relative hardness.

 4-2-2. Relationship of different current values to a hardness value
 When the feed rate is fixed, the effects of different spindle speed and plasma current
 values on material hardening and variation are observed. When the constant spindle
 speed is N=200rpm, the current value is increased by 25% from I = 60A to I = 80A, the
 hardening effect is increased by 27.8%. When the constant spindle speed is N = 300rpm,
 the hardening effect is increased by 18.3%. When the current value is I = 80A, the spindle
 speed is increased by 33%, the hardening effect is reduced by 35.4%. Therefore, the higher
 the spindle speed is, the worse is the hardening effect, as shown in figure 9. When the
 spindle speed is fixed, the effects of different feed rates and plasma current values on
 material hardening and variation are observed. When the feed rate F = 0.1mm/rev, the
 current value is increased by 25%, the hardening effect is 27%, and then the feed rate is
 increased to F=0.2mm/rev, the hardening effect is 8.9%. Therefore, the higher the feed rate
 is, the worse is the hardening effect. When the current value is I = 80A, the feed rate is
 increased by 50%, the hardening effect is reduced by 69.3% because under different pa-
 rameters and temperatures, the experimental material produces different precipitates, the
 final hardness value is influenced, as shown in figure 9.
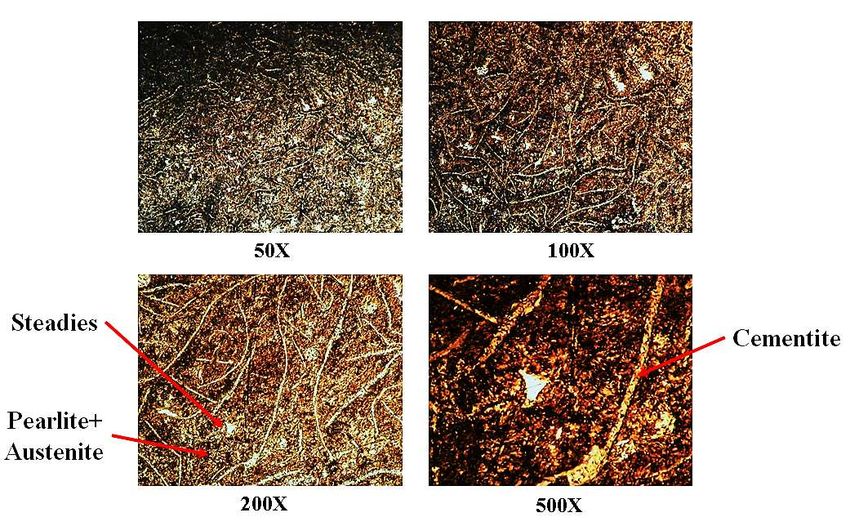
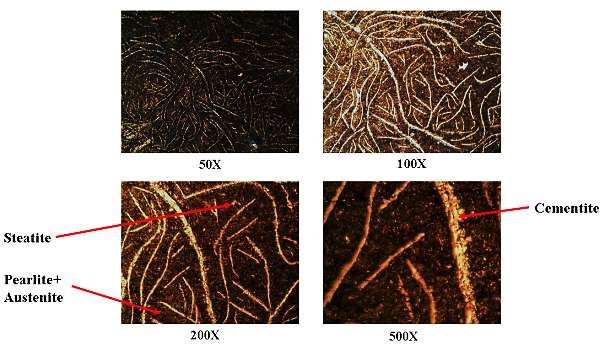
Preprints (www.preprints.org) | NOT PEER-REVIEWED | Posted: 23 June 2021 doi:10.20944/preprints202106.0583.v1

 Figure 9. Relationship of different current values to a hardness value.

 4-2-3. Description of experimental metallographic structure
 In the online heat treatment process, the mechanical parameters influence the tem-
 perature, leading to the hardening effect, the influence on the hardening effect is closely
 bound up with the material structure, so the internal change is observed by using metal-
 lographic structure. The silicon content of 1.0~2.0% in the material presents the pearlite
 structure, the silicon can change the free carbon in the casting process into graphite crystal,
 the cementite generation is reduced. When the graphite content in the structure increases,
 the texture is relatively soft and easy to cut. The amount of silicon content results in dif-
 ferent crystals of graphite. During molding, the iron element and carbon element perform
 chemical action due to the high temperature inside cast iron, so that the cementite is gen-
 erated. The cementite has a hard and brittle texture, increasing the difficulty in subsequent
 material processing. To prevent this problem, an amount of silicon is added to the casting
 process, the carbon element is changed into graphite, to reduce the cementite generation.
 The ferrite is separated from the cementite during cooling, so a lot of ferrites adhere to the
 graphite crystals.
 When the spindle speed N = 300rpm, feed rate F=0.1mm/rev, and current value I = 80A,
 the measured hardness is 479 HLD, higher than the material surface hardness by 57%.
 Figure 10 shows that most of the ferrite structure is changed into pearlite, so a little graph-
 ite carbide is separated nearby the graphite crystal branches.

 Figure 10. Phase diagram of Experiment 5 and 7

 When the spindle speed N=200rpm, feed rate F=0.1mm/rev and current value I=80A,
 the experimental measurement result is 613HLD, higher than the material surface hard-
 ness by 100%, there is no obvious martensite feature in the structure, so the substrate is
 transformed from pearlite into pearlite + austenite eutectic. The experimental temperature
 has reached the transformation point, but the duration is too short to transform all struc-
 tures, leading to this eutectic phenomenon. The heated graphite and the Fe element in the
 material have a chemical change to separate cementite, it is observed that the original
 graphite crystal branches have been replaced by cementite.
 The cast iron contains phosphor element, when the phosphor element is solidified
 again at a high temperature, this kind of iron phosphide is called steatite. The scattered
 white dots in figure 10 are steatite, the hardness of steatite next to cementite, the wear
 resistance can be enhanced, and the heat resistance can be improved.
Preprints (www.preprints.org) | NOT PEER-REVIEWED | Posted: 23 June 2021 doi:10.20944/preprints202106.0583.v1

 To fully melt the graphite, a long heating time is required, and the temperature shall
 be maintained, to destroy the graphite crystal appearance. The graphite precipitates ce-
 mentite out, but the shape is the same as the graphite crystal because the heating time is
 too short.

 4.3. Material hardening optimization experiment
 In the online hardening heat treatment process, the temperature has an obvious effect
 on material structure, and the material structure change can induce mechanical harden-
 ing. In Stage 2, the experimental significant factors are used for full factorial Central Com-
 posite Design. The experimental parameters adopt 3 factors and 5 levels. The experimental
 sequence is performed using random numbers. The design of experimental parameters is
 shown in table 7. After the experiment, the changed hardness of the material is used to
 measure and build the prediction model, the LSMR is used for analysis.

 Table 7. Optimization experiment factors and levels.

 Factor
 1.633 1 0 -1 -1.633
 Level
 Spindle speed
 168 200 250 300 331
 Rpm (A)
 Feed rate mm/rev (B) 0.07 0.1 0.15 0.2 0.23
 Current
 64 60 70 80 86
 A (C)
 First-order model Lack-of-Fit test, the Lack-of-Fit P-value of this model is
 0.022
 F(0.05,11,4), the null hypothesis is rejected, the R2 coefficient is 86.55%, in the R2 coefficient
 test, the value is relatively low, the analysis is performed not eliminating second-order
 model existence.
 .
 F= = 9.32 > ( . , , ) = 5.96 ……..…….(5)
 .
 In the second-order model Lack-of-Fit test, the full factorial is used for analysis in
 Stage 1, the model Lack-of-Fit P-value is 0.284 >α=0.05, there is no evidence for the failure
 in fitting data, the Lack-of-Fit F value is 1.856 < F(0.05,5,4), the null hypothesis is not rejected,
 the R2 coefficient is 98.32%, the second-order model is more applicable than the first-order
 model.
 .
 F= = 1.856 < ( . , , ) = 6.26 ……..……..(6)
 .
 In Stage 2, the coefficients in the quadratic term and interaction term are insignificant,
 meaning the terms have a slight influence on the hardness response variable in the exper-
 imental results, so the term with low contribution is deleted, and the ANOVA is per-
 formed after an adjustment.
 .
 F= = 2.31 < ( . , , ) = 6.04 …………….(7)
 .
 Adjusted second-order model Lack-of-Fit test, the Lack-of-Fit P-value of this model
 is 0.218 >α=0.05, there is no evidence indicating that the model cannot fit data, the Lack-
 of-Fit F value is 2.31 < F(0.05,8,4), the null hypothesis is not rejected, the R2 coefficient is
 97.16%, meaning 97.16% of the total variance in the model can be explained by the inde-
 pendent variable.
 The regression equation is
 Y = 1033 − 3.99A − 2828B + 6.94C + 0.0064 + 10596 − 26.7 ∗ …(8)
 The regression prediction equation is built by using RSM, the validation experiment
 shall be performed to check whether the model meets the standard or not. The validation
 experiment parameters are shown in table 8~9, three groups of experimental parameters
 are selected at random and substituted in the equation for validation. The experimental
 sample is measured five times, the average value is taken, the maximum error is 2.01%
 according to experimental analysis and model verification. According to the aforesaid
Preprints (www.preprints.org) | NOT PEER-REVIEWED | Posted: 23 June 2021 doi:10.20944/preprints202106.0583.v1

 three groups of experimental results, the estimated values of the temperature prediction
 equation fall in the confidence interval, the estimation ability is best. The three groups of
 metallographic structure as shown in figure 11.

 Table 8. Validation experiment parameter list.

 Experimental parame- Current
 Spindle speed rpm Feedrate mm/rev
 ter A
 Group 1 200 0.1 60
 Group 2 250 0.15 70
 Group 3 300 0.2 80

 Table 9. Verification experiment result.

 Predicted
 Actual average HLD Error
 HLD
 Group 1 572 570 0.35%
 Group 2 451 455 0.88%
 Group 3 406 398 2.01%

 Figure 11 Phase diagram and hardness of validation experiments 1 and 3

 4.4. Analysis and validation of optimum parameters
 According to analysis, the spindle speed, feed rate, and current can influence the
 temperature, and then the workpiece hardness and mechanical properties are influenced.
 According to the contour diagram of spindle speed and feed rate to surface hardness,
 when the current is fixed at I=70A, the lower the spindle speed and feed rate are, the better
 is the material hardening effect, the results are shown in figure 12. According to the con-
 tour diagram of feed rate and current value to surface hardness, when the spindle speed
 is fixed at N = 250rpm, the higher the current is and the lower the feed rate is, the better is
 the material hardening effect, the results are shown in figure 13. According to the contour
 diagram of spindle speed and current value to surface hardness, when the feed rate is
 fixed at F = 0.15, the higher the current is and the lower the spindle speed is, the better is
 the material hardening effect, the results are shown in figure 14. Because the shorter the
 distance acting on the material per unit time is, the better is the hardening effect.
Preprints (www.preprints.org) | NOT PEER-REVIEWED | Posted: 23 June 2021 doi:10.20944/preprints202106.0583.v1

 Figure 12. Contour diagram of spindle Figure 13. Contour diagram of feed rate
 speed and feed rate to surface hardness and current value to surface hardness

 Figure 14. Contour diagram of spindle speed
 and current value to surface hardness.

 According to the above contour diagrams, the lower the spindle speed and feed rate
 are and the higher the current is, the better is the hardening effect. The optimization pa-
 rameter planning and design can refer to the contour diagrams, figure 15 shows the opti-
 mization parameter design, when the spindle speed is 168rpm, the feed rate is 0.68mm/rev
 and the current is 86A, the hardening effect can be maximized.

 Figure 15. Optimum parameter design.

 Finally, the RSM is used to establish the optimal mechanical hardness for the valida-
 tion experiment, the experimental results are shown in Table 10, the hardening effect is
 806 HLD (61 HRC), the error between the experimental result and the optimum solution
 from the model is 4%, the material hardness value is increased by 163%. The metallo-
 graphic structure shows that the original flake graphite chemically reacts with peripheral
 ferrite due to the high temperature, the cementite is precipitated (Fe 3C). figure 16 shows
 that many white dots are steatite, the material contains phosphor element, iron element,
 and carbon element, which form the Fe-Fe3-Fe3p ternary eutectic at high temperature, and
 then the steatite structure is precipitated, the substrate is supposed to be pearlite +
Preprints (www.preprints.org) | NOT PEER-REVIEWED | Posted: 23 June 2021 doi:10.20944/preprints202106.0583.v1

 austenite mixture, so the increase in the hardness may result from the cementite and ste-
 atite in the structure.

 Table 10. Experimental results of optimum parameters.

 Material hardness HLD Optimal material hardness HLD
 Response value 306 806

 Figure 16. Material phase diagram of optimum parameters.

 6. Conclusion
 In the online heat treatment process, the method is used for process optimization and
 reducing the die cost. The experimental equipment includes a DC variable frequency
 plasma welder and CNC lathe for simulating the surface heat treatment process after
 mold machining, the actual effect of spindle speed, feed rate, and current factors on sur-
 face hardening are discussed. The RSM regression analysis model, ANOVA, Pareto chart,
 and Lack-of-Fit test statistics are used to discuss the interaction between significant factors
 and factors in the process. The design of the experiment is a full factorial experiment, the
 Central Composite Design is combined with RSM, to discuss the factor-surface hardness
 contour diagram and optimum parameters, validating the effect of optimum parameters
 on enhancing surface hardness. This study is concluded as follows.
 1. According to the equation conversion and actual temperature rise measure-
 ment, the experimental machine thermal efficiency is 0.44, the temperature
 prediction model is built according to 27 groups of experimental results of a
 full factorial experiment, the model equation is validated by 95% confidence
 interval, the actual temperature rises of five groups of validation experiment
 results fall in this interval.
 2. The temperature model MPAE is 1.36%, it is high accuracy prediction, the
 MAPE of temperature repeatability experiment is 1.41%, it is high accuracy
 prediction.
 3. According to the screening experiment result, the spindle speed is reduced
 by 100rpm, the surface hardness is increased by at most 31%, the feed rate is
 reduced by 0.1mm/rev, the surface hardness is increased by at most 64%, the
 current is increased by 20A, the surface hardness is increased by at most 34%.
 4. The metallographic structure of the material is pearlite + ferrite + flake graph-
 ite, when the surface hardness is 479HLD, most of the pearlite in the struc-
 ture is dissolved in the base pearlite. When the surface hardness is 613HLD,
 the flake graphite in the structure is changed into cementite structure, the
Preprints (www.preprints.org) | NOT PEER-REVIEWED | Posted: 23 June 2021 doi:10.20944/preprints202106.0583.v1

 cementite reacts with phosphor element to precipitate ternary eutectic stea-
 tite structure.
 5. The optimization experiment uses 20 groups of Central Composite Design,
 the significant factor relationships are current > feed rate > spindle speed, the
 model and equation are validated by 95% confidence interval, the three
 groups of validation experiment results show that the average hardness val-
 ues fall in this interval.
 6. According to the contour diagrams and response surface diagram, the opti-
 mum parameters are spindle speed 163rpm, feed rate 0.068mm/rev, and cur-
 rent 86A. The material processing hardening objective of optimum parame-
 ters is 839, according to the experimental results of optimum parameters, the
 experimental material is increased from 306 HLD to 806 HLD, the hardening
 effect is enhanced by 163%, the error from the expected value is 4%. In our
 simulated heating experiment, the simultaneous movement of the spindle
 and the saddle causes the difficulty of temperature measurement technology,
 so the high temperature and speed do not consider the measurement, how-
 ever, not considered in the current and quenching study and maybe research
 topic in the future.
 Reference:
 1. Li M. R. Zhang J., Sun Y., 2003, "Application of Plasma Arc Quenching Process on Tank Parts", Journal of Shenyang
 University of Technology, Vol. 25, Issue 1.
 2. Zhou Q., 2006, "Development and Research of Plasma Surface Quenching Control System", Shenyang University of
 Technology, Master's degree thesis.
 3. Cui H. Z., Yin H. W., 2000, New technology of plasma beam surface hardening on a cylinder, Heat Treatment of
 Metals, Vol 3, 28-29.
 4. Yang L. J., 2007, Th.e effect of specimen thickness on the hardness of plasma surface hardened ASSAB 760 steel
 specimens, Journal of Materials Processing Technology, Vol. 6, 113-119.
 5. Etsion I., 2005, State of the art in laser surface texturing, Journal of Tribology Transactions of the ASME, Vol. 27,
 248-253.
 6. Huang S. F., 2012, Laser surface hardening treatment of medium carbon chromium-molybdenum steel AISI4140,
 Journal of china university of science and technology, Vol. 50.
 7. Chen H. Q., 2003, Research on Laser Surface Hardening of Tool Steel", Institute of Materials Science and Engineering,
 National Dong Hwa University, Master's degree thesis.
 8. Lusquinos F., Code J. C., Bonss S.,et al., 2007, Theoretical and experimental analysis of high power diode laser
 (HPDL) hardening of AISI 1045 steel, Applied Surface Science, 254(4), 948~954.
 9. E. J. N. L. Silva, J. F. N. Giraldes, C. O. de Lima, V. T. L. Vieira, C. N. Elias, H. S., 2019, Influence of heat treatment
 on torsional resistance and surface roughness of nickel-titanium instruments, Vol. 52, Issue 11,
 https://doi.org/10.1111/iej.13164.
 10. Lin Y. C., Chen H. M., Chen Y. C., 2013, Analysis of microstructure and wear performance of SiC clad layer on
 SKD61 die steel after gas tungsten arc welding, Materials, and Design, Vol.47, 828-835.
 11. Tasy L. W., Lin Z. W., Shiue R. K., and Chen C., 2000, Hydrogen embrittlement susceptibility of laser-hardened 4140
 steel”, Materials Science and Engineering A, Vol. 290, 46-54.
 12. Rong Y, Zuo X, Chen N., 2018, Clean water-air alternative timed quenching (ATQ) technology: principle and appli-
 cations, Jinshu Rechuli/Heat Treat Met., 43(4), 1–9.
Preprints (www.preprints.org) | NOT PEER-REVIEWED | Posted: 23 June 2021 doi:10.20944/preprints202106.0583.v1

 13. Kyriakos Komvopoulos, 2011, Mechanical Testing of Engineering Materials, University of California—Berkeley,
 Cognella.
 14. Marcio Abreu, Jill Sundberg, Jessica Elfsberg, Stefan Jonsson, 2020, Morphology and mechanisms of cavitation dam-
 age on lamellar gray iron surfaces, WEAR, Vol.456-457,15.
 15. Park I. C., Lee H. K., Kim S. J., 2019, Microstructure and cavitation damage characteristics of surface-treated gray
 cast iron by plasma ion nitriding, Appl. Surf. Sci. 477, 147–153.
 16. Dharmen TailorK. N. SrinivasanS. A. ChanniwalaM. Sohel M. Panwala, 2009, Simulation of temperature field of
 TIG welding using FDM, ASME, Pressure Vessels and Piping Conference.
 17. Jung N. H., Ahn J. H., Lee M. J., Kang N. H., Cho K. M., 2019, Formation Behavior of δ Ferrite Within LB and GTA
 Weld Zones of Mod. 9Cr-1Mo Steel in Terms of Thermal History, Korean Journal of Metals and Materials, 56(2), 93-
 102. DOI: https://doi.org/10.3365/KJMM.2018.56.2.93
 18. W. Zhongyin, D. Liguang, and X. Faren, “Study of heat conduction mathematic model of plasma hot machining,”
 Journal of Guangxi Institute of Technology, vol. 5, no. 4, pp. 45–50, 1994.
 19. H.-Y. Bor, A Study on the Elevated Temperature Brittleness and Fracture Mechanism of Mar-M247 Super-Alloy,
 National Chiao Tung University, Hsinchu, Taiwan, 1998.
 20. Chen S. H. and Tsai K. T., 2018, Predictive Analysis for the Thermal Diffusion of the Plasma-Assisted Machining of
 Superalloy Inconel-718 Based on Exponential Smoothing, Advances in Materials Science and Engineering Vol. 2018,
 Article ID 9532394
 21. Jiang Y. S., 2018, Machinery Materials II, National Taiwan University of Science and Technology Books.
 22. Liu G. X., 2014, Engineering Materials Science, Quanhua Books.
 23. Milton Ohring, 1995, Engineering Materials Science 1st Edition, Academic Press
 24. Dong J. L., 1985, "Steel Material", Sanmin Publishing House
 25. Angela Dean, Daniel Voss, Danel Draguljić, 2017, Response Surface Methodology, Design and Analysis of Experi-
 ments, pp 565-614
 26. Russell R. Barton, 2016, Response Surface Methodology, Encyclopedia of Operations Research and Management
 Science, https://doi.org/10.1007/978-1-4419-1153-7_1143.
 27. LEWIS.C.D, 1982, Industrial and Business Forecasting Methods, London: Butterworth.
 28. Aref Shokri, 2018, Application of Sono–photo-Fenton process for degradation of phenol derivatives in petrochemi-
 cal wastewater using full factorial design of experiment, International Journal of Industrial Chemistry vol. 9, 295–
 303.
You can also read