Development and validation for prognostic nomogram of epithelial ovarian cancer recurrence based on circulating tumor cells and ...
←
→
Page content transcription
If your browser does not render page correctly, please read the page content below
www.nature.com/scientificreports
OPEN Development and validation
for prognostic nomogram
of epithelial ovarian
cancer recurrence based
on circulating tumor cells
and epithelial–mesenchymal
transition
Jiani Yang1,2, Jun Ma1,2, Yue Jin1, Shanshan Cheng1, Shan Huang1, Nan Zhang1 & Yu Wang1*
We aimed to determine the prognosis value of circulating tumor cells (CTCs) undergoing epithelial–
mesenchymal transition in epithelial ovarian cancer (EOC) recurrence. We used CanPatrol CTC-
enrichment technique to detect CTCs from blood samples and classify subpopulations into epithelial,
mesenchymal, and hybrids. To construct nomogram, prognostic factors were selected by Cox
regression analysis. Risk stratification was performed through Kaplan–Meier analysis among the
training group (n = 114) and validation group (n = 38). By regression screening, both CTC counts (HR
1.187; 95% CI 1.098–1.752; p = 0.012) and M-CTC (HR 1.098; 95% CI 1.047–1.320; p = 0.009) were
demonstrated as independent factors for recurrence. Other variables including pathological grade,
FIGO stage, lymph node metastasis, ascites, and CA-125 were also selected (p < 0.005) to construct
nomogram. The C-index of internal and external validation for nomogram was 0.913 and 0.874. We
found significant predictive values for the nomogram with/without CTCs (AUC 0.8705 and 0.8097).
Taking CTC counts and M-CTC into separation, the values were 0.8075 and 0.8262. Finally, survival
curves of risk stratification based on CTC counts (p = 0.0241), M-CTC (p = 0.0107), and the nomogram
(p = 0.0021) were drawn with significant differences. In conclusion, CTCs could serve as a novel factor
for EOC prognosis. Nomogram model constructed by CTCs and other clinical parameters could predict
EOC recurrence and perform risk stratification for clinical decision-making.
Trial registration Chinese Clinical Trial Registry, ChiCTR-DDD-16009601, October 25, 2016.
Ovarian cancer was a leading cause of death among gynecological cancers, with 21,750 new cases and 13,940
deaths estimated for 2020 in the United States1. Due to the lack of early symptoms and physical signs, over 70%
of patients are diagnosed as advanced stages, resulting in a poor prognosis with a 10-year survival rate of 5–21%2.
Despite development in treatment techniques, approximately 80% of epithelial ovarian cancer (EOC) patients
will suffer cancer recurrence after the primary treatment of standard cytoreductive surgery followed by adjuvant
platinum-based chemotherapy3.
Therefore, effective methods for predicting EOC prognosis are of clinical significance to improve survival.
The circulating tumor cells (CTCs), originating from solid tumors, are related to the hematogenous metastasis
of various carcinomas, such as breast, prostate, and ovarian cancer4–6. CTCs disseminate to distant sites through
phenotypic changes, including epithelial–mesenchymal transition (EMT) that could help them to penetrate
blood vessels7. In hepatocellular carcinoma, Qi et al.8 demonstrated that the epithelial-to-mesenchymal–CTC
ratio was significantly associated with cancer recurrence and progression. Thus, apart from CTC counts,
1
Department of Obstetrics and Gynecology, Renji Hospital, School of Medicine, Shanghai Jiaotong University,
Shanghai, China. 2These authors contributed equally: Jiani Yang and Jun Ma. *email: renjiwangyu@126.com
Scientific Reports | (2021) 11:6540 | https://doi.org/10.1038/s41598-021-86122-4 1
Vol.:(0123456789)
www.nature.com/scientificreports/
Variables Total (n = 152) Training group (n = 114) Validated group (n = 38) p-value
Age (years) 58.06 ± 9.47 57.81 ± 10.25 58.10 ± 9.73 0.879
BMI (kg/m2) 22.86 ± 0.73 22.91 ± 0.47 22.85 ± 0.93 0.604
Menopausal status, n (%) 0.924
Pre/peri-menopause 65 (42.76%) 49 (32.24%) 16 (10.53%) –
Post-menopause 87 (57.24%) 65 (42.76%) 22 (14.47%) –
Fertility history, n (%) 0.852
0–1 82 (53.95%) 62 (40.79%) 20 (13.16%) –
≥2 70 (46.05%) 52 (34.21%) 18 (11.84%) –
Tumor size (cm) 7.26 ± 3.15 6.39 ± 4.62 7.37 ± 3.21 0.285
Pathological grade, n (%) 0.765
G1–2 51 (33.55%) 39 (25.66%) 12 (7.89%) –
G3 101 (66.45%) 75 (49.34%) 26 (17.11%) –
FIGO stage, n (%) 0.748
I–II 39 (25.66%) 30 (19.74%) 9 (5.92%) –
III–IV 113 (74.34%) 84 (55.26%) 29 (19.08%) –
Lymph node metastasis, n (%) 72 (47.37%) 52 (34.21%) 20 (13.16%) 0.453
Ascites, n (%) 58 (38.16%) 43 (28.29%) 15 (9.87%) 0.847
Histological type, n (%) 0.954
Serous 92 (60.53%) 69 (45.39%) 23 (15.13%) –
Mucinous 24 (15.79%) 18 (11.84%) 6 (3.95%) –
Endometrioid 17 (11.18%) 12 (7.89%) 5 (3.29%) –
Others 19 (12.50%) 15 (9.87%) 4 (2.63%) –
Table 1. Baseline clinicopathological characteristics of the 152 epithelial ovarian cancer (EOC) patients
involved grouped by training set and validation set. BMI Body Mass Index, FIGO the International Federation
of Gynecology and Obstetrics.
mesenchymal–CTC (M-CTC) percentage also has clinical relevance as a minimal-invasive approach to predict
cancer recurrence and guide clinical t herapy8,9.
Recently, CTC detection and isolation based on physical properties have been applied in various solid
tumors6,10,11. However, these approaches might fail to classify aggressive CTC subpopulations that undergo the
EMT process. In this study, we used the CanPatrol CTC-enrichment technique based on the RNA in situ hybridi-
zation (RNA-ISH) to identify and classify all CTC subpopulations including epithelial (E-CTCs), mesenchymal
(M-CTCs), and epithelial/mesenchymal hybrids (hybrid-CTCs) with high e fficiency12. This technique has been
used in a range of carcinomas to predict p rognosis8,13. However, to the best of our knowledge, this is the first
prospective study to classify the prognosis value CTC of subpopulations undergoing EMT in EOC through the
CanPatrol CTC-enrichment approach.
Moreover, given the poor prognosis of EOC, an effective risk stratification system is of great importance for
clinicians in the therapeutic decision-making p rocess14. So, we aimed to construct the nomogram, a comprehen-
sive model with a graphical representation that could evaluate the numerical probability of cancer recurrence
for individual15. Most previous prognosis models were constructed based on general factors such as clinical
stage, pathological grade, tumor histology, and CA-125, with limited predictive value16,17. So, the objective of
our prospective study was to construct and validate the prognosis nomogram based on CTCs, more accurately
as compared to current models in practice. By using this nomogram for risk stratification, we hope to develop a
prediction tool, which could support therapeutic decision-making and might consequently improve the prog-
nosis of EOC patients.
Results
Clinicopathological characteristics. Demographic and clinicopathological features of all the EOC
patients, including the training group (n = 114) and validated group (n = 38), were listed in Table 1 and Table 2.
Patients with early-stage (FIGO I or II) and advanced stage (FIGO III or IV) accounted for 39 (25.66%) and
113 (74.34%), respectively. Patients diagnosed as low pathological grade (G1–G2) and high pathological grade
(G3) accounted for 51 (33.55%) and 101 (66.45%) of all patients involved. There were 72 (47.37%) patients
with histology-proved lymph node metastasis, and 58 (38.16%) cases presented with ascites. The mean value
(± SD) of CTC counts in 5 mL of blood, M-CTC percentage, E-CTC percentage, and hybrids-CTC percentage
were 8.70 ± 5.69, 0.24 ± 0.19, 0.57 ± 0.25, and 0.19 ± 0.11, respectively. The mean value (± SD) of CA-125 was
990.71 ± 365.41 (U/mL).The median time of follow-up was 30 months (range 24–35 months). The investigated
clinical data of patients from both groups were analyzed and no significant difference was found, indicating
no selection bias (p-value ≥ 0.05). Moreover, we also involved 30 patients diagnosed with benign gynecologic
diseases as controls, with the mean age of 57.98 ± 9.53. Among the control group, the mean value (± SD) of CTC
counts in 5 mL of blood, M-CTC percentage, and CA-125 were 1.04 ± 0.73, 0.02 ± 0.08, and 14.26 ± 7.31 (U/mL),
significantly lower compared to those EOC patients (p-value < 0.05).
Scientific Reports | (2021) 11:6540 | https://doi.org/10.1038/s41598-021-86122-4 2
Vol:.(1234567890)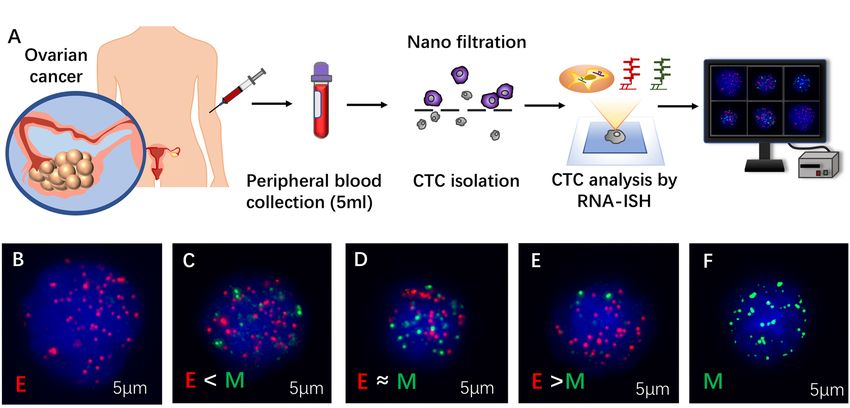
www.nature.com/scientificreports/
Variables Total (n = 152) Training group (n = 114) Validated group (n = 38) p-value
CTC counts (n/5 mL) 8.70 ± 5.69 8.64 ± 5.38 8.72 ± 4.65 0.935
M-CTC (n %) 0.24 ± 0.19 0.25 ± 0.21 0.22 ± 0.14 0.413
E-CTC (n %) 0.57 ± 0.25 0.56 ± 0.17 0.59 ± 0.23 0.392
Hybrids-CTC (n %) 0.19 ± 0.11 0.21 ± 0.18 0.20 ± 0.14 0.755
Neutrophil (109/L) 5.22 ± 2.91 4.67 ± 2.83 5.31 ± 1.96 0.198
lymphocyte (109/L) 1.42 ± 0.63 1.46 ± 0.85 1.37 ± 0.77 0.564
Platelet (109/L) 320.39 ± 78.68 299 ± 73.94 314 ± 80.21 0.291
Albumin (g/L) 40.49 ± 6.58 38.27 ± 9.38 41.22 ± 10.02 0.101
CA-125 (U/mL) 990.71 ± 365.41 1001.23 ± 330.98 986.53 ± 310.27 0.810
CA-199 (U/mL) 129.03 ± 53.18 121.88 ± 48.27 132.5 ± 59.12 0.270
AFP (ng/mL) 6.21 ± 4.78 6.43 ± 5.99 5.93 ± 3.45 0.627
CEA (ng/mL) 3.02 ± 2.57 2.95 ± 2.60 3.21 ± 2.47 0.589
HE4 (pmol/L) 536.12 ± 54.48 542.32 ± 79.39 521.39 ± 62.10 0.141
Table 2. Clinical features of the 152 epithelial ovarian cancer (EOC) patients involved grouped by training
set and validation set. CTCcirculating tumor cell, M-CTCmesenchymal CTCs/ total CTCs percentage,
E-CTCepithelial CTCs/ total CTCs percentage, Hybrids-CTChybrids CTCs/ total CTCs percentage, CA-125
carbohydrate antigen-125, CA-199 carbohydrate antigen-199, CEA carcinoembryonic antigen, AFP alpha-
fetoprotein, HE4 human epididymis protein 4.
Figure 1. (A) Total CTC counts (top) and percentage of each CTC category (bottom) before treatment in
ovarian cancer patients with or without recurrence. (B) The CTC image and (C) Magnetic Resonance Imaging
(MRI) image of a representative patient who had the CTC-positive blood sample before treatment. (D) After
tumor resection, the patient suffered cancer recurrence with (E) detectable liver metastasis observed by
Magnetic Resonance Imaging (MRI) at 6-month follow-up.
Univariable and multivariate regression analysis of training group. Figure 1 showed that patients
suffered cancer recurrence had higher CTC counts and M-CTC percentage (p-value < 0.05). To further deter-
mine the independent predictive indexes, univariate and multivariate analyses were performed (Table 3). In
the univariable COX regression analysis, parameters including age, tumor size, menopausal status, pathological
grade, FIGO stage, lymph node metastasis, ascites, CTC counts, M-CTC percentage, albumin level, CA-125
and HE4 were significantly associated with ovarian cancer recurrence. Then, these indicators were included
into the multivariate Cox hazards model for further analysis. The results demonstrated that pathological grade
(HR 1.382; 95% CI 1.104–3.965; p = 0.041), FIGO stage (HR 2.391; 95% CI 1.230–4.377; p = 0.011), lymph
node metastasis (HR 1.312; 95% CI 1.029–2.975; p = 0.039), ascites (HR 1.215; 95% CI 1.067–1.806; p = 0.026),
CTC counts (HR 1.187; 95% CI 1.098–1.752; p = 0.012), M-CTC percentage (HR 1.098; 95% CI 1.047–1.320;
p = 0.009) and CA-125 (HR 1.097; 95% CI 1.021–1.373; p = 0.028) were independent prognostic factors for OS
of EOC patients (Table 3).
Scientific Reports | (2021) 11:6540 | https://doi.org/10.1038/s41598-021-86122-4 3
Vol.:(0123456789)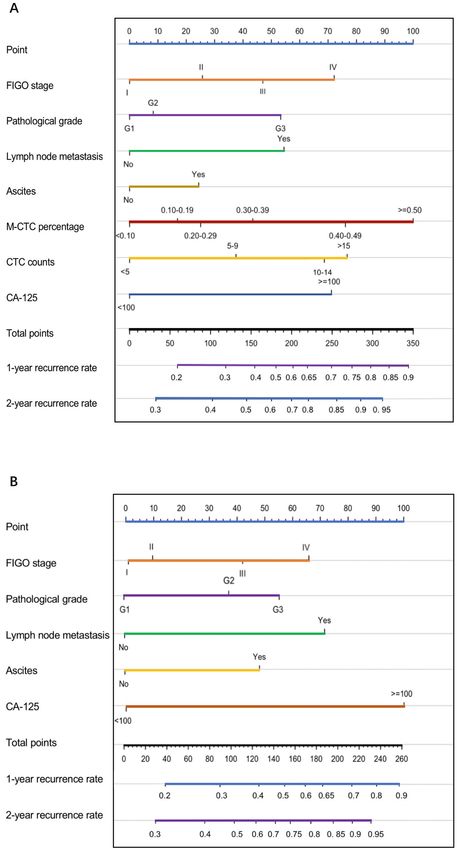
www.nature.com/scientificreports/
Univariate analysis Multivariate analysis
Variables Hazard ratio 95% CI* p-value Hazard ratio 95% CI* p-value
Age (years) 1.131 1.028–1.954 0.045 1.089 0.922–1.317 0.058
BMI (kg/m2) 1.016 0.969–1.064 0.514 – – –
Tumor size (cm) 1.271 1.014–1.298 0.048 0.933 0.815–1.069 0.314
Menopausal status
Pre/peri-menopause Reference – – Reference – –
Post-menopause 1.153 1.037–1.209 0.047 3.498 0.196–6.374 0.394
Fertility history
0–1 Reference – – – – –
≥2 0.989 0.967–1.025 0.574 – – –
Pathological grade
G1–2 Reference – – Reference – –
G3 1.509 1.031–4.506 0.034 1.382 1.104–3.965 0.041
FIGO stage
I–II Reference – – Reference – –
III–IV 2.534 1.293–4.966 0.007 2.391 1.230–4.377 0.011
Lymph node metastasis
Negative Reference – – Reference – –
Positive 1.269 1.045–3.582 0.036 1.312 1.029–2.975 0.039
Ascites
Negative Reference – – Reference – –
Positive 1.123 1.042–1.301 0.017 1.215 1.067–1.806 0.026
CTC counts (n/5 mL) 1.241 1.108–1.384 0.009 1.187 1.098–1.752 0.012
M-CTC (n %) 1.147 1.051–1.288 0.006 1.098 1.047–1.320 0.009
E-CTC (n %) 0.983 0.857–2.694 0.148 – – –
Hybrids-CTC (n %) 1.058 0.894–1.753 0.365 – – –
Neutrophil (10 9/L) 1.015 0.992–1.038 0.207 – – –
Lymphocyte (109/L) 1.066 0.888–1.278 0.494 – – –
Platelet (109/L) 1.002 0.997–1.007 0.351 – – –
Albumin (g/L) 0.909 0.849–0.972 0.025 1.027 0.980–1.077 0.266
CA-125 (U/mL) 1.101 1.002–1.203 0.019 1.097 1.021–1.373 0.028
CA-199 (U/mL) 0.977 0.942–1.012 0.198 – – –
AFP (ng/mL) 1.001 0.963–1.040 0.958 – – –
CEA (ng/mL) 1.001 0.999–1.012 0.805 – – –
HE4 (pmol/L) 1.217 1.104–1.232 0.039 0.959 0.850–1.081 0.489
Table 3. Clinicopathological features selection using the univariable and multivariate Cox logistic regression
model among the training group. BMI Body Mass Index, FIGO the International Federation of Gynecology
and Obstetrics, CTCcirculating tumor cell, M-CTCmesenchymal CTCs/ total CTCs percentage, E-CTC
epithelial CTCs/ total CTCs percentage, Hybrids-CTChybrids CTCs/ total CTCs percentage, CA-125
carbohydrate antigen-125, CA-199 carbohydrate antigen-199, CEA carcinoembryonic antigen, AFP alpha-
fetoprotein, HE4 human epididymis protein 4.
Construction of EOC recurrence nomogram. The clinicopathological parameters (FIGO stage,
pathological grade, lymph node metastasis, ascites, CTC counts, M-CTC percentage, and CA-125) selected by
both univariable and multivariate Cox logistic regression were channeled into construction of the nomogram
(Fig. 2A), while a nomogram without CTC counts and M-CTC percentage were also constructed for compari-
son (Fig. 2B). In the training group, the C-index values of 1000 sample bootstraps were 0.913 and 0.832 for the
nomograms with and without CTCs. When applied to the validation cohort, the C- index values were 0.874 and
0.782, respectively, which showed a significant prognosis value of discrimination in both cohorts for the nomo-
gram with CTC counts and M-CTC percentage.
Further risk stratification in EOC patients calibration curves manifested that the probability of predicted
1-year and 2-year recurrence rate in nomogram was well consistent between the predicted outcome of cancer
recurrence and actual observation in the training group (Fig. 3A,B). Moreover, in the external validation group,
the calibration curves also illustrated good validation between predicted and observed 1- and 2-year recurrence
proportions (Fig. 3C,D). The discrimination and calibration validation of the external group certificated that
nomogram models in this study were comparatively accurate enough to predict the recurrence probability of
patients with EOC.
Scientific Reports | (2021) 11:6540 | https://doi.org/10.1038/s41598-021-86122-4 4
Vol:.(1234567890)www.nature.com/scientificreports/
Figure 2. The nomogram models 1-year recurrence rate and 2-year recurrence rate of ovarian cancer patients
(A) based on CTC counts and M-CTC percentage; (B) without CTC counts and M-CTC percentage. The
nomogram plots were generated by the “rms” package of R software18.
Scientific Reports | (2021) 11:6540 | https://doi.org/10.1038/s41598-021-86122-4 5
Vol.:(0123456789)www.nature.com/scientificreports/
Figure 3. The calibration curves of internal (A, B) and external (C, D) validation of the nomogram constructed
in the training group based on CTCs count and M-CTC percentage. The predicted probabilities of 1-year
and 2-year recurrence were consistent with the actual recurrence proportions of ovarian cancer patients. The
calibration plots were generated by the “rms” package of R s oftware18.
Risk stratification in EOC patients. According to the ROC curve, the AUC values of CTC counts,
M-CTC percentage, and CA-125 were 0.8073, 0.8262, and 0.7735, respectively (Fig. 4A). For the nomogram
with/without CTC counts and M-CTC percentage, the AUCs were 0.8705 and 0.8097 (Fig. 4B). Meanwhile, as
illustrated in Fig. 4C,D, the discriminatory values of CTC counts and M-CTC percentage were significant among
ovarian cancer patients, with the log-rank p-value of 0.0241 and 0.0107, respectively. When stratified by CTC
counts, patients with CTCs ≥ 9 and 5 ≤ CTCs < 9 were associated with a 1.98-fold increase (95% CI 1.04–2.47)
and 1.24-fold increase (95% CI 1.07–2.29) of recurrence rate, comparing to those with CTCs < 5, while patients
with M-CTC percentage ≥ 0.3 and 0.1 ≤ M-CTC < 0.3 were associated with a 2.10-fold increase (95% CI 1.54–
2.66) and 1.43-fold increase (95% CI 1.14–2.53) of recurrence rate, comparing to those with M-CTC < 0.1.
Moreover, the patients were then divided into three risk groups (low-, intermediate- and high-risk groups)
based on the nomogram-predicted recurrence probabilities. For the nomogram without CTCs, when compared
with the low-risk group, the high-risk and intermediate-risk groups were associated with a 2.37-fold increase
(95% CI 1.28–4.83) and 1.48-fold increase (95% CI 1.17–2.64) in the risk of recurrence, with the p-value of 0.0021
(Fig. 4E). Separately, the log-rank p-values were 0.0386 between high and intermediate risk groups, while 0.0930
between intermediate-risk and low-risk groups. Meanwhile, in the CTCs based nomogram, the high-risk and
intermediate-risk groups were associated with a 3.14-fold increase (95% CI 1.16–4.50) and 1.86-fold increase
(95% CI 1.70–3.96) in the risk of recurrence, with the p-value of 0.0002 (Fig. 4F). Separately, the log-rank
p-values were 0.0292 between high-risk and intermediate-risk groups, while 0.0491 between intermediate-risk
and low-risk groups.
Scientific Reports | (2021) 11:6540 | https://doi.org/10.1038/s41598-021-86122-4 6
Vol:.(1234567890)www.nature.com/scientificreports/
Figure 4. The receive operating characteristic (ROC) curve of patients stratified by (A) CTC counts, M-CTC
percentage, and CA-125; (B) nomogram-based risk groups The Kaplan–Meier curves for DFS of all the patients
involved stratified by (C) M-CTC percentage; (D) CTC counts and risk groups of the nomogram (E) without or
(F) with CTC counts and M-CTC percentage.
Discussion
The clinical value of CTCs is constantly growing, as they could serve precision-medicine-based treatment of
EOC patients by stratifying those with potential high recurrence risk. In this prospective study, we developed and
validated a novel nomogram based on CTCs and other clinicopathological variables to categorize EOC patients
concerning tumor recurrence. We also found that the presence of CTC subpopulations, especially the M-CTC
percentage is associated with ovarian cancer recurrence. To our knowledge, this is the very first recurrence risk
stratification developed for EOC patients especially refer to CTCs undergoing EMT.
Increasing evidence indicated that CTCs count is an independent predictor for prognosis in various solid
carcinoma, including breast cancer, prostate cancer, and hepatocellular cancer. The breast cancer studies have
demonstrated that patients with CTCs < 5 per 7.5 mL blood would suffer shorter PFS (2.1 months vs 7.0 months,
p < 0.001)19,20. In prostate cancer, CTCs count is considered as an independent predictor of the overall survival
rate among castration-resistant prostate cancer patients (p < 0.05)6. However, regarding ovarian cancer, whether
CTCs detection was associated with prognosis remains c ontroversial10,21. Judson et al.21 characterized CTCs
by immunomagnetic beads conjugated to epithelial markers followed with the microscopic evaluation refer to
specific cytoplasmic staining and did not find a significant correlation between CTCs and prognosis. In contrast,
Scientific Reports | (2021) 11:6540 | https://doi.org/10.1038/s41598-021-86122-4 7
Vol.:(0123456789)www.nature.com/scientificreports/
Poveda et al.10 analyzed CTCs using the CellSearch system and concluded that elevated CTCs could impart
unfavorable prognoses of ovarian cancer patients. Differences in isolation and characterization technique in
previous studies make it difficult to combine conclusions in a greement22. So, the standardization of CTCs detec-
tion techniques is of great importance. In our study, we revealed that CTCs count was an independent prognosis
factor for ovarian cancer recurrence through both univariable and multivariable analyses using the CanPatrol
CTC-enrichment technique System. The high sensitivity of the CanPatrol technique might be attributed to a
simple filter-based separation method that might reduce CTC loss caused by the complicated washing and
centrifugation process23.
Meanwhile, the routine approach of the Cellsearch System used in previous studies might fail to detect CTCs
undergoing EMT, since it only isolates CTCs by the only tumor epithelial cell expression of E pCAM11,23 and not
mesenchymal ones without epithelial markers. Thus, we used the CanPatrol CTC-enrichment technique System
to detect aggressive CTCs subpopulations that might have undergone EMT through various target sequences,
including EpCAM, CD45, CK8/18/19, vimentin, and Twist5. For hepatocellular carcinoma, a previous study
concluded that M-CTC percentage ≥ 2% before the operation was a novel predictor for early recurrence with the
AUC 0.75 (95% CI 0.66–0.84)8, which was partly consistent with our finding that ovarian cancer patients with
M-CTC percentage ≥ 0.3 and 0.1 ≤ M-CTC < 0.3 were associated with a 2.10-fold increase and 1.43-fold increase
of recurrence rate, when compared to those with M-CTC < 0.1. However, regarding the results of univariable
regression analysis, E-CTC percentage and hybrid-CTC percentage were not considered as independent prog-
nostic factors for OS of EOC patients (p-value ≥ 0.05). To the best of our knowledge, this is the first study to
reveal the considerable clinical value of both CTC counts and M-CTC percentage in ovarian cancer prognosis.
Moreover, we aimed to develop a predictive nomogram to help facilitate the risk triage of ovarian cancer
recurrence. Besides the presence of CTCs, we also selected several routinely collected risk factors including
pathological grade, FIGO stage, lymph node metastasis, ascites, and CA-125 to construct the nomogram in train-
ing group24–26. The clinical relevance of our nomogram was demonstrated by its internal and external validation
with the C-index of 0.913 and 0.874, which indicated that our model included in CTCs could provide a more
reliable predictive evaluation for ovarian cancer recurrence than previous studies26,27.
Nevertheless, we further performed risk stratification of EOC patients based on CTC counts, M-CTC per-
centage, and points derived from the nomogram. All the risk stratification was well validated by survival analysis
(p < 0.05) with the AUC higher than 0.75 as well. According to risk stratification, especially by the nomogram,
we could carry out individualized and targeted treatment to improve the prognosis of ovarian cancer.
However, there are also some limitations of our study. Firstly, the prospective study enrolled a relatively
small sample size of 152 EOC patients in a single-center, which might limit the accuracy of results. To overcome
this problem, additional multi-center studies with a larger sample size would be of great importance to further
validate our results. Second, detection efficiency might be biased since the CanPatrol system is a filtration-based
system, allowing small CTCs to easily cross the barrier. Thus, other CTCs collection techniques might also be
used to improve detection efficiency in future studies.
In conclusion, CTCs, especially those undergoing EMT hold promise prognostic value as minimally-invasive
biomarkers for ovarian cancer recurrence. By the advanced CanPatrol CTC-enrichment technique, our study
evaluated both CTC counts and M-CTC percentage to clarify their clinical value. The prognostic nomogram
based on CTCs and EMT could support clinical decision-making and provide cues for early intervention among
EOC patients.
Methods
Study design and patients. We enrolled 181 patients with pathologically diagnosed EOC who under-
went surgery at the Department of Obstetrics and Gynecology, Renji Hospital Affiliated to Shanghai Jiaotong
University School of Medicine between June 2017 to October 2019. The criteria for inclusion in this study were:
(1) newly diagnosis EOC confirmed by pathological biopsy; (2) no coexisting cancers or prior cancers within
5 years; (3) no preoperative treatment, including neoadjuvant chemotherapy or radiotherapy. The exclusion
criteria were as follows: (1) lost to follow-up (n = 9); (2) without detailed clinical, laboratory, imaging, and treat-
ment data (n = 8); (3) underwent other treatments, such as radiotherapy or immunotherapy (n = 5); (4) without
consent to use medical information for the research purpose (n = 4), and (5) with status not allowing the treat-
ment of operation followed by chemotherapy (n = 3). As a result, 152 patients were assessed in the analysis
(Fig. 5). Moreover, we also involved 30 patients with benign gynecologic diseases at our institution as negative
controls.
In order to achieve optimal tumor debulking, the operation for all involved patients was aimed at maximal
ovarian tumor resection without visible residual tumor. The surgery was followed by standardized paclitaxel
and platinum chemotherapy. All patients were followed up until September 1st, 2020. This study was approved
by the Ethics Committee of Renji Hospital Affiliated to Shanghai Jiaotong University School of Medicine and all
involved subjects provided informed consent for use of their information for research purposes. All experiments
were performed in accordance with relevant guidelines and regulations.
Clinicopathological data collection. The clinical stage was evaluated according to the International Fed-
eration of Gynecology and Obstetrics (FIGO) stage system. Routine blood tests and tumor marker measure-
ments, including carbohydrate antigen-125 (CA-125), carbohydrate antigen-199 (CA-199), carcinoembryonic
antigen (CEA), alpha-fetoprotein (AFP), and human epididymis protein 4 (HE4) were conducted within 1 day
before surgery. The clinicopathologic variables, including age, Body Mass Index (BMI), tumor size, menopausal
status, fertility history, pathological grade, the FIGO stage, lymph node metastasis, ascites, and histological type
were reviewed from medical records. Disease-free survival (DFS) was measured from the date of surgery to the
Scientific Reports | (2021) 11:6540 | https://doi.org/10.1038/s41598-021-86122-4 8
Vol:.(1234567890)www.nature.com/scientificreports/
Figure 5. EOC Patient enrollment flow chart.
last follow-up visit or ovarian cancer recurrence, which was defined through the latest clinical evidence. The
diagnosis of EOC recurrence was performed by at least two oncologists to avoid bias.
Isolation and characterization of CTCs. Peripheral blood samples (5 mL, anticoagulated with EDTA)
were collected 1 day before treatment, stored at 2–8℃, and processed within 4 h after sampling7. To avoid poten-
tial skin cell contamination caused by venipuncture, the first 2 mL of blood was d iscarded28.
In this study, we isolated and characterized CTCs through the CanPatrol system (Fig. 6). Firstly, the blood
sample preserved in cell preservation solution was centrifuged for 5 min at a speed of 1850 rpm. After removing
the supernatant, the sample was mixed with phosphate buffer saline (PBS) and 4% formaldehyde for 8 minutes7.
For filtration, we passed the sample through the vacuum filtration system at 0.08 M Pa7.This system included a
filtration tube containing the membrane with 8-μm diameter pores, a vacuum pump, and a manifold vacuum
plate with valve settings.
RNA-ISH was used to detect CTCs through the following target sequences: CD45 (leukocyte biomarker);
vimentin and Twist (mesenchymal biomarkers); EpCAM and CK8/18/19 (epithelial biomarkers)8,29,30 (Fig. 6).
The amplification process was performed on a 24-well plate. Then, we treated the samples with protease K and
hybridized the cells with fluorescent probes specific for target sequences: red for epithelial cell adhesion molecule
(EpCAM and CK8/18/19) and green for the mesenchymal molecule (Vimentin and Twist)31. We used 40,6-diami-
dino-2- phenylindole (DAPI) to stain the nuclei, and the cells were analyzed with a fluorescent microscope
(Olympus Corporation, Tokyo, Japan)12. Based on these markers, we then classified CTCs into three subgroups:
epithelial (epithelial markers+/mesenchymal markers−/CD45−/DAPI+), mesenchymal (epithelial markers−/mes-
enchymal markers+/CD45−/DAPI+), and hybrids (epithelial markers+/mesenchymal markers+/CD45−/DAPI+).
Construction of nomogram. The dataset was randomly divided into training and validation cohorts. The
selection bias refer to the random classification of the two cohorts was adjusted32. T-test and Chi-square test
were used to analyze the differences of clinicopathologic characteristics between two cohorts for continuous and
categorical variables, respectively. The prognostic factors were determined using both univariate and multivari-
ate analyses through Cox’s hazards regression model. The nomogram and calibration plots were generated with
the “rms” package of R software18. Nomogram points, ranging from 1 to 100, were assigned refer to the weights
Scientific Reports | (2021) 11:6540 | https://doi.org/10.1038/s41598-021-86122-4 9
Vol.:(0123456789)www.nature.com/scientificreports/
Figure 6. (A) Process of circulating tumor cells (CTCs) isolation and detection by CanPatrol CTC enrichment
and ISH. (B–F) 5 representative images of patients with different CTC subpopulations, based on the RNA-
ISH of mesenchymal (vimentin and Twist, green fluorescence) and epithelial (EpCAM and CK8/18/19, red
fluorescence) markers.
for the relative importance of each model covariate determined by the final hazards regression model. In the
nomogram, the total score for each patient was evaluated as a weighted sum of the contribution from each risk
factor to predict the probability of recurrence at 1 and 2 years.
Validation of nomogram. The predictive ability of the nomogram model was measured by both discrimi-
nation and calibration. The discrimination of the nomogram model was evaluated by calibration curves, over-
laying the observed probabilities and nomogram-predicted probabilities with 95% confidence interval (95%
CI). As a measurement for internal validation, the Harrell’s concordance index (C-index) was analyzed using
tenfold cross-validation repeated for 20 times33. The calibration plots were generated by the “rms” package of R
software18.
We categorized patients into three risk groups of CTC counts, M-CTC percentage, and nomogram, based on
the X-tile (Version 3.6.1, Yale University, New Haven, USA), a newly-developed bioinformatic tool to determine
optimal cut-off points for survival a nalysis34. The X-tile software could test all possible cut-off points of target
quantitative data by Log-rank test and selected the lowest p-value and highest χ2. The EOC patients involved
were then divided into three risk groups: good, intermediate, and poor prognosis. The optimal cut-off values were
128 and 251 for the nomogram with CTCs, while 98 and 169 for the nomogram without CTCs. Taking CTCs into
separation, the values were 5 and 9 in CTC count, 0.1 and 0.3 in the M-CTC percentage. Kaplan–Meier methods
were used to generate the survival curves and the prognostic differences were assessed by Log-rank test. The
receiver operating characteristic (ROC) curve analysis was applied to identify the prognosis value of the nomo-
gram according to the Youden index and area under the curve (AUC). All the statistical analyses were conducted
by R software Version 4.0.2 (GUI 1.72 Catalina build, https: //www.R-projec t.org) and graphed using Graph Prism
Version 7.0a (GraphPad Software, San Diego, CA, USA). p-value < 0.05 was defined as statistically significant.
Data availability
The data of these findings cannot be shared at this time as the data also forms part of an ongoing study. Requests
for data will be considered by the corresponding author after publication of the study.
Received: 9 November 2020; Accepted: 10 March 2021
References
1. Siegel, R. L., Miller, K. D. & Jemal, A. Cancer statistics, 2020. CA Cancer J. Clin. 70, 7–30. https://doi.org/10.3322/caac.21590
(2020).
2. Bray, F. et al. Global cancer statistics 2018: GLOBOCAN estimates of incidence and mortality worldwide for 36 cancers in 185
countries. CA Cancer J. Clin. 68, 394–424. https://doi.org/10.3322/caac.21492 (2018).
3. Jacobs, I. J. et al. Ovarian cancer screening and mortality in the UK Collaborative Trial of Ovarian Cancer Screening (UKCTOCS):
a randomised controlled trial. Lancet 387, 945–956. https://doi.org/10.1016/S0140-6736(15)01224-6 (2016).
4. Lowes, L. E. & Allan, A. L. Circulating tumor cells and implications of the epithelial-to-mesenchymal transition. Adv. Clin. Chem.
83, 121–181. https://doi.org/10.1016/bs.acc.2017.10.004 (2018).
5. Riethdorf, S. et al. Detection of circulating tumor cells in peripheral blood of patients with metastatic breast cancer: a validation
study of the Cell Search system. Clin. Cancer Res. 13, 920–928. https://doi.org/10.1158/1078-0432.CCR-06-1695 (2007).
Scientific Reports | (2021) 11:6540 | https://doi.org/10.1038/s41598-021-86122-4 10
Vol:.(1234567890)www.nature.com/scientificreports/
6. Scher, H. I. et al. Circulating tumour cells as prognostic markers in progressive, castration-resistant prostate cancer: a reanalysis
of IMMC38 trial data. Lancet Oncol. 10, 233–239. https://doi.org/10.1016/S1470-2045(08)70340-1 (2009).
7. Wu, S. et al. Classification of circulating tumor cells by epithelial–mesenchymal transition markers. PLoS ONE 10, e0123976. https
://doi.org/10.1371/journal.pone.0123976 (2015).
8. Qi, L. N. et al. Circulating tumor cells undergoing EMT provide a metric for diagnosis and prognosis of patients with hepatocel-
lular carcinoma. Cancer Res. 78, 4731–4744. https://doi.org/10.1158/0008-5472.CAN-17-2459 (2018).
9. Burinaru, T. A. et al. Detection of circulating tumor cells using microfluidics. ACS Comb. Sci. 20, 107–126. https: //doi.org/10.1021/
acscombsci.7b00146 (2018).
10. Poveda, A. et al. Circulating tumor cells predict progression free survival and overall survival in patients with relapsed/recurrent
advanced ovarian cancer. Gynecol. Oncol. 122, 567–572. https://doi.org/10.1016/j.ygyno.2011.05.028 (2011).
11. Allard, W. J. et al. Tumor cells circulate in the peripheral blood of all major carcinomas but not in healthy subjects or patients with
nonmalignant diseases. Clin. Cancer Res. 10, 6897–6904. https://doi.org/10.1158/1078-0432.CCR-04-0378 (2004).
12. Chen, Y. et al. Circulating tumor cells undergoing EMT are poorly correlated with clinical stages or predictive of recurrence in
hepatocellular carcinoma. Sci. Rep. 9, 7084. https://doi.org/10.1038/s41598-019-43572-1 (2019).
13. Guan, X. et al. The prognostic and therapeutic implications of circulating tumor cell phenotype detection based on epithelial–mes-
enchymal transition markers in the first-line chemotherapy of HER2-negative metastatic breast cancer. Cancer Commun. (Lond.)
39, 1. https://doi.org/10.1186/s40880-018-0346-4 (2019).
14. Kim, S. I. et al. Development of web-based nomograms to predict treatment response and prognosis of epithelial ovarian cancer.
Cancer Res. Treat. 51, 1144–1155. https://doi.org/10.4143/crt.2018.508 (2019).
15. Balachandran, V. P., Gonen, M., Smith, J. J. & DeMatteo, R. P. Nomograms in oncology: more than meets the eye. Lancet Oncol.
16, e173-180. https://doi.org/10.1016/S1470-2045(14)71116-7 (2015).
16. Gerestein, C. G. et al. The prediction of progression-free and overall survival in women with an advanced stage of epithelial ovarian
carcinoma. BJOG 116, 372–380. https://doi.org/10.1111/j.1471-0528.2008.02033.x (2009).
17. Bookman, M. A. Can we predict who lives long with ovarian cancer?. Cancer 125(Suppl 24), 4578–4581. https://doi.org/10.1002/
cncr.32474(2019).
18. Harrell, Jr., F. E. rms: Regression Modeling Strategies. R package version 6.0-1. https://CRAN.R-project.org/package=rms (2020)
19. Budd, G. T. et al. Circulating tumor cells versus imaging–predicting overall survival in metastatic breast cancer. Clin. Cancer Res.
12, 6403–6409. https://doi.org/10.1158/1078-0432.CCR-05-1769 (2006).
20. Hayes, D. F. et al. Circulating tumor cells at each follow-up time point during therapy of metastatic breast cancer patients predict
progression-free and overall survival. Clin. Cancer Res. 12, 4218–4224. https://doi.org/10.1158/1078-0432.CCR-05-2821 (2006).
21. Judson, P. L. et al. Preoperative detection of peripherally circulating cancer cells and its prognostic significance in ovarian cancer.
Gynecol. Oncol. 91, 389–394. https://doi.org/10.1016/j.ygyno.2003.08.004 (2003).
22. Fan, T., Zhao, Q., Chen, J. J., Chen, W. T. & Pearl, M. L. Clinical significance of circulating tumor cells detected by an invasion assay
in peripheral blood of patients with ovarian cancer. Gynecol. Oncol. 112, 185–191. https://doi.org/10.1016/j.ygyno.2008.09.021
(2009).
23. Guo, W. et al. Clinical significance of EpCAM mRNA-positive circulating tumor cells in hepatocellular carcinoma by an optimized
negative enrichment and qRT-PCR-based platform. Clin. Cancer Res. 20, 4794–4805. https://doi.org/10.1158/1078-0432.CCR-14-
0251 (2014).
24. Cham, S. et al. Development and validation of a risk-calculator for adverse perioperative outcomes for women with ovarian cancer.
Am. J. Obstet. Gynecol. 220, 571 e571-571 e578. https://doi.org/10.1016/j.ajog.2019.02.019 (2019).
25. Duska, L. R., Java, J. J., Cohn, D. E. & Burger, R. A. Risk factors for readmission in patients with ovarian, fallopian tube, and primary
peritoneal carcinoma who are receiving front-line chemotherapy on a clinical trial (GOG 218): an NRG oncology/gynecologic
oncology group study (ADS-1236). Gynecol. Oncol. 139, 221–227. https://doi.org/10.1016/j.ygyno.2015.08.011 (2015).
26. Lee, C. K. et al. Development and validation of a prognostic nomogram for overall survival in patients with platinum-resistant
ovarian cancer treated with chemotherapy. Eur. J. Cancer 117, 99–106. https://doi.org/10.1016/j.ejca.2019.05.029 (2019).
27. Bogani, G. et al. A score system for complete cytoreduction in selected recurrent ovarian cancer patients undergoing secondary
cytoreductive surgery: predictors- and nomogram-based analyses. J. Gynecol. Oncol. 29, e40. https://doi.org/10.3802/jgo.2018.29.
e40 (2018).
28. Adams, D. L., Alpaugh, R. K., Tsai, S., Tang, C. M. & Stefansson, S. Multi-phenotypic subtyping of circulating tumor cells using
sequential fluorescent quenching and restaining. Sci. Rep. 6, 33488. https://doi.org/10.1038/srep33488 (2016).
29. Peng, H. et al. Clinical significance of red cell distribution width and circulating tumor cells with an epithelial–mesenchymal
transition phenotype in lung adenocarcinoma. Cancer Manag. Res. 12, 5105–5117. https: //doi.org/10.2147/CMAR.S25127 1 (2020).
30. Hou, J., Guo, C. & Lyu, G. Clinical significance of epithelial–mesenchymal transition typing of circulating tumour cells in colorectal
cancer. Colorectal. Dis. 22, 581–587. https://doi.org/10.1111/codi.14927 (2020).
31. Zhao, X. H. et al. Molecular detection of epithelial–mesenchymal transition markers in circulating tumor cells from pancreatic
cancer patients: Potential role in clinical practice. World J. Gastroenterol. 25, 138–150. https://doi.org/10.3748/wjg.v25.i1.138
(2019).
32. Iasonos, A., Schrag, D., Raj, G. V. & Panageas, K. S. How to build and interpret a nomogram for cancer prognosis. J. Clin. Oncol.
26, 1364–1370. https://doi.org/10.1200/JCO.2007.12.9791 (2008).
33. Harrell, F. E. Jr., Lee, K. L. & Mark, D. B. Multivariable prognostic models: issues in developing models, evaluating assump-
tions and adequacy, and measuring and reducing errors. Stat. Med. 15, 361–387. https://doi.org/10.1002/(SICI)1097-0258(19960
229)15:4%3c361::AID-SIM168%3e3.0.CO;2-4 (1996).
34. Camp, R. L., Dolled-Filhart, M. & Rimm, D. L. X-tile: a new bio-informatics tool for biomarker assessment and outcome-based
cut-point optimization. Clin. Cancer Res. 10, 7252–7259. https://doi.org/10.1158/1078-0432.CCR-04-0713 (2004).
Acknowledgements
Not applicable.
Author contributions
J.Y. and J.M. performed the study and wrote the manuscript. J.Y., S.H. and Y.J. interpreted the data and carried
out statistical analysis. S.C. and N.Z. collected patients’ samples and clinical data. Y.W., J.Y. and J.M. designed
the study. J.Y. drew the figures and took the photographs. All authors approved the final manuscript. J.Y. and
J.M. contributed equally to the work.
Funding
This work was supported by the Three-Year Action Plan of the Program of Shanghai Hospital Development
Center for Promoting Clinical Skills and Innovative Ability of Municipal Hospitals (Grant No.16CR2012A), and
the National Natural Science Foundation of China (Grant No. 81572560).
Scientific Reports | (2021) 11:6540 | https://doi.org/10.1038/s41598-021-86122-4 11
Vol.:(0123456789)www.nature.com/scientificreports/
Competing interests
The authors declare no competing interests.
Additional information
Correspondence and requests for materials should be addressed to Y.W.
Reprints and permissions information is available at www.nature.com/reprints.
Publisher’s note Springer Nature remains neutral with regard to jurisdictional claims in published maps and
institutional affiliations.
Open Access This article is licensed under a Creative Commons Attribution 4.0 International
License, which permits use, sharing, adaptation, distribution and reproduction in any medium or
format, as long as you give appropriate credit to the original author(s) and the source, provide a link to the
Creative Commons licence, and indicate if changes were made. The images or other third party material in this
article are included in the article’s Creative Commons licence, unless indicated otherwise in a credit line to the
material. If material is not included in the article’s Creative Commons licence and your intended use is not
permitted by statutory regulation or exceeds the permitted use, you will need to obtain permission directly from
the copyright holder. To view a copy of this licence, visit http://creativecommons.org/licenses/by/4.0/.
© The Author(s) 2021
Scientific Reports | (2021) 11:6540 | https://doi.org/10.1038/s41598-021-86122-4 12
Vol:.(1234567890)You can also read