Detecting COVID-19 Status Using Chest X-ray Images and Symptoms Analysis by Own Developed Mathematical Model: A Model Development and Analysis ...
←
→
Page content transcription
If your browser does not render page correctly, please read the page content below
Article
Detecting COVID-19 Status Using Chest X-ray Images and
Symptoms Analysis by Own Developed Mathematical Model:
A Model Development and Analysis Approach
Mohammad Helal Uddin † , Mohammad Nahid Hossain *,† , Md Shafiqul Islam, Md Abdullah Al Zubaer
and Sung-Hyun Yang *

                                          Electronic Engineering Department, Kwangwoon University, Seoul 139-701, Korea;
                                          helaluddinsimon@kw.ac.kr (M.H.U.); msislam@kw.ac.kr (M.S.I.); abdullah@kw.ac.kr (M.A.A.Z.)
                                          * Correspondence: nahid@kw.ac.kr (M.N.H.); shyang@kw.ac.kr (S.-H.Y.)
                                          † These authors contributed equally to this work.

                                          Abstract: COVID-19 is a life-threatening infectious disease that has become a pandemic. The virus
                                          grows within the lower respiratory tract, where early-stage symptoms (such as cough, fever, and sore
                                          throat) develop, and then it causes a lung infection (pneumonia). This paper proposes a new artificial
                                          testing methodology to determine whether a patient has been infected by COVID-19. We have
                                          presented a prediction model based on a convolutional neural network (CNN) and our own developed
                                          mathematical equation-based algorithm named SymptomNet. The CNN algorithm classifies lung
                                          infections (pneumonia) using frontal chest X-ray images, and the symptom analysis algorithm
                                          (SymptomNet) predicts the possibility of COVID-19 infection from the developed symptoms in
                                          a patient. By combining the CNN image classifier method and SymptomNet algorithm, we have
                                developed a model that predicts COVID-19 patients with an approximate accuracy of 96%. Ten out

                                          of the 13 symptoms were significantly correlated to the COVID-19 disease. Specially, fever, cough,
Citation: Helal Uddin, M.; Hossain,
M.N.; Islam, M.S.; Zubaer, M.A.A.;
                                          body chills, shortness of breath, muscle pain, and sore throat were shown to be significantly related
Yang, S.-H. Detecting COVID-19            (r = 0.20; p = 0.001, r = 0.20; p < 0.001, r = 0.22; p < 0.001, r = 0.16; p < 0.001, r = −0.45; p < 0.001,
Status Using Chest X-ray Images and       r = −0.35; p < 0.001, respectively). In this model, the CNN classifier has an accuracy of approximately
Symptoms Analysis by Own                  96% (training loss = 0.1311, training accuracy = 0.9596, validation loss: 0.2754, and validation accuracy
Developed Mathematical Model: A           of 0.9273, F1-score: 94.16, precision: 91.33), and the SymptomNet algorithm has an accuracy of 97%
Model Development and Analysis            (485 successful predictions out of 500 samples). This research work obtained promising accuracy
Approach. COVID 2022, 2, 117–137.         while predicting COVID-19-infected patients. The proposed model can be ubiquitously used at a low
https://doi.org/10.3390/covid2020009
                                          cost and achieve high accuracy.
Academic Editor: Simone Brogi
                                          Keywords: COVID-19; machine learning; convolutional neural network; lung infection (pneumonia);
Received: 16 November 2021
                                          frontal chest X-ray; symptom analysis
Accepted: 12 January 2022
Published: 19 January 2022

Publisher’s Note: MDPI stays neutral
with regard to jurisdictional claims in   1. Introduction
published maps and institutional affil-
                                               The new coronavirus carried by bats called COVID-19 has become a pandemic and
iations.
                                          has created a dreadful situation worldwide. The virus became dangerous at the end of
                                          November 2019 when it underwent a mutation, evolving into the viral strain that we now call
                                          SARS-CoV-2 [1]. According to the WHO, there is no alternative to detect this disease other
Copyright: © 2022 by the authors.
                                          than testing [2]. We have developed a solution that combines deep learning and our own
Licensee MDPI, Basel, Switzerland.        proprietary mathematical equation-based algorithm named SymptomNet. This method might
This article is an open access article    help to accelerate the mission of predicting and identifying possible COVID-19 patients. This
distributed under the terms and           study proposed a model to predict COVID-19 patients in the early stages by applying a deep
conditions of the Creative Commons        learning-based Convolutional Neural Network (CNN) algorithm to frontal chest X-ray images,
Attribution (CC BY) license (https://     which is coupled with our own proprietary symptom analysis algorithm (SymptomNet).
creativecommons.org/licenses/by/          According to a study from the UK’s King’s College London, there could be six distinct types
4.0/).                                    of COVID-19, and each type could be distinguished by its own cluster of symptoms [3].

COVID 2022, 2, 117–137. https://doi.org/10.3390/covid2020009                                                 https://www.mdpi.com/journal/covid
COVID 2022, 2                                                                                               118

                Therefore, we designed our algorithm in such a way that if the virus mutates, our algorithm
                will still be able to predict COVID-19 patients with 97% accuracy.
                      Some practical analyses, reports, and articles [4–6] on COVID-19 are available. The
                characteristics [7] of COVID-19 have been analyzed for different types of patients [8]. Some
                phone-based surveys [9] of populations when cities and towns were under quarantine were
                conducted, and the results have been analyzed using an artificial intelligence (AI) framework.
                Reports on the sensitivity of chest [10] COVID-19 pathological findings [6] associated with
                acute respiratory distress syndrome have been published. Comparatively, the reproductive
                rate of COVID-19 being higher than that of the SARS coronavirus [11] has been discussed.
                Some mobile applications, such as “WASHKARO” [12] have been developed to raise public
                awareness of the initial safety instructions [13] of the “World Health Organization (WHO)” to
                fight the novel coronavirus disease COVID-19 in the initial stages.
                      One of the most important parts of this study was the detection of an infected lung
                (pneumonia by COVID-19) since this is a vital symptom of COVID-19. Pneumonia or
                pneumonitis is a fiery condition that principally influences the lungs. To evaluate the seri-
                ousness of COVID-19 pneumonia, chest CTs of the lungs were used. Basically, this method
                determines COVID-19 pneumonia from the initial diagnosis associated with the change
                in chest CT findings until the patient recovers [14]. A survey provided a reliable estimate
                of approximately 1 million people being hospitalized in the United States [15] because of
                pneumonia-related conditions per year. A team was formed in the USA to identify and clas-
                sify pneumonia cases. Features from images are extracted utilizing diverse neural network
                models pre-trained using ImageNet, which are then fed into a classifier for prediction. This
                method achieved a precision of 96.4% and a recall of 99.62% [16]. The k-nearest neighbors,
                linear discriminant analysis, linear regression, and support vector machine (SVM) learning
                models were used to detect pneumonia quickly with 99.41% accuracy [17].“CheXnet” with
                a “121-layer convolutional neural network” trained on ChestX-ray14, which claims to
                be the largest publicly accessible chest X-ray dataset, containing more than 100K frontal
                view X-ray images of 14 diseases, can recognize pneumonia from chest X-rays at a level
                surpassing experienced radiologists with 85% accuracy [18]. Furthermore, DCNNs [19–21]
                use constructive work combined with frontal chest X-rays to determine whether a lung
                is infected (pneumonia) or not and perform symptom analysis, achieving 96% accuracy
                on a large-scale radiology database [22]. Symptom analysis is the first requirement to
                diagnose flu or other diseases. Natural language processing (NLP) is used for symptom
                analysis of patients [23]. A study that analyzes the clinical characteristics and identifies
                the predictors of disease severity and mortality based on the recent “Coronavirus Disease
                2019 (COVID-19)” outbreak started in Wuhan, China has been conducted in the symptom
                analysis field. They summarize the clinical features of the confirmed COVID-19 patients
                and further identify the risk factors for disease severity and death [24].
                      This study combines two steps to identify COVID-19. The first step involves develop-
                ing a CNN-based classifier to identify normal or infected lungs (pneumonia) from frontal
                chest X-ray images, and the second step analyzes the symptoms of COVID-19 using our
                own proprietary algorithm, SymptomNet, to predict infections. Our proposed method
                highlights the following contributions:
                (1)   We have proposed a composition of chest X-ray and symptoms data to detect COVID-19 status.
                (2)   A formulaic solution has been proposed in this regard.
                (3)   We have proposed the SymptomNet algorithm.
                     The system has been cross-validated with real-time survey data collected from news-
                papers, social media posts, TV interviews, relatives of patients, mobile surveys, etc. This
                would be a naive method to test people all around the world to alleviate coronavirus
                transmission with our system, which has an attractive accuracy rate of approximately 96%.

                2. Materials and Methods
                     A deep learning-based convolutional neural network (CNN) has been used, and
                the CNN consists of 7 layers: one input layer; 5 hidden layers, which are the ConV 2D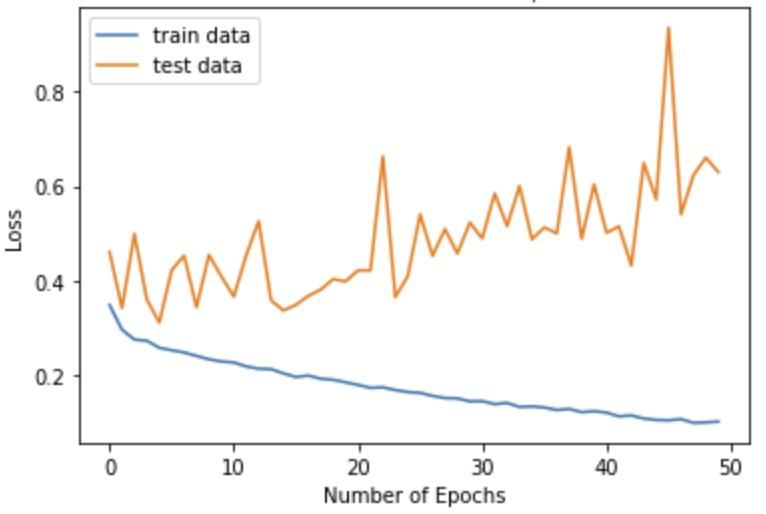
transmission with our system, which has an attractive accuracy rate of approximately
96%.
COVID 2022, 2 2. Materials and Methods 119
A deep learning-based convolutional neural network (CNN) has been used, and the
CNN consists of 7 layers: one input layer; 5 hidden layers, which are the ConV 2D (3 × 3,
(3 × ConV
16), 3, 16), 2D ConV(3 ×2D 32),×ConV
3, (3 3, 32),2DConV (3 ×2D (3 ×ConV
3, 64), 3, 64),2D ConV
(3 × 2D (3 ×and
3, 128), 3, 128),
ConV and 2DConV
(3 × 3,2D
(3 × 3,
256) 256) layers,
layers, where where
3 × 3 is3the× 3kernel
is the size,
kernel 16,size, 16, 128,
32, 64, 32, 64,
and 128,256andare256
the are the respective
respective filter
filter
sizes sizes
and 2×2 andis2the×2 is the pooling
pooling size with sizethe with
ReLU the activation
ReLU activationfunction, function,
and oneand FC one
(FullyFC
(Fully Connected)
Connected) layer. layer. The frontal
The frontal chest images
chest X-ray X-ray images
are used areasusedthe as the images.
input input images.
They passThey
pass through
through filters,
filters, the the
ReLU ReLU activation
activation function,
function, andand thethe sigmoid
sigmoid activationfunction
activation functiontoto
increase
increase the nonlinearity. After this pooling layer is applied to each
After this pooling layer is applied to each feature map and feature map andthe the
pooled
pooled images
imagesare areflattened
flattenedinto intooneonelonglongvector,
vector, then
then this vector
this vector willwill
be the input
be the of aof
input fully
a
connected
fully connected artificial neuralneural
artificial network. Through
network. these these
Through preprocessing
preprocessing steps, steps,
the system will be
the system
trained
will be by forward-
trained and backpropagation
by forward- and backpropagationfor a largefor number
a large of epochs.
number After severalAfter
of epochs. steps,
the system
several canthe
steps, identify
system normal or infected
can identify lungsorfrom
normal X-raylungs
infected images from(pneumonia).
X-ray images The
“Adam optimizer”
(pneumonia). The algorithm
“Adam optimizer”has been used to update
algorithm the weight
has been used parameters
to update the to optimize
weight
the loss function.
parameters to optimizeThe thefollowing is a summary
loss function. The following of theismain model;ofthe
a summary thedetails will be
main model;
described in the methodology.
the details will be described in the methodology.
In
In the
the symptom
symptom analysis step, step, thethe SymptomNet
SymptomNet algorithm algorithmwith withtwo twomathematical
mathematical
linear
linear equations
equations is developed to analyze analyze the thesymptoms.
symptoms.The Thefirst
firstequation
equationhelps helpstotopredict
predict
the
the status
status of ofthe
theCOVID-19
COVID-19patient patient based
based on on
the the symptoms
symptoms that that
they they
have have developed.
developed. The
The
other other equation
equation is derived
is derived to set
to set thethe threshold
threshold point
point forforthethefirst
firstequation.
equation.Then,Then,the the
algorithm
algorithm predicts
predicts whether
whetheraapatientpatienthas hasCOVID-19
COVID-19or ornot.
not.TheThedetails
detailswillwillbebedescribed
describedin
the methodology
in the methodology section.
section.
After
After obtaining the results fromfrom thetheCNNCNNalgorithm
algorithmand andSymptomNet
SymptomNetalgorithm,algorithm,this this
study will
study will predict whether a person has COVID-19. The final symptom
person has COVID-19. The final symptom analysis test was analysis test was
performed
performed on a dataset of 500 500 COVID-19-positive
COVID-19-positivepatients, patients,whichwhichwas wascollected
collectedmanually
manually
in
in Bangladesh.
Bangladesh. Among Among these these500500patients,
patients,we wealsoalsocollected
collected1010patients’
patients’frontal
frontalchest
chestX-ray
X-
images
ray images to test our our
to test finalfinal
model.model.
To
To conduct
conduct the the image processing,
processing, we we used
used thethe Keras
Kerasdeep deeplearning
learningframework
frameworkwith with
the
the TensorFlow backend [25]. We ran all the experiments on a laboratory standard with
TensorFlow backend [25]. We ran all the experiments on a laboratory standard PC PC
an Nvidia
with an NvidiaGeForce GTX GTX
GeForce 1080 1080
GPU GPU card card
with with8 GB8GDDR5X
GB GDDR5X memory.memory.
2.1.
2.1. Proposed
Proposed CNN Model
CNN Model
The
The CNN
CNN model combines an
model combines an input
input layer
layer and
andan
anoutput
outputlayer
layerwith
withhidden
hiddenlayers
layers
between them. The hidden layers normally comprise convolutional layers,
between them. The hidden layers normally comprise convolutional layers, ReLU layers,ReLU lay-
ers, pooling layers, and fully connected layers. A classic CNN architecture
pooling layers, and fully connected layers. A classic CNN architecture would look would look
something
something like
like the
the following Figure 1.
following Figure 1.
Figure 1.
Figure 1. A
A classic
classic CNN
CNN architecture.
architecture.
Figure 22 shows
Figure shows the
the implemented
implemented CNNCNNmodel
modelarchitecture,
architecture,which
whichcombines
combinestwo twomain
main
parts: the feature extractors and the classifier (sigmoid activation function). In thefeature
parts: the feature extractors and the classifier (sigmoid activation function). In the feature
extraction layers,
extraction layers, the
the input
input that
that has
hasbeen
beentaken
takenisisits
itsimmediately
immediatelypreceding
precedinglayer’s
layer’soutput,
output,
and the output of the layer is passed to the succeeding layers as the input. The CNN
architecture in Figure 2 is combined with the convolution, max pooling, and classification
layers. We have used five convolutions and a fully connected layer between the input layer
and output layer. The feature extractors include a conv2D with a 3 × 3 kernel size and
16 filters, a conv2D with a 3 × 3 kernel size and 32 filters, a conv2D with a 3 × 3 kernel size
and 64 filters, a conv2D with a 3 × 3 kernel size and 128 filters, and a conv2D with a 3 × 3
kernel size and 256 filters 256; and there are ReLU activators between them.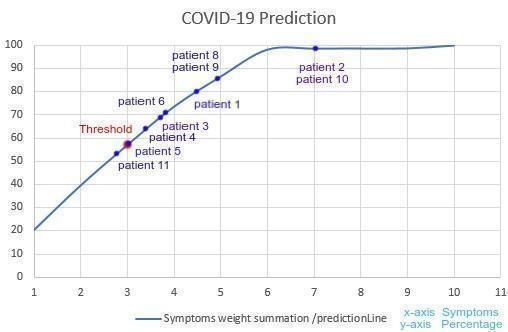
and the output of the layer is passed to the succeeding layers as the input. The CNN
and the output of the layer is passed to the succeeding layers as the input. The CNN
architecture in Figure 2 is combined with the convolution, max pooling, and classification
architecture in Figure 2 is combined with the convolution, max pooling, and classification
layers. We have used five convolutions and a fully connected layer between the input
layers. We have used five convolutions and a fully connected layer between the input
layer and output layer. The feature extractors include a conv2D with a 3 × 3 kernel size
layer and output layer. The feature extractors include a conv2D with a 3 × 3 kernel size
and 16 filters, a conv2D with a 3 × 3 kernel size and 32 filters, a conv2D with a 3 × 3 kernel
COVID 2022, 2 and 16 filters, a conv2D with a 3 × 3 kernel size and 32 filters, a conv2D with a 3 × 3 kernel
size and 64 filters, a conv2D with a 3 × 3 kernel size and 128 filters, and a conv2D with a 3120
size and 64 filters, a conv2D with a 3 × 3 kernel size and 128 filters, and a conv2D with a 3
× 3 kernel size and 256 filters 256; and there are ReLU activators between them.
× 3 kernel size and 256 filters 256; and there are ReLU activators between them.
Figure 2. The proposed architecture of CNN.
Figure 2. The proposed architecture of CNN.
Figure 2. The proposed architecture of CNN.
2.2. Symptom Analysis Using the Proposed SymptomNet Algorithm
2.2.
2.2. Symptom
Based onAnalysis
Symptom Analysis Using
Using the
53,000 patient the Proposed
Proposed
data samples SymptomNet
SymptomNet Algorithm
Algorithmhave been found that are
[24], 12 symptoms
mainlyBased on 53,000
responsible patient
for data
COVID-19 samples [24],
identification.12
Based on 53,000 patient data samples [24], 12 symptoms symptoms
Fever, have
cough, been
been found
fatigue,
have that
shortness
found are
thatof
are
mainly
breath, responsible
and muscle for
painCOVID-19
are the topidentification.
five symptomsFever,
of cough, fatigue,
COVID-19. Chill,shortness
dizziness,
mainly responsible for COVID-19 identification. Fever, cough, fatigue, shortness of breath, of
breath,
headache,andsoremuscle
throat,pain are
nausea orthe top
vomiting, five symptoms
diarrhea, and of
nasalCOVID-19.
congestion
and muscle pain are the top five symptoms of COVID-19. Chill, dizziness, headache, Chill,
can dizziness,
also when
headache,
a person
sore issore
throat, throat,
infected
nausea orbynausea or diarrhea,
COVID-19.
vomiting, vomiting,
Figure diarrhea,
and3 nasal andan
provides nasal congestion
overview
congestion can
of when
can also the aalso
COVID-19when
person is
symptoms.
ainfected
personby is COVID-19.
infected byFigure
COVID-19. Figure
3 provides 3 provides
an overview an overview
of the COVID-19of the COVID-19
symptoms.
symptoms.
Figure People with
3. People
Figure 3. with severe
severeand
andnon-severe
non-severeCOVID-19.
COVID-19.
Figure 3. People
The with
analysis of severe and
the data non-severe
sample showsCOVID-19.
that among the severe COVID-19 patients, 88.4%
The analysis of the data sample shows that among the severe COVID-19 patients,
experience a fever,a71.1%
88.4% experience fever,experience coughing,
71.1% experience 60.3% experience
coughing, fatigue, 44.2%
60.3% experience experience
fatigue, 44.2%
The analysis
shortness of of26%
breath, the experience
data samplemuscle
showspain,
that 26%
among the severe
experience COVID-19
chills, 16.1% patients,
experience
experience shortness of breath, 26% experience muscle pain, 26% experience chills, 16.1%
88.4% experience experience
dizziness, a fever, 71.1% experience
7.8%coughing, 60.3% experience fatigue, 44.2%
experience 11.3% headaches,
dizziness, 11.3% experience experience
headaches, a sore
7.8% experiencethroat,
a sore5.9% experience
throat, 5.9%
experience shortness5.7%
nausea or vomiting, of breath, 26% experience
experience muscle
diarrhea, and 2.8%pain, 26% experience
experience chills, 16.1%
nasal congestion [24].
experience dizziness,
To predict COVID-19 11.3% experience
based headaches,
on symptoms, we have 7.8% experience
developed a sorewith
an algorithm throat, 5.9%
two math-
ematical linear equations. We have named our algorithm “SymptomNet”. The equations are
based on the symptom weights. Since all symptoms do not have the same impact on COVID-19,
we assigned weights to each individual symptom. Regarding the weights of the individual
symptoms, we considered the impact percentage of individual symptoms on COVID-19 based
on the collected dataset. Table 1 presents the weights of the symptoms.COVID 2022, 2 121
Table 1. Symptom weight table.
Clinical Symptoms Symptom Weights (%)
Fever 88.4
Cough 71.1
Fatigue 60.3
Shortness of breath 44.2
Muscle pain 26
Chill 26
Dizziness 16.1
Headache 11.3
Sore throat 7.8
Nausea or vomiting 5.9
Diarrhea 5.7
Nasal congestion 2.8
This is the default symptom weight table for the SymptomNet algorithm. However,
this symptom weight table can be changed. If someone wants to impose a new symptom
weight table instead of the default table, the SymptomNet algorithm can accommodate this.
Considering the weights of symptoms, we have derived the prediction equations as follows:
∑ (w1 x1 + w2 x2 + · · · . . . . + wn xn ) × 100
COV ID − 190 prediction, C pr = (1)
Σ(w1 + w2 + · · · . . . .. + wn )
Here, w is denoted as the weight of the symptom, x is denoted as the symptom.
Based on the data sample, we considered 12 symptoms for the equation, but the
equation is derived for n_th number of symptoms so that it can fit an increased/decreased
number of symptoms. For Equation (1), we have considered symptom (x) as being binary,
either 1 or 0. When the symptom is positive, it is 1; and when the symptom is negative, it
is 0. In Equation (2), the threshold point is represented. After that point, for Equation (1), we
are able to conclude that a patient is possibly COVID-19 positive. To calculate the threshold,
we considered the weights of the top three symptoms of COVID-19 from the symptom
weight table, which means that symptom weight Table 1 will be sorted in descending order
(large to small). Equation (2) is derived to determine the threshold point for Equation (1).
∑3n=1 LARGE(w1 x1 + w2 x2 + . . . . . . . + wn xn +) × 100
Threshold, Tr = (2)
Σ(w1 + w2 + . . . . . . .. + wn )
Tr is denoted as the threshold.
Figure 4 shows the working process of the SymptomNet algorithm.
This system is designed in such a way that the “symptom weight table” needs to be
integrated with the system once, and then it will be updated automatically as it is input.
The input parameters for the algorithm are patients’ symptoms. After taking the input,
Equation (1) will calculate the predicted value (Cpr ) using the input and symptom weights.
In addition, the threshold (Tr ) value will be calculated from the “symptom weight table”.
If the predicted value equals or exceeds the threshold value, then the system will predict
a COVID-19 infection; otherwise, it will predict that the person is not infected.COVID 2022, 2, FOR PEER REVIEW 6
If the predicted value equals or exceeds the threshold value, then the system will predict
COVID 2022, 2 a COVID-19 infection; otherwise, it will predict that the person is not infected. 122
The symptom pattern of COVID-19 can be changed. As a result, the weight of the
symptoms of COVID-19 might vary from the default symptom weight table in Table 1.
Figure 4. Flowchart of the symptom analysis algorithm (SymptomNet).
Figure 4. Flowchart of the symptom analysis algorithm (SymptomNet).
2.3.The
Combining
symptom thepattern
CNN and of SymptomNet
COVID-19 can Algorithms
be changed. As a result, the weight of the
symptomsIn this part, we have combined our CNN symptom
of COVID-19 might vary from the default weight table
image classifier and intheTable 1.
SymptomNet
algorithm. In the previous two parts, we have individually described the CNN image
2.3. Combining the CNN and SymptomNet Algorithms
classifier and the SymptomsNet algorithm in detail. Figure 5 displays the architecture of
the In
fullthis part,ofwe
model ourhave
work. combined our CNN image classifier and the SymptomNet
algorithm. In the previous two parts, we have individually described the CNN image
If both the CNN image classifier and the SymptomsNet algorithm indicate positive
classifier and the SymptomsNet algorithm in detail. Figure 5 displays the architecture of
results for a patient, then we can conclude that there is a high possibility that the patient
the full model of our work.
is infected by COVID-19 (Table 2).
If both the CNN image classifier and the SymptomsNet algorithm indicate positive
If the CNN classifier
results for a patient, then we canindicates that
conclude patients
that there ishave a possibility
a high lung infection, butpatient
that the the equation
is
result is
infected byunder the threshold,
COVID-19 (Table 2). then we can conclude that there is a moderate possibility
thatIfthe
the patient is infected
CNN classifier by COVID-19.
indicates Furthermore,
that patients have a lungifinfection,
the CNNbut classifier indicates a
the equation
result is under the threshold, then we can conclude that there is a moderate possibility that then
negative result for the lung infection, but the equation result is over the threshold,
wepatient
the can conclude that
is infected by there is a low
COVID-19. possibilityifthat
Furthermore, the the
CNN patient is infected
classifier indicatesby COVID-19.
a negative
result for the lung infection, but the equation result is over the threshold, then we can
conclude that there is a low possibility that the patient is infected by COVID-19.COVID 2022,22, FOR PEER REVIEW
COVID2022, 123 7
Figure 5. Research flowchart of the full proposed model.
Figure 5. Research flowchart of the full proposed model.
Table
Table 2. Conditions
2. Conditions for for possible
possible COVID-19
COVID-19 status.
status.
CNN Classifier
CNN Classifier
SymptomNet Algorithm COVID-19
SymptomNet Algorithm
COVID-19
Prediction
Prediction
Pneumonia ≥Threshold High Possibility
Pneumonia ≥Threshold High Possibility
Pneumonia
Pneumonia 70 High Possibility
High Possibility
NormalCOVID 2022, 2 124
training, and validation sets. We defined two data generators, one for the training data and
one for the validation data. A data generator is capable of loading the required amount of
data (a minibatch of images) directly from the source folder, converting them into training
data (fed to the model) and training targets (a vector of attributes—the supervision signal).
Our training data are augmented via a number of random transformations in order to
prevent duplicate images, that is, the model will never see the exact same picture twice.
This has been done to prevent overfitting and improve the generalization of the model. The
following table represents the settings of the deployed image augmentation (Table 3).
Table 3. Settings for Chest X-ray Image Augmentation.
Method Setting
Rotation range 40
Width shift 0.2
Rescale 1.0/255
Height shift 0.2
Zoom range 0.3
Horizontal flip True
The rotation range represents the range of the random rotations of the images during
training, i.e., 40 degrees. The width shift represents the horizontal image translation by
0.2%, and the height shift represents the vertical image translation by 0.2%. The ratio of
the zoom range randomly zooming in on images is 0.2%. Last, the images were flipped
horizontally. We have done this using “keras.preprocessing.image.ImageDataGenerator” class.
This class allows for configuring random transformations and normalization operations on
image data during training. In addition, instantiate generators of augmented image batches
via.flow (data, labels) or.flow_from_directory (directory). Detailed documentation about
this class has been provided in the Keras documentation [27]. We have used the fit_generator,
evaluate_generator, and predict_generator generators with the Keras model that accepts
the data generators as inputs. Our generators are able to load the required amount of data
directly from the source directory. Regarding the three subsets of our data set (test, training,
validation), the training directory consists of 5218 chest X-ray images, the test directory
consists of 526 images, and the validation directory consists of 18 images.
For symptom analysis, we collected data on the symptoms from detailed research work
on COVID-19 patients that was published in March 2020 [24]. This research [24] was based
on a population infected with COVID-19 in Wuhan, China. The data sample was 53,000 pa-
tients who were infected by COVID-19. We also collected a sample of the symptom data
of 500 Bangladeshi patients who tested positive for COVID-19. These data were collected
manually from Bangladeshi top newspapers, by contacting patients over the phone, and
from patients interviewed via social media. For example, patient 1’s data (she was admitted
to the Kuwait Bangladesh Friendship Government Hospital for more than 1 week) were
collected over the phone by talking with the patient, and patient 3’s data were collected from
a Bangladeshi top newspaper [28]. Out of these 500 patients, there were 4 patients who did
not have any COVID-19 symptoms. Table 4 shows five patient data points as an overview.
2.4.2. Applied Proposed CNN Model
The CNN algorithm resulted in an optimal solution by classifying abnormal (pneumo-
nia labeled) and normal frontal chest X-ray images. Figure 6 provides an overview of the
training, validation, and testing of the chest X-ray images.Table 4. Infected patient symptom dataset from Bangladeshi people.
Patients Symptoms COVID-19 Status State, Country Gender
Fever, shortness of breath, cough, sore throat, muscle
Patient 1 pain, and hyposmia (having difficulties smelling food Positive Dhaka, Bangladesh Female
COVID 2022, 2 and other things) 125
Fever, sore throat, shortness of breath, body chills,
Patient 2 Positive Dhaka, Bangladesh Female
cough, muscle pain, and cannot eat food
Table 4. Infected patient symptom dataset from Bangladeshi people.
New York, NY, USA
Fever, shortness of breath, cough, muscle pain, and
Patient 3 Positive (Bangladeshi Male
Patients kidney problems
Symptoms COVID-19 Status State, Country Gender
Immigrant)
Fever, shortness of breath, cough, sore throat, New York, NY, USA
Patient 1 muscle pain, and hyposmia (having difficulties Positive Dhaka, Bangladesh Female
Patient 4 Fever, cough,
smelling sore
food andthroat, and muscle pain
other things) Positive (Bangladeshi Male
Immigrant)
Fever, sore throat, shortness of breath, body chills,
Patient 2 Positive Dhaka, Bangladesh
Gaibandha, Female
Patient 5 cough,pain,
Muscle muscle pain, (tiredness),
fatigue and cannot eat food and cough
fever, Positive Male
Bangladesh
Fever, shortness of breath, cough, muscle pain, New York, NY, USA
Patient 3 Positive Male
and kidney problems (Bangladeshi Immigrant)
2.4.2. Applied Proposed CNN Model
New York, NY, USA
Patient 4 Fever, cough, sore The
throat,CNN
and muscle pain resulted Positive
algorithm in an optimal(Bangladeshi
solution by Male
classifying abnormal
Immigrant)
Patient 5
(pneumonia labeled) and normal frontal
Muscle pain, fatigue (tiredness), fever, and cough Positive
chest X-ray images. Figure 6 provides
Gaibandha, Bangladesh Male
an
overview of the training, validation, and testing of the chest X-ray images.
Figure 6.
Figure 6. An overview
overview of
of the
the training,
training, validation,
validation, and
and testing
testing of
of frontal
frontal chest
chest X-ray
X-rayimages.
images.
We
We conducted
conductedthe theexperiment
experimentbybyfollowing
following thethe
CNNCNN model
model architecture
architecture thatthat
is de-
is
scribed in the methodology section (Figure 2). The classifier of the
described in the methodology section (Figure 2). The classifier of the model is placed at model is placed at
the
the end
end ofof the
the proposed
proposed convolutional
convolutional neural
neural network
network (CNN)
(CNN) model.
model. It It is
is essentially
essentially anan
artificial neural network (ANN) regularly called a dense layer. To perform
artificial neural network (ANN) regularly called a dense layer. To perform computations, computations,
like
like any
any other
other classifier,
classifier, this
this classifier
classifier requires
requires individual
individual features
features (vectors).
(vectors). Therefore,
Therefore, forfor
the classifiers, the feature extractor (CNN part) output is converted into
the classifiers, the feature extractor (CNN part) output is converted into a 1D feature a 1D feature vector.
This procedure
vector. is known
This procedure is as flattening.
known In flattening,
as flattening. the output
In flattening, theof the convolution
output activity
of the convolution
is flattened to create one long feature vector for the dense layer to use in
activity is flattened to create one long feature vector for the dense layer to use in its lastits last classifica-
tion process. The classification layer contains three dense layers of size 512, 128, and 64,
respectively, three dropout rates of 0.7, 0.5, and 0.3, a ReLU (rectified linear unit) between
the three dense layers, and a sigmoid activation function that performs the classification
tasks and a flattened layer. We have used the “binary_crossentropy” loss to train our model,
and we have used the “adam” optimizer. Appendix A explains some of the commonly
used optimizers.
The experiment was conducted many times to check, evaluate and validate the effec-
tiveness of the proposed procedure. The parameters and hyperparameters were deliberatelyCOVID 2022, 2 126
tuned to increase the performance of the model. This study reports only the most valid
result where we have obtained different results.
2.4.3. Applied Proposed SymptomNet Algorithm
The experiment is constructed into two parts: the 1st part is constructed with the
default “symptom weight table” (Table 1), and the 2nd part is constructed with a specific
country’s (Bangladesh) “symptom weight table”. The threshold value of the equation is
changeable because it depends on the symptoms. Since COVID-19 can mutate, it is able to
COVID 2022, 2, FOR PEER REVIEW
change its symptomatic characteristics. The following table is derived for calculating
11
the
threshold based on our default weight Table 1.
The following Figure 7 represents the default threshold point based on Table 5.
Figure 7.7.Graphical
Figure Graphicalview of the
view default
of the threshold
default point.point.
threshold
When Equation (1) crosses the threshold point, we can conclude that the patient may
Table Default threshold
have a5.COVID-19 infection.calculation table.
As the result increases after the threshold, the probability of
a possible COVID-19 infection will increase.
Individual Weight Weight Summation/Prediction Line
Clinical Symptoms
In this part, we have applied our collected Bangladeshi COVID-19-positive patient
Iw = (w × 100)/Total Weight ws = Iw + wsprevious
symptom dataset (see Table 4 in the data preprocessing section) to our derived Equations
(1) and (2). Fever
Based on this dataset, fever was 24.2 24.32 was a
a symptom 92% of the time, the cough
Cough 19.45 43.76
symptom 86% of the time, body chills were a symptom 78% of the time, shortness of breath
Fatigue
was a symptom 74% of the time, muscle pain 16.49
was a symptom 58% of the time, a60.25
sore throat
was Shortness
a symptom of52%
breath 12.1 four symptoms were symptoms
of the time, and the other 72.34
2% of the
Muscle
time. First, we pain
generated the symptom weight 7.11 table from this dataset. The79.45
symptom
Chill 7.11 86.56
weight Table 6 is shown below.
Dizziness 4.4 90.96
Headache 3.09
Table 6. Symptom weight table of Bangladeshi patients.
94.05
Sore throat 2.13 96.18
Nausea or vomiting Clinical Symptoms1.61 Symptom97.79Weights
Diarrhea Fever 1.55 9299.34
Nasal congestion Cough 0.76 86 100
body chills 78
When EquationShortness
(1) crossesof the threshold point, we can conclude74that the patient may
breath
have a COVID-19 infection.
Muscle Aspain
the result increases after the threshold,
58 the probability of
a possible COVID-19 infection will increase.
Sore throat 52
Fatigue 2
In this part, we have applied our collected Bangladeshi COVID-19-positive pa-
Hyposmia (having difficulties smelling food and other things)
tient symptom dataset (see Table 4 in the data preprocessing section) 2 to our derived
Equations (1) and (2).Cannot
Basedeatonfood
this dataset, fever was a symptom 292% of the time, the
Kidney problem
cough was a symptom 86% of the time, body chills were a symptom 2 78% of the time,
Total Weight 448
Table 7 is derived to calculate the threshold point based on the symptom weight
Table 6 of Bangladeshi patients.COVID 2022, 2 127
shortness of breath was a symptom 74% of the time, muscle pain was a symptom 58% of
the time, a sore throat was a symptom 52% of the time, and the other four symptoms were
symptoms 2% of the time. First, we generated the symptom weight table from this dataset.
The symptom weight Table 6 is shown below.
Table 6. Symptom weight table of Bangladeshi patients.
Clinical Symptoms Symptom Weights
Fever 92
Cough 86
body chills 78
Shortness of breath 74
Muscle pain 58
Sore throat 52
Fatigue 2
Hyposmia (having difficulties smelling food and other things) 2
Cannot eat food 2
Kidney problem 2
Total Weight 448
COVID 2022, 2, FOR PEER REVIEW 12
Table 7 is derived to calculate the threshold point based on the symptom weight
Table 6 of Bangladeshi patients.
Table 7. Threshold calculation table for the Bangladeshi patient symptom weight dataset.
Table 7. Threshold calculation table for
Individual the Bangladeshi
Weight patient
Weight symptom weight dataset.
Summation/Prediction Line
Clinical Symptoms
Iw = (w × 100)/Total Weight ws = Iw + wsprevious_
Individual Weight Weight Summation/Prediction Line
Fever
Clinical Symptoms 20.54 20.54
Iw = (w × 100)/Total Weight ws = Iw + wsprevious
Cough 19.19 39.74
Fever
body chills 20.54
17.41 57.15 (Threshold20.54
point)
Cough of breath
Shortness 19.19
16.52 73.66 39.74
bodyMuscle
chills pain 17.41
12.95 57.15 (Threshold point)
86.62
Shortness of breath 16.52 73.66
Sore throat 11.61 98.23
Muscle pain 12.95 86.62
Fatigue
Sore throat 0.045
11.61 98.67 98.23
Hyposmia (having
Fatiguedifficulties smelling food 0.045
0.045 98.72 98.67
and
Hyposmia (having other things)
difficulties smelling
0.045 98.72
food andCannot eat food
other things) 0.045 98.77
Cannot eat food
Kidney problem 0.045
0.045 100 98.77
Kidney problem 0.045 100
The following Figure 8 represents the threshold point for Bangladeshi patients based
on Table 7.
The following Figure 8 represents the threshold point for Bangladeshi patients based
Detailed
on Table 7. results of the experiments are shown and described in the “Results” section.
Figure 8. Threshold point for the Bangladeshi patient symptom weight dataset.
Figure 8. Threshold point for the Bangladeshi patient symptom weight dataset.
3. Results
This proposed model is a combination of CNN-based frontal chest X-ray image
classification and our own developed algorithm (SymptomNet). Our results are discussed
in three parts. In the first two parts, we have provided the results of the individualCOVID 2022, 2 128
Detailed results of the experiments are shown and described in the “Results” section.
3. Results
This proposed model is a combination of CNN-based frontal chest X-ray image classifi-
cation and our own developed algorithm (SymptomNet). Our results are discussed in three
parts. In the first two parts, we have provided the results of the individual algorithms (the
CNN model and the SymptomsNet algorithm, respectively) in detail to provide a better
understanding. In the last part, we have provided our full model results.
As clarified above, methods, such as data augmentation, varying the learning rate, and
annealing, were used to help fit the small dataset into a deep convolutional neural network
architecture. These methods were performed in order to acquire generous outcomes, as
shown in Figures 9 and 10. The final results obtained are training loss = 0.1311, training
COVID 2022, 2, FOR PEER REVIEW accuracy = 0.9596, validation loss: 0.2754, and validation accuracy of 0.9273. The overall 13
COVID 2022, 2, FOR PEER REVIEW 13
scenario has been shown in Figure 11.
Figure 9. Model Accuracy vs. Epoch.
Figure 9. Model Accuracy vs.Epoch.
Epoch.
Figure 10. Model Loss vs. Epoch.
Figure10.
Figure 10.Model
ModelLoss
Lossvs.
vs.Epoch.
Epoch.COVID 2022, 2, FOR PEER REVIEW 14
COVID 2022, 2 129
COVID 2022, 2, FOR PEER REVIEW 14
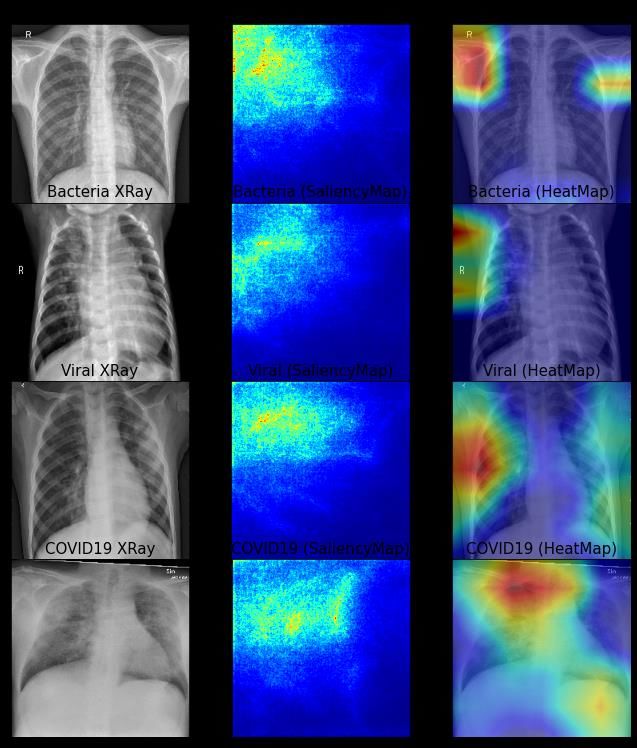
Figure 11. Visualization of general XRay vs Saliency Map Vs HeatMap. From top to bottom
Figure
Figure 11. Visualization
11.
represents Visualization- of
respectively of general
general
Normal XRay
XRay
XRay, vs Saliency
vs. Saliency
Bacteria Map Vs.
Map
XRay, Viray Vs HeatMap.
XRay, From top to bottom
FromXRay.
and COVID19 bottom
represents respectively - Normal XRay, Bacteria XRay, Viray XRay, and COVID19
represents respectively—Normal XRay, Bacteria XRay, Viray XRay, and COVID19 XRay.XRay.
Figure 12 shows the confusion matrix and related parameters used to evaluate the
Figure12
Figure
model. 12shows
showsthe
the confusion
confusion matrix
matrix andand related
related parameters
parameters used
used to to evaluate
evaluate the
the model.
model.
Figure 12. Confusion Matrix.
Figure 12. Confusion
Figure 12. Confusion Matrix.
Matrix.COVID 2022, 2 130
This model’s training accuracy is 95.9%, and it achieves a test accuracy of 92.467%,
which indicates that it is a good model. With this model, we were able to determine lung
infections (pneumonia), which is one of the major situations for COVID-19 patients.
In this part, we will show the results of our SymptomNet algorithm. We generated all
the prediction results of the 500 Bangladeshi COVID-19-positive patients using Equation (1).
Then, we compared the predicted results to the threshold point. The threshold point was
generated using Equation (2). From the experiment, we found that this method achieved
97% (485 successful predictions out of 500) prediction accuracy. In Table 8, we have
displayed the first 11 results for the 500 Bangladeshi COVID-19-positive patients.
Table 8. Bangladeshi patients’ prediction results vs. original results.
Patient Threshold Our Prediction (Cpr ) Original COVID-19 Status Prediction Accuracy
patient 1 57.15 80.055 (positive) positive Correct
patient 2 57.15 98.265 (positive) positive Correct
patient 3 57.15 69.245 (positive) positive Correct
patient 4 57.15 64.29 (positive) positive Correct
patient 5 57.15 57.725 (positive) positive Correct
patient 6 57.15 70.22 (positive) positive Correct
patient 7 57.15 86.61 (positive) positive Correct
patient 8 57.15 86.61 (positive) positive Correct
patient 9 57.15 86.61 (positive) positive Correct
patient 10 57.15 98.265 (positive) positive Correct
patient 11 57.15 54.57 (negative) positive Wrong
Figures 13 and 14 are representing the correlations and p-values respectively. The role
of “p” values and “r” values is to find out the best correlation and rank the feature to select
the best features of the datasets [29]. The analysis of the correlation between the symptoms
and COVID-19 status revealed that 10 out of 13 symptoms were significantly correlated
to the COVID-19 disease. Specially, fever, cough, body chills, shortness of breath, muscle
pain, sore throat were shown to be significantly related to the COVID-19 disease (r = 0.20;
p = 0.001, r = 0.20; p < 0.001, r = 0.22; p < 0.001, r = 0.16; p < 0.001, r = −0.45; p < 0.001,
r = −0.35; p < 0.001, respectively) from the developed symptoms in a patient. Also, the
p-value curve showed strong correlations (p < 0.05) of the symptoms. p-values of other
symptoms, such as fatigue, hyposmia, anorexia, kidney problem, dizziness, nausea, or
vomiting are 0.319, 0.014, 0.318, 0.083, 0.001,Figures 13 and 14 are representing the correlations and p-values respectively. The
role of “p” values and “r” values is to find out the best correlation and rank the feature to
select the best features of the datasets [29]. The analysis of the correlation between the
symptoms and COVID-19 status revealed that 10 out of 13 symptoms were significantly
correlated to the COVID-19 disease. Specially, fever, cough, body chills, shortness of
COVID 2022, 2 breath, muscle pain, sore throat were shown to be significantly related to the COVID-19 131
disease (r = 0.20; p = 0.001, r = 0.20; p < 0.001, r = 0.22; p < 0.001, r = 0.16; p < 0.001, r = −0.45;
p < 0.001, r = −0.35; p < 0.001, respectively) from the developed symptoms in a patient. Also,
the p-value curve showed strong correlations (p < 0.05) of the symptoms. p-values of other
described
symptoms,thesuchdetailed procedure,
as fatigue, in this
hyposmia, section,
anorexia, we have
kidney shown
problem, the final
dizziness, output
nausea, or only.
Table 9 shows
vomiting arethe results.
0.319, 0.014, 0.318, 0.083, 0.001,COVID 2022, 2
COVID 2022, 2, FOR PEER REVIEW 17
132
Figure 15. COVID-19 prediction (Cpr).
Figure 15. COVID-19 prediction (Cpr ).
According to the Canadian PHAC [30], the top symptoms of COVID-19 in Canada
Table 9. Experimental results of the developed model.
are fever, cough, difficulty breathing, and pneumonia in both lungs. According to the
UK’s NHS [31], the top symptoms of COVID-19 in the UK are cough, high temperature,
Patient’s Model
Patient CNN CNNand shortness of breath.SymptomNet
SymptomNet According to theSymptomNet Our
Australian Government Department
Original ofPrediction
Health
No. Classified as Accuracy Threshold PREDICTION Prediction Model’s COVID-19
[32], the top symptoms of COVID-19
(%) in Australia
Accuracy are fever, coughing,
Prediction shortness ofAccuracy
breath,
Status Status
sore throat, and fatigue. According to the CDC in the USA [33], they are facing similar
symptoms for COVID-19. Based High health organizations, our
98.21 on the mentioned countries’
1 pneumonia (positive) Positive Correct
possibility
equation is fully able to identify the possible COVID-19 patients according to their
symptoms. 74.1 High
2 pneumonia Positive Correct
(positive) possibility
In this last part of the Results section, we have constructed the final results of our full
model. We ran the final test 98.21 High
on 30 COVID-19-positive patients. To test and generate the
3 pneumonia (positive) Positive Correct
possibility
results, we used patients’ frontal chest X-ray images and symptoms. These data were
collected from Bangladesh. 98.21 High
Since we are using Bangladeshi patients’
4 pneumonia (positive) Positivedata, for the
Correct
possibility
“SymptomNet” algorithm, we are not using the default “symptom weight table”. We are
57.59 Low
5 normal using the “symptom
95.9% 57.15 weight table”, which 97%
(positive) was made possibility
based on Bangladeshi
Positivepatients’ data
Correct
(see Table 9 in the Results section). Since the previous two parts of this results section have
85.26 High
6 pneumonia described the detailed procedure,
(positive) in this section, wepossibility
have shown thePositive
final outputCorrect
only.
Table 9 shows the results.
7 36.6 No Positive Wrong
normal (negative) Infection
Table 9. Experimental results of the developed model.
98.21 High
8 pneumonia (positive) Positive Correct
possibility
Patient’s Model
SymptomNet
57.15 SymptomNet Our
Low
Patient
9 CNN
normal CNN SymptomNet Original
Positive Prediction
Correct
PREDICTION
(positive) Prediction possibility
Model’s
No Classified as Accuracy Threshold COVID-19 Accuracy
10 (%)
74.1 Accuracy Prediction
High
normal (positive) Status
Positive Status
Correct
possibility
98.21 High
High
11 1 pneumonia
pneumonia 83.56
(positive)
(positive) possibility
Positive
Positive Correct
Correct
possibility
74.1
33.26 High
No
12 2 pneumonia
normal Positive
Negative Correct
Correct
(positive)
(negative) possibility
Infection
98.21
96.32 High
High
13 3 pneumonia
pneumonia Positive Correct
Correct
(positive)
(positive) possibility Positive
possibility
72.31
98.21 High
High
14 4 pneumonia
pneumonia Positive Correct
Correct
(positive) possibility Positive
(positive) possibility
95.71
57.59 High
Low
15 pneumonia (positive) Positive Correct
5 normal 95.9% 57.15 97% possibility Positive Correct
(positive) possibility
93.32 High
16 pneumonia (positive) Positive Correct
possibilityCOVID 2022, 2 133
Table 9. Cont.
SymptomNet SymptomNet Our Patient’s Model
Patient CNN CNN SymptomNet PREDICTION Prediction Model’s Original Prediction
No. Classified as Accuracy Threshold (%) Accuracy Prediction COVID-19 Accuracy
Status Status
17 36.6 No Positive Wrong
normal (negative) Infection
96.27 High
18 pneumonia (positive) Positive Correct
possibility
19 59.75 Low Positive Correct
normal (positive) possibility
84.29 High
20 normal Positive Correct
(positive) possibility
91.36 High
21 pneumonia (positive) Positive Correct
possibility
22 35.36 No Negative Correct
normal (negative) Infection
66.32 Low
23 pneumonia (positive) possibility Negative Wrong
82.71 High
24 pneumonia (positive) Positive Correct
possibility
97.51 High
25 pneumonia Positive Correct
(positive) possibility
96.62 High
26 pneumonia (positive) Positive Correct
possibility
27 66.6 Low Positive Correct
normal (positive) possibility
86.37 High
28 pneumonia (positive) Positive Correct
possibility
29 58.85 Low Positive Correct
normal (positive) possibility
84.29 High
30 normal Positive Correct
(positive) possibility
4. Discussion
Figures 9 and 10 show that the obtained training loss = 0.1311, training accuracy = 0.9596,
validation loss = 0.2754, and validation accuracy of 0.9273 while classifying X-ray images
as infected (pneumonia) and normal. Our CNN algorithm achieves a training accuracy of
95.9% (Figure 12). The results indicate that our CNN model serves its purpose for image
classification. The novel part of this research article is the SymptomNet algorithm. This
algorithm is designed to predict COVID-19 patients by analyzing patients’ symptoms. The
SymptomNet algorithm achieves 97% accuracy at predicting COVID-19 infections. The
combined model (CNN image classification and SymptomNet) provided more accurate
results for COVID-19 identification. Few research articles [34–36] that have been published
recently have focused on identifying pneumonia from X-ray images, which can indicate
COVID-19 infections. Diagnosing pneumonia cannot be the sole determinant of COVID-19
identification. One research article [37] showed that 138 million children were infected with
pneumonia from 2000–2015. This indicates that, per year, on average, 9.2 million children
are infected by pneumonia. Therefore, COVID-19 symptom analysis is necessary along
with pneumonia identification. As a result, we have developed the novel SymptomNet
algorithm to provide nearly perfect results. According to our final result (Table 9), we
were able to correctly identify 27 patients out of 30 with COVID-19 infections. We will
attempt to collect more data to extend this research work. This model overall achieves
excellent performance and is capable of identifying possible COVID-19 patients. Because
of its effectiveness and short execution time at identifying possible COVID-19 patients,
we believe that this model can contribute to improving the crisis of COVID-19 situationsCOVID 2022, 2 134
worldwide. The research work was limited by the depth of the data. Future work could
further improve the determination of the threshold point. Our future work also relied on
optimized model-based neural network compression [38].
5. Conclusions
Although the model in the current study achieves high accuracy at predicting COVID-19-
infected patients, there are a few limitations to consider when interpreting the results.
The amount of data we use for this work was not enough to fully prove this model. We
used 5300 frontal chest X-ray images for training and then classifying lung infections
(COVID-19 pneumonia), but the model could be improved if the number of X-ray images
increased. The X-ray images did not come directly from COVID-19-related patients, which
is a drawback for this model. In the analysis of the symptoms, we have used the data of
500 patients who are COVID-19-positive to evaluate our algorithm and equations, and
we have achieved 97% accuracy; however, this accuracy may be increased to near 100% if
the amount of data is larger. Our main aim was to detect COVID-19 patients by our own
developed mathematical model. Furthermore, the calculation of the threshold point can be
further optimized with more research work. More data would be good enough to train our
model to get better accuracy than we have now. Another limitation of the study was that
we were not able to compare to other similar illnesses.
In summary, we have figured out a model to detect COVID-19 patients based on
chest X-ray images through CNN along with symptom analysis through a mathematical
model analysis.
Author Contributions: M.H.U.: conceptualization, methodology, software, validation, formal analy-
sis; M.N.H.: resources, data curation, data analysis, methodology, writing—original draft & review;
M.S.I.: visualization, formal analysis; M.A.A.Z.: visualization, formal analysis; S.-H.Y.: supervision.
All authors have read and agreed to the published version of the manuscript.
Funding: This research received no external funding.
Institutional Review Board Statement: This study was approved by the Institutional Review Board
of Enam Medical College Hospital, Dhaka, Bangladesh [Ref No: EMC.BD/+88-02-7743662]. All the
participants were informed about the purpose, nature, and procedure of the study, and they were
also informed that they have full rights to withdraw their data at any time.
Informed Consent Statement: After disclosing all the details, formal informed consent was obtained
from all the participants. Data privacy was preserved for all the participants.
Data Availability Statement: Partial dataset of this work is available in Kaggle which was mentioned
in the “Experiment” section. All the coding related to this work was mentioned in the “Experiment”
section. All the coding related to this work is currently Smart H&B Technology Lab’s property, so it
is currently not possible to make coding materials public; however, in the future, we might upload
them to GitHub.
Acknowledgments: The present research has been conducted by the excellent researcher support
project of Kwangwoon University in 2021. The authors are grateful for the technical support and
discussion of the Smart H&B Technology Laboratory group members of Kwangwoon University,
and medical student Shafayet Hossain for his support during the data collection and give thanks to
Chief Medical Officer (CMO) Ratish Ranjan Roy of Enam Medical College Hospital, Savar, Dhaka,
Bangladesh for his support during the study.
Conflicts of Interest: The authors declare that they have no known competing financial interests or
personal relationships that could have appeared to influence the work reported in this paper.COVID 2022, 2 135
Appendix A
Table A1 shows different kinds of optimization algorithms and their working process.
Table A1. Different kinds of optimization algorithms and their working process.
Optimizer Algorithm Optimization Process
These algorithms minimize or maximize a loss function E(x) by using its gradient values.
Gradient descent is the most widely used first-order optimization algorithm. From the
First-Order Optimization
first-order derivative, it can determine whether the function is increasing or decreasing at
a particular point. It gives us a tangential line to a point on its error surface.
The second-order derivative, also known as the Hessian, minimizes or maximizes the Loss
function. It uses the second-order partial derivatives matrix. The second order is not used
much because it is costly to compute. The second-order derivative represents the
Second-Order Optimization
function’s curvature by determining whether the first derivative is increasing or
decreasing. The second-order derivative provides a quadratic surface. This quadratic
surface touches the curvature of the error surface.
Stochastic gradient descent conducts parameter updating for each training example. This
technique is usually faster. Stochastic gradient descent performs by updating the
parameters one
at a time.
Stochastic gradient descent
θ = θ − η · ∇θ J θ; x (i) ; y(i) ,
n o
where x (i) ; y(i) are the training examples.
Approach of the AdaGrad optimizer is to use a different learning rate for each and every
parameter θ at a time step based on the previous gradients that were calculated for that
Adagrad Optimizer parameter. “It modifies the approach of general learning rate η at each time step t for
every parameter θ based on the previous gradients that i have been computed for θ i ” [39].
η
θt+1,i = θt,i − √ . gt,i .
Gt,ii+e
AdaDelta tends to eliminate the decaying learning rate problem of AdaGrad. Basically, it
is an extension of AdaGrad. “Adadelta limits the window of accumulated past gradients
to some fixed size w, Instead
of accumulating all previous squared gradients” [39].
E g2 t = γ.E g2 t−1 + (1 − γ).g2 t ,
AdaDelta
set γ to a similar value as the momentum term, around 0.9.
∆θt = −η · gt,i .
θt+1 = θt + ∆θt .
∆θt = − q 2 gt ⇒∆θt = − RMS[ g ] gt
η η
E[ g ]t +e t
Adaptive Moment Estimation (Adam) is another technique that computes adaptive
learning rates for each parameter. Like AdaDelta technique, in addition to storing the
exponentially decay normal of previous squared Gradients, Adam likewise keeps
an exponentially decaying normal of previous gradients Mt .
mt
m̂t = 1− βt
······
Adam 1
vˆt = 1−vtβt
2
These are the formulas for the first moment (mean) and the second moment (the variance)
of the gradients.
The final formula for the parameter update is—
η
θt+1 = θt − √vˆ +e + m̂t
t
References
1. Bazell, R. How Genetic Mutations Turned the Coronavirus Deadly. Available online: http://nautil.us/issue/83/intelligence/how-
genetic-mutations-turned-thecoronavirus-deadly?fbclid=IwAR3oUg2cDDqCGz4SmZVduxtCxUaPeBejnyUPkJtg34wrQTFec$-
$OBzBz2$\times$4 (accessed on 28 April 2020).
2. World Health Organization (WHO). WHO Director-General’s Opening Remarks at the Media Briefing on COVID-19. Available
online: https://www.who.int/dg/speeches/detail/who-director-general-s-opening-remarks-at-the-media-briefing-on-COVID-
19---16-march-2020 (accessed on 16 March 2020).
3. Sudre, C.H.; Lee, K.; Ni Lochlainn, M.; Varsavsky, T.; Murray, B.; Graham, M.S.; Menni, C.; Modat, M.; Bowyer, R.C.E.;
Nguyen, L.H.; et al. Symptom clusters in Covid19: A potential clinical prediction tool from the COVID Symptom study app.
medRxiv 2020. [CrossRef]You can also read


