Designing the Energy Transition Process: Should you Retrofit or Upgrade Existing Transmission & Distribution Infrastructure? - Sarah Fairhurst 28 ...
←
→
Page content transcription
If your browser does not render page correctly, please read the page content below

Designing the Energy Transition Process: Should you Retrofit or Upgrade Existing
Transmission & Distribution Infrastructure?
Sarah Fairhurst
28 November 2018
Who are we?

    Power and Gas, Markets & Regulation                                                              Washington DC
                                                                       London
        Competition, Markets, Regulation, Policy
                                                               Paris

        Decisions Support Analysis            Disputes
                                                                                                               Languages:
                                                                                                               Arabic*
        Market Analysis            Asset Valuation
                                                                                                               Cantonese
                                                                                                               Mandarin
            Strategy and Advanced Analytics                                                                    English
                                                                                                               Bahasa Indonesia
    Offerings:                                                                                                 Bahasa Malaysia
                                                                                                               Bengali
    •    Deep analysis for strategy and valuation
                                                                                                               French
    •    Experts in economic regulation                                                                        German
                                                                                                               Hindi
    •    Market design and evaluation                                                                          Japanese

    •    Insightful analysis of the entire fuel-to-power
                                                                                                               Khmer
                                                                                                               Korean
         value chain
                                                                                                               Polish
                                                                                             Staff
    •    Unrivalled local expertise and knowledge                                                              Swedish
                                                                                   Senior Advisors             Tagalog*
    •    Global experience and perspective                                        Network partners             Thai*
                                                                                                               Vietnamese*

                                                                                                               *External Advisors
                                           The analysis of power meets the power of analysis

1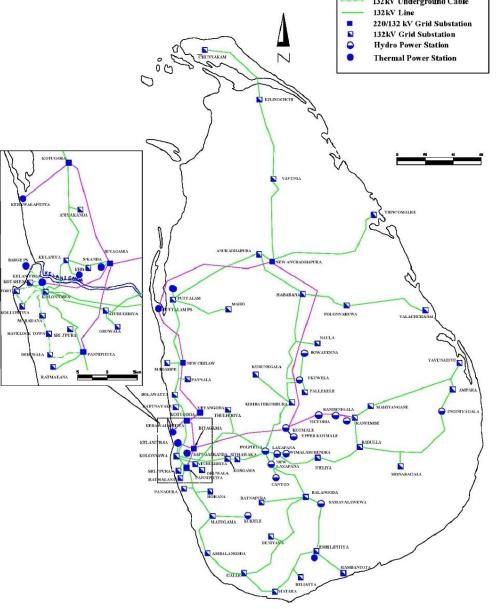
Agenda

What is the role of the grid?

Grid expansion: views from China and Australia

Peek at the Sri Lankan energy transition – are there any lessons to apply?

2

What is the role of the grid?

3
Before thinking about retrofitting or upgrading, let’s look at the role of the grid

The grid is a:

• Highway to move energy from the place it is generated to the place it is consumed (energy flow)

• Way to share reserves across the system (back-up)

• Infrastructure that allows markets to develop (pre-requisite for trading) so that power can move
  from cheaper areas to more expensive areas (the value of trading)

• Way to keep the voltage and frequency stable so that electrical appliances are safe to use
  (ancillary services)

The cost of the grid is mainly fixed:

• Once built, operational costs are a minor component

But in many places, the charging mechanism for the grid is variable:

• On a per kWh basis; or bundled with other charges

Historically the role of the grid is taken for granted, the value poorly understood by consumers and the
                         costs poorly aligned with revenue collection mechanisms
4
The value provided by the grid is hard to separate into component parts
• Considerable overlapping functions
and value mean that separate prices
for separate services have been
slow to develop
• In an world where the grid just ”was”
and nobody questioned the value of
it, it was not necessary to justify the Back-Up
value nor enter into separate Energy Flow
contracts for different services
• However, with changing technology,
the world has changed Ancillary
Trading services
5Previously the grid was a natural monopoly; now there is competition
• Energy economics 101 used to say that large power stations are the most efficient and highest
voltage lines have lowest losses
• Therefore the least cost solution was to build large power stations and then send power down
smaller and smaller wires to the consumer
But that has now changed
• A gas fired power station made up of small gas engines is almost as efficient as a large CCGT
• A solar panel has much the same efficiency alone, in a small or in a large array – meaning that
power stations of almost any size and location are possible
• Fuel cells may make home-generated power as cheap as “grid-generated power” – meaning that
instead of power lines providing long distance energy transport, a gas grid may do this
• Battery storage can act as a “backup” in the home (“behind the meter batteries) and provide
ancillary services (“grid scale battery storage”)
Competition to the grid exists in some of it’s functions
6Some of the functions of the grid can be provided in other ways
Use of
gas Batteries?
pipelines? Back-Up
Energy Flow
Ancillary Batteries?
Trading services
But this is a long way from a world where we do not need a grid
7The grid still has considerable value – but should it be expanded further?
Use of Batteries?
gas
pipelines? Back-Up
Energy Flow
Ancillary Batteries?
Trading services
NO OBVIOUS
COMPETITOR
8Just because competition exists, does not mean the competition wins
• While a solar panel may be efficient stand-alone, the cost of installing it on a roof may be much
more expensive than installing 1000 of them in a field
• While batteries can provide back-up and ancillary services, these are still more cheaply provided
by using (for example) hydro power and a grid in most markets at the current time
The fact is that transmission and distribution augmentation decisions are now more complicated – and
need clearer insight and analysis to make good decisions
• Decisions on network augmentation need a clear framework which takes into account the costs
and benefits, the services that are provided, and whether the service is competitive – if someone
else can provide it
• This may require updates to regulatory frameworks and the ability of networks to respond to
competition like other services do, by offering competitive prices for some services
• It may also require consumers to better understand the value of networks and what services
they are getting for the price they pay
9Grid expansion: views from China and
Australia
Oversupply and curtailment of RE in China drives the grid
expansion program
Power quality issues and security of supply drive grid retrofitting in
Australia
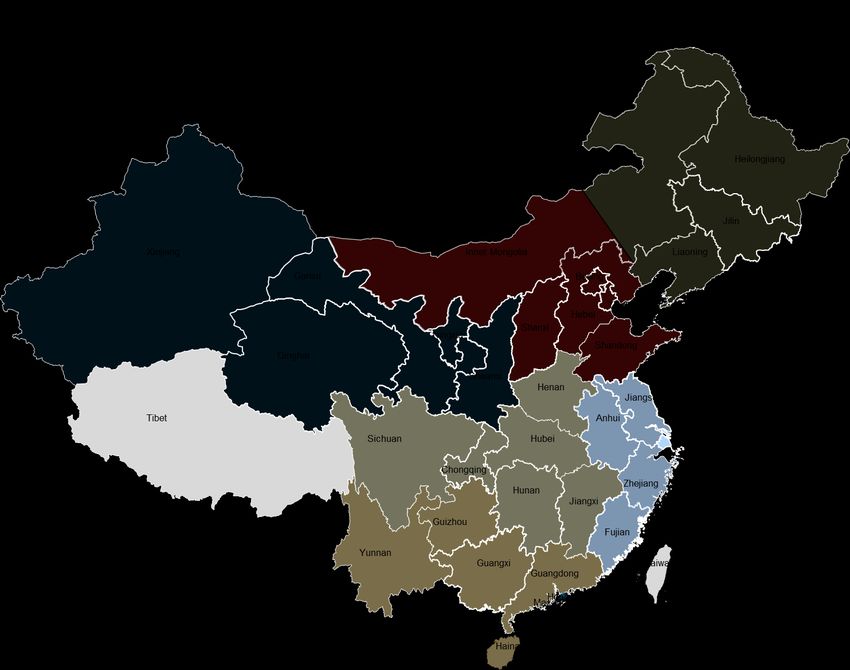
10China wind and solar capacity is mostly found in Northwest, North and
Northeast and East regions where have good resources or high local demand
Wind capacity in H1 2018, MW Solar capacity in H1 2018, MW
Heilongjiang Heilongjiang
Jilin Jilin
Xinjiang Liaoning Xinjiang Beijing Liaoning
Gansu Beijing Gansu
Tianjin
HebeiTianjin Ningxia ShanxiHebei
Ningxia Shanxi
Shandong Qinghai Shandong
Qinghai
ShaanxiHenan ShaanxiHenan
Jiangsu Jiangsu
Tibet Anhui Tibet
Sichuan Hubei Sichuan Hubei Anhui Shanghai
Shanghai
Chongqing Chongqing
Zhejiang Zhejiang
HunanJiangxi Hunan Jiangxi
Guizhou Guizhou
Fujian Fujian
0-1,000 Yunnan Yunnan
0-2,000 Guangxi
GuangxiGuangdong Guangdong
1,000-3,000 2,000-4,000
3,000-5,000 4,000-6,000
5,000-10,000 6,000-9,000 Hainan
Hainan
10,000-28,000 9,000-14,000
Historical wind capacity Historical solar capacity
200 164 172 200
149 155
150 129 150 130
96
GW
GW
100 77 100 77
50 43
50 17 28
0 0
2013 2014 2015 2016 2017 H1 2018 2013 2014 2015 2016 2017 H1 2018
Source: NEA and TLG research
11
11However, much of the renewable generation has been “curtailed” because of
insufficient ability to move the power where it is needed.
Wind curtailment rates in 10 provinces
50%
H1 2016 H1 2017 H1 2018
40%
30%
20%
10%
0%
Gansu Xinjiang Ningxia Shaanxi Hebei Shanxi Inner Mongolia Liaoning Jilin Heilongjiang
Solar curtailment rates in 5 key provinces
40%
H1 2016 H1 2017 H1 2018
30%
Transmission and curtailment rates have
20% generally improved in H1 2018, although
they are still high
10%
0%
Qinghai Gansu Xinjiang Ningxia Shaanxi
12 Source: NEA, Northwest China Energy Regulatory Bureau and TLG research from news reports.UHV DC and AC lines expansions will enable power exports from the curtailed
regions, but their utilization rates are likely to be relatively low at least in
medium-term
Large new coal
UHV AC lines plants & UHV DC lines
solar/wind
Zhalute
Zhundong
Shengli Hami (North)
Hami (South) Ximeng
Ximeng
Mengxi
Shanghaimiao Jingbei
Mengxi Jiuquan
Jinbei East Beijing Ningdong
West Beijing
Jingbian Jinzhong
Jinan Qingzhou
Shijiazhuang
Weifang
Zhengzhou Linyi
Jindongnan Yubei
Nanjing
Lianyungang Taizhou
Suzhou
Xuzhou Wuhan
Nanyang Taizhou Fengxian
Huainan Nanjing
Suzhou Chengdu Yubei Xuancheng
Wanxian Xiangjiaba Shaoxing
Ya’an Wannan Huxi Xiangtan
Jinping
Jingmen Wuhan Zhebei Jinhua
Leshan Zhezhong Dianxibei Xiluodu
Changsha Wenzhou
DC Terminal
BLUE indicate Chuxiong
Fuzhou
UHV DC in Operation
areas with Key Guangzhou
Nuozhadu
hydro resources
UHV DC under construction Shenzhen
Jiangmen
UHV DC approved
structionSource: TLG research and analysis UHV DC proposed
Building massive infrastructure on this scale is expensive and requires significant coordination between
central and provincial authorities. It is unclear if the benefits of the grid expansion outweigh this cost
13
13 because no cost-benefit analysis is undertakenGrid expansions may not be a solution – often it just moves them elsewhere – and
the lines themselves become contingency events that must be managed
UHV DC system – existing and under construction
Zhalute
Zhundon
g
Hami (South)
Ximeng
Shanghaimiao Jingbei
Jiuquan The interconnectors create close to
Ningdong
a national electricity market in
Qingzhou planning, scheduling, dispatch and
Zhengzho Linyi
u economic efficiency.
Nanjing
Taizhou
Suzhou
Wuhan Fengxian But the DC lines are now
Xuancheng
Xiangjiaba
Xiangtan
Shaoxing contingency events given each
Jinping
Jinhua carries 7-10 GW of power.
Dianxibei
Xiluodu
Wudongde Liubei
DC Terminal Chuxiong
Additional fast response Ancillary
Longmen
UHV DC in Operation Nuozhadu Guangzhou Services (more costs) are required
Shenzhen
UHV DC under construction Jiangmen
to prevent catastrophic collapse of
UHV DC approved
local system frequency in such an
Source: TLG research event.
14Supply-side intervention (halting new built in highly curtailed regions and adding
pumped storage plants) can mitigate RE curtailment if successfully implemented
Proposed policies to mitigate curtailment
• Slow-down approval or halt new coal, solar and wind projects in highly curtailed
Supply-side regions will be very positive to reduce curtailment
• Several Non-hydro RE targets have been discussed in China, which incentive
existing generators to continue to build new solar and wind capacity
Flexible • More pumped storage plants: Several provinces like Gansu and Jilin have
Generation plans to build new pumped storage plants
• Increasing flexibility of the system: This has been discussed, but it remains to
be seen whether private players will invest in technologies (such as battery) that
can improve the flexibility of the system
• Wind/solar for heating: This is still not commercially proven.
Demand-side • Local governments with high wind and solar curtailment rates have been trying to
attract energy intensive industries (like data centres) to move to their provinces
Set-up of • Eight provinces have been working to create competitive spot pool markets by
competitive spot end 2018. Mengxi in inner Mongolia and Gansu are among the eight
electricity pool
• If they are implemented in a similar way as international spot pool markets,
market
curtailments are likely to be reduced because dispatch would be largely based on
15
variable cost (solar and wind have zero variable cost)Development of battery storage can reduce curtailment, but it is yet to reach
large-scale commercial deployment in China
Installed capacity of battery storage
• Total installed capacity of battery storage is 243MW.
MW
• 55% of new battery additions driven by the RE sector
300 with most projects installed in northwest region with RE.
+>139% p.a.
250 • In June 2016, NEA launched a pilot programme to
implement a compensation scheme for ancillary services
200 for battery storage in ‘Three North’ region with batteries r
deployed with power plants or independently
150
• NEA drafted a guidance on Improve Storage
Technology and Industry Development which is under
100
– The overall target is to realize early stage of
commercialization for storage industry before 2020 and
50 gradually shift to large scale development before 2025.
– Battery storage is encouraged with RE projects and smart
0
grid.
2012 2013 2014
Source: China Energy Storage Alliance (CNESA)
2015 2016
– Renewable energy plus battery is allowed to participate
ancillary service market.
– NEA proposed to introduce capacity payment mechanism
for storage.
16Australia is also facing challenges of integrating RE and dealing with an aging
grid
Australia has two disconnected power
markets: Coverage of Australia’s electricity grids
• QLD, NSW, VIC, TAS and SA are
interconnected and trade electricity in the
National Electricity Market (NEM). NEM is
an energy-only market with energy and
Ancillary Services being co-optimized. The
market features 5-minute dispatch and 30- NT
minute settlement. QLD
• Western Australia, also has an electricity WA
market, Wholesale Electricity Market
(WEM), that operates over the South-West SA
NSW
Interconnected System (SWIS), one of few
interconnected systems in WA. WEM is an
energy + capacity market with Ancillary NEM
WEM VIC
Services contracted from the incumbent
generator, Synergy. The market features 30-
minute dispatch and 30-minute settlement.
TAS
17Australia’s geography makes power systems very infrastructure intensive
A vast country with low population density, Overview of Australia's grids
Australia is a challenging location for electricity
grid development.
• The infrastructural requirement for the grid 6.5 ct km/km
37.3 km/pax
varies across Australia, with NT requiring 37 3.05 km/kWh
times the circuit km of network infrastructure 9.12 ct km/km
per 1000 customers compared to VIC. 3.14 km/pax
0.22 km/kWh
• The regulatory environment already requires 9.51 ct km/km
3.03 km/pax
NEM
network operators to compare network and 0.19 km/kWh 11.18 ct km/km
3.24 km/pax
non-network solutions 0.48 km/kWh
10.74 ct km/km
1.69 km/pax
• There are significant grid interconnection WEM 0.2 km/kWh
projects planned but all only show benefits if
the gas price remains high ct km/km – measure of linear length of grid wires divided
by the distance they span, interpreted as network density.
9.36 ct km/km
• These infrastructure constraints combined with Lower number indicates opportunity.
km/pax – km of network wires per 1000 customers. 1.04 km/pax
Higher number indicates opportunity. 0.12 km/kWh
the requirement of the network operators to km/kWh – measure of linear length of grid wires by state
consumption. Higher number indicates opportunity.
perform Investment Tests for grid expansion 10.54 ct km/km
Source: Western Power, Power & Water Corportaion, 7.06 km/pax
projects as well as asset replacement projects ElectraNet, AusGrid, Sp AusNet, PowerLink, Transend
0.35 km/kWh
indicates a significant potential for battery
18 storageHigh penetration of VRE and demanding geography may favour storage over
grid expansion
Share of VRE generation (2016) and RE targets
• Sparse population centres and large distances
between load centres can render network 2.67
costs in Australia extremely high %
6.32
• The combination of regulatory environment; %
economic drivers; positive social outlook; high 3.39
penetration of renewables; low power quality; %
grid overloading in remote locations; and
NT
experience of catastrophic black-outs has led 50% RE
Australian citizens and business leaders to target QLD
50% RE
have highly positive outlook towards energy WA target
storage No target SA
50% RE
• Multiple commercial and pilot projects are target NSW
being tested in Australia covering most of the 20% RE
target 5.84
business models indicated in our previous %
reports
46.05 VIC
%
• Australia is the home to the currently world’s 40% RE
9.13
target
largest energy storage system developed by %
Tesla and has a strong market for behind-the- 11.36
%
TAS
meter (BTM) use of storage Source: ABS, AEMO, TLG Analysis, State Government publications 100% RE
19 Note: above chart does not include BTM generation, targetSummary • Both Australia and China saw significant uptake of Variable Renewable Energy. • However, the countries took different approach to address the issues related to the uptake of VRE. • Australia made significant efforts to implement highly localized storage projects developed around supplying various grid and market services. • While China place its bets on the expansion of the UHV transmission lines able to transmit power across distant provinces. • Both approaches are likely to alleviate the issues related to the uptake of VRE, while specific strategy to absorb significant amount of VRE depends on specific circumstances of a given country. 20
So what does this mean for Sri Lanka?

21
A Snapshot at Sri Lanka’s power sector in 2016

Installed capacity                                                      4,013 MW
Peak demand                                                             2,453 MW
Gross Generation                                                    14,361 GWh
Consumption per capita                                                  684 kWh

Private sector participation                         ~30% of installed capacity via IPPs/others

        Sri Lanka's Power Demand by Sector                    Sri Lanka’s Installed Power Capacity by
                   Agricultural                                              Ownership
                      10%                                               SPPs
                                                                        13%            Net-metered
      Industrial                                                                        Projects
         25%                                                                               1%
                                         Domestic                IPPs
                                           51%                   16%
                                                                                CEB
     Commercia                                                                  70%
     l & Others
        14%

          Sri Lanka's Power Generation by Fuel                Sri Lanka's Installed Power Capacity by
                       Solar                                                     Fuel
              Wind
               2%       1%                                      Wind      Solar Biomass
                                                                 3%        2%         1%
                                         Petroleum                                       Petroleu
                                           32%                                              m
                      Hydro                                                               29%
                      30%
                                                                        Hydro
                                                                        43%
                                      Coal
                                      35%                                             Coal
                                                                                      22%

22     Source: CEB, SLSEA, IEA, TLG
Electricity transmission network is solely owned by state-owned CEB
Sri Lanka Transmission System (2017)
• CEB owns and operates the electricity grid;
purchases power from generation licensees
through Power Purchase Agreements
(PPAs) and sells the power transmitted
from generation stations to the distribution
licensees.
• Meanwhile, grid access of renewable
energy is regulated by SLSEA
• There are five major distribution licenses
who purchase the power and distribute to
the end consumers.
• Electricity distribution and sales come under
the purview of CEB and LECO: CEB owns
four distribution licenses for four distribution
regions whilst LECO owns one distribution
license.
23 Source: SLSEAThere is some confusion as to the future direction of the electricity supply
industry – coal, gas… where are the renewables?
Projected Installed Power Capacity (2018-2037)
100% 100%
90% 90%
80% 80%
70% 70%
60% 60%
50% 50%
MW
40%
Coal 40%
30% 30% Gas
20% 20%
10% 10%
0% 0%
2017
2018
2019
2020
2021
2022
2023
2024
2025
2026
2027
2028
2029
2030
2031
2032
2033
2034
2035
2036
2037
Oil Gas/LNG Coal Hydropower Solar Wind Biomass Oil Gas/LNG Coal Hydropower Solar Wind Biomass
Source: CEB LTGEP 2018-2037 Source: Decision on Least Cost LTGEP 2018-2037, PUCSL
• Significant build-up of coal capacity was envisioned in the power development plan proposed by CEB
in April 2017
• However, in the approved plan released in July 2017, the PUCSL overturned the decision to construct
more new coal-fired power stations, with a plan heavily weighted towards gas and no new coal
capacity additions
• While wind and solar feature in both plans, the quantities are not significant
24Sri Lankan electricity grid experienced three instances of nationwide black outs
in the last 3 years, with important lessons learned in the development of
ancillary services for the robustness of system operation
Date Cause for backout System Response Implications
Technical faults Appointed a special
Worst blackout in 20
resulting from two committee to probe
years. Power was
13th March 2016 break downs of a key
completely restored
into all the incidents
transformer and a and prepare
only after a day
transmission line comprehensive report
Disruption of a local
Lightning strike on a grid resulted in a
major transmission Power was restored country wide blackout
25th Feb 2016 line causes tripping after 3 hours despite respective
and technical fault protection systems in
place
System was operating at
A CEB commissioned
low load, hence was
study recommended
Tripping of a generating vulnerable to over
specification of ‘must
27th Sep 2015 unit caused a total voltage. Load shedding
run’ units and addition of
system failure in the grid and transformer tapper
shunt reactors to
actions aggravated
mitigate such situations
situationAncillary Services are the support services which are required for improving
and enhancing the reliability and security of the electrical power system
• At present, there are no formal ancillary services. Grid frequency imbalance is dealt
Real power support service or load
with by available hydro plants and oil based plants, but the system response is not
following frequency support
optimal. As the grid grows, coupled with penetration of RE and reduction of oil use, a
ancillary services
robust ancillary system will be needed
• Voltage support involves the maintenance of reactive power to the grid to maintain
Voltage control or reactive power system voltage in the optimal range.
control ancillary services • For the replacement of thermal capacity by renewables to be successful, Pump
Storage Power Generation (PSPP) is going to be very important.
•Nation wise electricity outage in Feb and March 2016 resulted in studies on the
Black start ancillary services requirement of black start services. However, no service codes are currently being
planned. Design of a properly sized system for black start support in close proximity to
a large Power Stations is standard
• CEB sponsored studies on the system outages have recommended specifying ‘must
Specification of ‘Must Run” units
run units’ for voltage support, which is to keep a number of extra units running to support
and methodology
the power system recovery from a large disturbance to the normal operation
•When a coal power plant’s operation is halted, the repowering takes a day or more. In
such instances of supply shocks due to equipment failures at the coal plant, the
System reliability to supply shocks
interconnected transmission capacity and systems should ensure “n-1” reliability at all
times
26Sri Lanka clearly needs a strong network to underpin economic growth
• With no gas network and significant hydro resources, using other forms of energy transport is
not feasible
• Battery storage may be useful for certain services, but cannot replace the grid
• The small size of the country tend to drive a lower cost per customer (compared to the huge
distances per head of population in Australia, for example) meaning that the grid is likely to
remain relevant for a long time
• Integration of intermittent renewables into the Sri Lanka system will need a holistic energy policy
which takes into account:
– Impact of intermittency on the system;
– Location of resources (both conventional and renewable);
– Regulatory processes which allow fair competition between grid expansion and alternatives ways of
achieving the same objective, such as location of generation closer to the load etc.
– Flexibility in regulatory processes and tariff setting mechanisms which allow the network to compete
The best solution for consumers is for an efficient outcome which takes into account all technologies. A
modern regulatory framework and enhanced decision making framework would enable this to take place
27Contact Us
By email
General Capabilities Inquiries
projects@lantaugroup.com
Electricity Gas Networks Direct Communications
mthomas@lantaugroup.com
sfairhurst@lantaugroup.com
jooi@lantaugroup.com
Insight
By phone
+852 2521 5501 (Hong Kong office)
+65 6957 1458 (Singapore office)
Rigour
By mail
The Lantau Group (HK) Limited
Value 4602-4606 Tower 1, Metroplaza
223 Hing Fong Road,
Kwai Fong, Hong Kong
The Lantau Group (Singapore) Pte Ltd
24 Raffles Place, #25-01
Clifford Centre
Singapore 048621
Online
www.lantaugroup.com
28You can also read