Culture. Innovation. Value - Investor Presentation August 2021 - Cooper Standard

Page created by Rita Gibson
 
CONTINUE READING
Culture. Innovation. Value - Investor Presentation August 2021 - Cooper Standard
Culture. Innovation. Value.

Investor Presentation
August 2021
Culture. Innovation. Value - Investor Presentation August 2021 - Cooper Standard
Forward-Looking Statements

This presentation includes “forward-looking statements” within the meaning of U.S. federal securities laws, and we intend that such forward-looking statements be subject to the safe harbor created thereby. Our use of
words “estimate,” “expect,” “anticipate,” “project,” “plan,” “intend,” “believe,” “outlook,” “guidance,” “forecast,” or future or conditional verbs, such as “will,” “should,” “could,” “would,” or “may,” and variations of such words
or similar expressions are intended to identify forward-looking statements. All forward-looking statements are based upon our current expectations and various assumptions. Our expectations, beliefs, and projections
are expressed in good faith and we believe there is a reasonable basis for them. However, we cannot assure you that these expectations, beliefs and projections will be achieved. Forward-looking statements are not
guarantees of future performance and are subject to significant risks and uncertainties that may cause actual results or achievements to be materially different from the future results or achievements expressed or
implied by the forward-looking statements. Among other items, such factors may include: the impact, and expected continued impact, of the COVID-19 outbreak on our financial condition and results of operations;
significant risks to our liquidity presented by the COVID-19 pandemic risk; prolonged or material contractions in automotive sales and production volumes; our inability to realize sales represented by awarded business;
escalating pricing pressures; loss of large customers or significant platforms; our ability to successfully compete in the automotive parts industry; availability and increasing volatility in costs of manufactured components
and raw materials; disruption in our supply base; competitive threats and commercial risks associated with our diversification strategy through Advanced Technology Group; possible variability of our working capital
requirements; risks associated with our international operations, including changes in laws, regulations, and policies governing the terms of foreign trade such as increased trade restrictions and tariffs; foreign currency
exchange rate fluctuations; our ability to control the operations of our joint ventures for our sole benefit; our substantial amount of indebtedness and variable rates of interest; our ability to obtain adequate financing
sources in the future; operating and financial restrictions imposed on us under our debt instruments; the underfunding of our pension plans; significant changes in discount rates and the actual return on pension assets;
effectiveness of continuous improvement programs and other cost savings plans; manufacturing facility closings or consolidation; our ability to execute new program launches; our ability to meet customers’ needs for
new and improved products; the possibility that our acquisitions and divestitures may not be successful; product liability, warranty and recall claims brought against us; laws and regulations, including environmental,
health and safety laws and regulations; legal and regulatory proceedings, claims or investigations against us; work stoppages or other labor disruptions; the ability of our intellectual property to withstand legal
challenges; cyber-attacks, data privacy concerns, other disruptions in, or the inability to implement upgrades to, our information technology systems; the possible volatility of our annual effective tax rate; the possibility of
a failure to maintain effective controls and procedures; the possibility of future impairment charges to our goodwill and long-lived assets; our ability to identify, attract, develop and retain a skilled, engaged and diverse
workforce; our ability to procure insurance at reasonable rates; and our dependence on our subsidiaries for cash to satisfy our obligations; and other risks and uncertainties, including those detailed from time to time in
the Company’s periodic reports filed with the Securities and Exchange Commission.
You should not place undue reliance on these forward-looking statements. Our forward-looking statements speak only as of the date of this presentation, and we undertake no obligation to publicly update or otherwise
revise any forward-looking statement, whether as a result of new information, future events or otherwise, except where we are expressly required to do so by law.
This presentation also contains estimates and other information that is based on industry publications, surveys, and forecasts. This information involves a number of assumptions and limitations, and we have not
independently verified the accuracy or completeness of the information.

                                                                                                                                                                         © 2021 Cooper-Standard Holdings, Inc. All rights reserved.   2
Culture. Innovation. Value - Investor Presentation August 2021 - Cooper Standard
Company Overview

                   © 2021 Cooper-Standard Holdings, Inc. All rights reserved.   3   3
Culture. Innovation. Value - Investor Presentation August 2021 - Cooper Standard
Leading Market Positions Across All Core Product Lines

                                                1         2020 Revenue by product / % of Total Revenue
      2020 Revenue $2.4B                                                                                                                                                                         Key Competitors
       ~$225M unconsolidated JV                                                                                                                                               CPS                Henniges
                                                                                                    Sealing
                                                                                                    Sealing Systems
                                                                                                            Systems                                                    16%                       Hutchinson
                                                                                                           $1.2B / 51%                                                                           Saar Gummi
                South America
                     3%                                                                                                                                        $7.7B                             Standard Profil
                                                                                                          #1 Globally
                                                                                                         #1  Globally                                         Global Market                      Toyoda Gosei

                                                                                                  Fuel & Brake Delivery                                                       CPS
        Asia Pacific                                                                              Fuel & Brake Delivery                                                15%                       Martinrea
           20%                                                                                          Systems
                                                                                                        Systems                                                                                  Maruyasu
                                                                                                           $0.6B / 25%                                                                           Sanoh
                                                                                                                                                               $4.1B                             TI Automotive
                                     North
                                    America                                                               #2 Globally
                                                                                                         #2  Globally                                         Global Market

                                     51%
           Europe
                                                                                                         Fluid Transfer                                                       CPS                ContiTech
            26%                                                                                          Fluid Transfer                                                  12%
                                                                                                            Systems                                                                              Hutchinson
                                                                                                            Systems                                                                              MGI Coutier/Avon
                                                                                                           $0.4B / 19%
                                                                                                                                                               $3.3B                             Teklas
                                                                                                                                                              Global Market
                                                                                                          #3 Globally
                                                                                                         #3  Globally                                                                            Tristone

                                                          1 Revenue breakout by product as shown includes automotive business only. Numbers subject to rounding.
 1 Includes first half 2020 revenue from business units   Global Market Size based on IHS light vehicle production data and estimated average content per vehicle
 in India and Europe that were divested on July 1, 2020

                                                                                                                                                          © 2021 Cooper-Standard Holdings, Inc. All rights reserved.   4
Culture. Innovation. Value - Investor Presentation August 2021 - Cooper Standard
Supporting Diverse Global Customer Base1
                                                                Automotive

                                  2
  2020 Revenue $2.4B

                PSA
                4%     VW Daimler
                       5%  5%
                                  Renault
         FCA                      Nissan
         11%                       4%

                                           Tata
                                           3%
    GM
   22%                                      Geely
                                             3%
                      Other Auto           Hyundai
                        11%                 1%
         Ford
         25%

                             Non-Auto
                               5%
                                                                  Diverse Markets

                      1   Customer list as represented by logos on this page is not all-inclusive
                      2   Includes first half 2020 revenue from business units in India and Europe that were divested on July 1, 2020   © 2021 Cooper-Standard Holdings, Inc. All rights reserved.   5
Culture. Innovation. Value - Investor Presentation August 2021 - Cooper Standard
Exceeding Customer Expectations
Continuing Recognition for Quality and Service

        GM Supplier of the Year                  GM Supplier Quality Excellence Award
          Four Consecutive Years                         20 Facilities Recognized

                                                                 . © 2021 Cooper Standard Holdings, Inc. All rights reserved.   6
Culture. Innovation. Value - Investor Presentation August 2021 - Cooper Standard
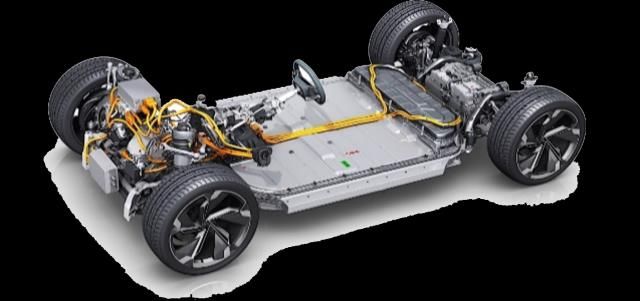
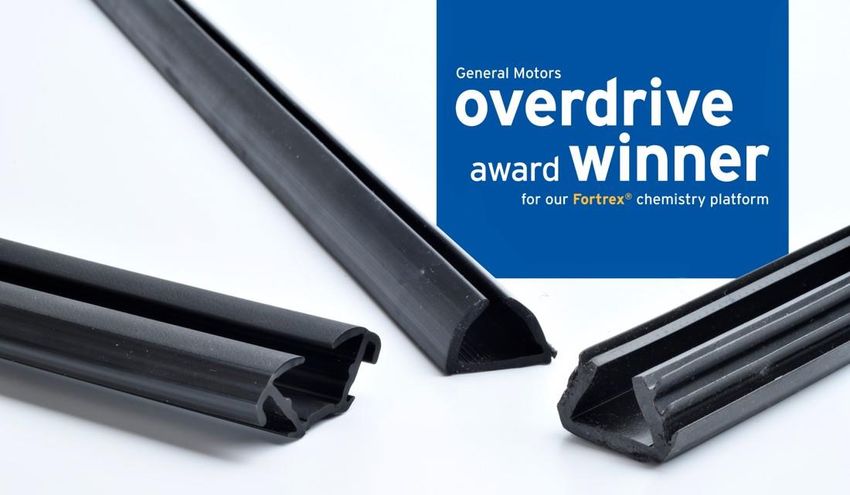
Fortrex® Chemistry Platform Recognized for Sustainability

• Advantaged carbon footprint*

    – 53% lower than EPDM rubber
    – 22% lower than TPV

• Significantly lighter weight

• Enhanced product performance

    – Improved resilience/rebound
    – Higher resistance to compression set
    – Superior abrasion resistance and durability
    – Resistance to ultra-violet rays, weathering

                                        * Based on independent third-party industry standard analysis
                                                                                                        . © 2021 Cooper Standard Holdings, Inc. All rights reserved.   7
Culture. Innovation. Value - Investor Presentation August 2021 - Cooper Standard
Advantaged Market Position

                             © 2021 Cooper-Standard Holdings, Inc. All rights reserved.   8
Culture. Innovation. Value - Investor Presentation August 2021 - Cooper Standard
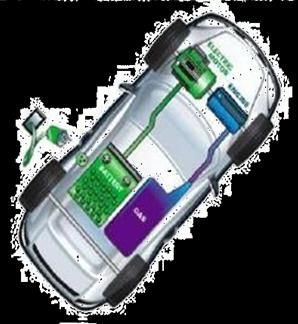
Advantaged Market Position Drives Strong Growth Outlook
CPS Sales 5-year CAGR of ~9%1 Expected to Outpace Industry

            Global Light Vehicle Production - Million Units2
                                                               Projected Growth
                                                                 2020 - 2025
                                                                                                                       Cooper Standard’s 2021 mix favorably weighted3
                                                                                      87.9
  78.2                                                                                                                                                                                  Trucks/
                                                                                                                                                                     Cars
                                                                                                                                                                                      Crossovers
                                             66.8
                                                                                                               % Revenue – Global4                                   19%                   73%
                                                                     +7.4%
                                                                     CAGR
                                                                                                               % Revenue - N. America4                                9%                   88%

                                                                                                               CPV (relative to cars) – Global                                            ~2.4x
                                                                      +2.7%
                                                                      CAGR
                                                                                                               CPV (relative to cars) – N. America                                        ~2.7x

 2014    2015   2016   2017   2018   2019    2020 2021E 2022E 2023E 2024              2025
                              Car     Truck/Crossover

                               1 Based on Company estimates
                               2 IHS – July 2021 (excluding Japan)
                               3 Data based on Company estimates – full year 2021
                               4 Does not show non-automotive revenue of 7% globally and 2% in North America
                                                                                                                                                 © 2021 Cooper-Standard Holdings, Inc. All rights reserved.   9
Culture. Innovation. Value - Investor Presentation August 2021 - Cooper Standard
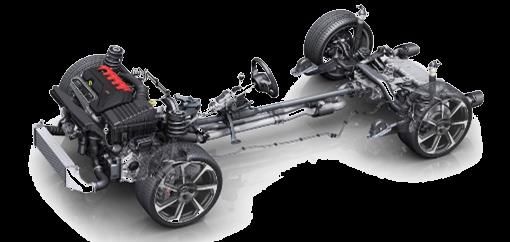
Electric Vehicle Trends Creating Opportunity
CPS Growth in EV Segment Outpacing the Market; Expanding Content Per Vehicle

            Global Light Vehicle Production – EV Share
                                                                                               CPS - Key EV Data Points
                           Million Units1
                                                                                         20%
                                                                   85.8
                                                                                 87.9          • Current supplier on 16 of the top 25 EV
 100.0                                                                                   18%
                           82.0                84.1                                              platforms
                                                                                         16%
         73.8
  80.0
                                                                                         14%   • Strong new EV business awards continue
                                                                                         12%
  60.0
                                                                                         10%
                                                                                                   – $100m in 2020
                                                                                         8%
  40.0                                                                                             – $59m in H1 2021, up 41% vs H1 2020
                                                                                         6%

  20.0                                                                            13.5
                                                                                         4%
                                                                                               • Expected sales growth of ~50% CAGR2 over
                                                8.2                10.7
          4.2               6.1                                                          2%      next four years
    -                                                                                    0%
         2021              2022               2023                 2024         2025
                                                                                               • CPV growth opportunity of up to 20% vs. ICE
                Electric       Total Production            % Total represented by BEV
                                                                                                 vehicles

                           1 IHS   – July 2021 (excluding Japan)
                           2 Data   based on Company estimates                                                  . © 2021 Cooper Standard Holdings, Inc. All rights reserved.   10
Powertrain Thermal Management
Increased Complexity Drives CPV Opportunities

        8 Part Numbers                                                       28 Part Numbers                                       20 Part Numbers

Internal Combustion Engine (Downsized)                                       Hybrid Electric Vehicle                               Battery Electric Vehicle
                                                                        Cabin Heating (Radiator and Engine Cooling
   Cabin Heating (Radiator and Engine Cooling)                                                                        Cabin Heating (Battery, Drive inverter, Motor and CPU Cooling)
                                                                         Battery, Drive-inverter and Motor Cooling)

                         Glycol applications (cooling, heating, degassing)
                                                                                                                                    . © 2021 Cooper Standard Holdings, Inc. All rights reserved.   11
Customer-Centric Innovation
Key Developments Driving Growth in the Global EV Market

        Commercialized Innovations

                       PlastiCool® 2000         Easy Lock™                     FlushSeal™

                                                             © 2021 Cooper-Standard Holdings, Inc. All rights reserved.   12
Strategic Diversification
Advanced Technology Group

                            © 2021 Cooper-Standard Holdings, Inc. All rights reserved.   13
Advanced Technology Group
Continuing Innovation/Diversification Strategy
Materials Licensing and Sales

                                                 Applied Materials Science (AMS)

                                                 • Completed technology development with two footwear
                                                   customers

                                                      ➢ Commercial negotiations now in process

                                                 • Continuing technology development work with other footwear
                                                   customers

                                                 • Continuing in the commercial phase for building and
                                                   construction products technology

                                                 • Considering technology development projects in new, promising
                                                   industry segments

                                                      ➢ Expanding TAM

                                                                              . © 2021 Cooper Standard Holdings, Inc. All rights reserved.   14
Path Forward to Improving ROIC

                                 © 2021 Cooper-Standard Holdings, Inc. All rights reserved.   15
Driving Value Plan
Aggressive Initiative to Return to Double Digit ROIC

                                                                                                                                                                      *

              *Based on current management expectations for global light vehicle production and successful execution of
              above listed initiatives. Percentages (except ROIC) reference percent of sales.                             . © 2021 Cooper Standard Holdings, Inc. All rights reserved.   16
Cooper Standard – Compelling Investment Thesis

 1
     Leading Market Positions in Each of Three Core Product Groups

 2
     Recognized by Global Customers for World-class Technology, Innovation and Service

 3
     Strategically Positioned to Capitalize on Continuing Growth Trends in Trucks and SUVs

 4
     Growth Trends in Electric Vehicles Creating Opportunity for Higher CPV, Expanded TAM

 5
     Strategic Diversification - Leveraging Advanced Technology and Materials Science Beyond Automotive Industry

 6
     Executing Defined, Focused Plan to Return to Double-digit ROIC; Driving Improved Results

                                                                                             © 2021 Cooper-Standard Holdings, Inc. All rights reserved.   17
You can also read