CREATING THE LEADER IN CANADIAN CANNABIS RETAIL - HIGH TIDE TO COMBINE WITH META GROWTH

Page created by Megan Willis
 
CONTINUE READING
CREATING THE LEADER IN CANADIAN CANNABIS RETAIL - HIGH TIDE TO COMBINE WITH META GROWTH
C R E AT I N G T H E L E A D E R I N
                     C A N A D I A N C A N N A B I S R E TA I L
                     HIGH TIDE TO COMBINE WITH META GROWTH

September 16, 2020
CREATING THE LEADER IN CANADIAN CANNABIS RETAIL - HIGH TIDE TO COMBINE WITH META GROWTH
DISCLAIMER
General

This presentation (the “presentation”) is for informational purposes only and does not constitute an offer to sell, a solicitation of an offer to buy, or a recommendation to purchase any equity, debt or other financial instruments of High Tide Inc.
(“High Tide”), Meta Growth Corp. (“Meta Growth”) or any of their affiliates. This presentation has been prepared solely to assist investors and management of High Tide and Meta Growth in making their own evaluation with respect to the
proposed business combination between High Tide and Meta Growth (the “proposed business combination”), as contemplated in the Arrangement Agreement entered into by High Tide and Meta Growth, and for no other purpose. It is not
intended to, and should not, form the basis of any investment decision or any other decision in respect of the proposed business combination or the business or affairs of High Tide or Meta Growth. The information contained herein does not
purport to be all-inclusive. The data contained herein is derived from various internal and external sources, and no representation is made as to the reasonableness of the assumptions made within or the accuracy or completeness of any
projections or modeling or any other information contained herein. Any data on past performance or modeling contained herein is not an indication as to future performance.

Information, including forward-looking statements, in this presentation regarding High Tide and Meta Growth has been provided and prepared by, respectively, High Tide and Meta Growth, and neither party assumes any obligation to, and will
not, update any information (including any forward-looking statements or forecasts) in this presentation (and in particular, any statements or forecasts pertaining to the other party), except as required by applicable Canadian securities laws.

Forward-Looking Statements

Certain statements made and contained in these presentation are "forward-looking statements", "forward looking information", or "financial outlook" within the meaning of applicable Canadian securities laws (collectively, "forward-looking
statements"). Forward-looking statements are typically, but not always, identified by words such as "anticipate", "continue", "estimate", "expect", "forecast", "may", "will", "project", "could", "plan", "intend", "should", "believe", "outlook", "potential",
"target", "seek", "budget", "predict", "might" and similar words suggesting future events or future performance. Specifically, forward-looking statements included in this presentation include, but are not limited to, (i) information relating to the
proposed business combination (including, but not limited to, anticipated combined revenues, EBITDA, cash flow and cash position, capital and financial outlook and leverage ratios, and anticipated synergies), (ii) expected timing of completion
of the proposed business combination, (iii) projected organizational chart for the potential combined entity resulting from the proposed business combination (the “resulting company”), (iv) information relating to potential growth and value
creation opportunities of the potential combined entity, (v) information relating to High Tide and Meta Growth’s business strategies following the proposed business combination, plans and objectives, (vi) and anticipated growth strategies and
sales opportunities, (vii) industry position, (viii) expected cash flow and related growth rates and stability, (ix) expectations regarding the resulting company’s business strategy for future growth prospects and plans for development (which
remain subject to, among other uncertainties, the timing of the COVID-19 pandemic recovery), and (x) statements with respect to (a) accretive earnings, anticipated revenue, operational and annual cost synergies expected within twelve (12)
months of closing of the proposed business combination, associated with High Tide’s acquisition of Meta Growth, (b) internal expectations, estimated margins, expectations for future growing capacity and growth plans, costs and opportunities,
(c) the effect of the proposed business combination on the resulting company and its strategy going forward, (d) the receipt of regulatory approvals, (e) the completion of any capital project or expansions, (f) expectations relating to future
production costs, (g) the closing of the proposed business combination (including the satisfaction of closing conditions), and (h) the consideration to be received by the shareholders of Meta Growth, which may fluctuate in value due to High
Tide’s common shares forming the consideration. Forward-looking statements are based on current expectations, estimates, projections, and assumptions of High Tide and Meta Growth described herein in respect of certain projected financial
and non-financial information regarding High Tide, Meta Growth, and the resulting company including, without limitation, assumptions about (i) the timing of receipt of required approvals for the proposed business combination, (ii) the anticipated
benefits of the proposed business combination and the resulting company, (iii) current and anticipated market and economic conditions, (iv) current and future industry trends, (v) the financial and operational attributes of High Tide and Meta
Growth as of the date hereof and the future performance of the resulting company following completion of the proposed business combination, and (vi) the provinces of Canada in which the resulting company will operate removing or increasing
caps on the number of private retail store locations to permit the resulting company’s retail store growth plan to open approximately 115 retail locations by the end of 2021 with a focus on Ontario, and growth opportunities. High Tide and Meta
Growth believe the material factors, expectations and assumptions reflected in the forward-looking statements are reasonable at this time but no assurance can be given that these factors, expectations and assumptions will prove to be correct.
Further, forward-looking statements contained herein (including, but not limited to, statements regarding future plans, objectives, strategies and market, operational, and financial positions) involve known and unknown risks and uncertainties
that could cause actual results or events to differ materially from those anticipated in such forward-looking statements, including, but not limited to, (i) the risk that the proposed business combination does not proceed as planned or at all, (ii) the
risk that if the proposed business combination does proceed that anticipated synergies do not materialize as planned or at all, (iii) general economic risks and uncertainties, including in light of the COVID-19 pandemic, and (iv) political and
regulatory risks and other risks associated with changes in tax and regulatory regimes. Due to the risks, uncertainties and assumptions inherent in forward-looking statements, readers should not place undue reliance on these forward-looking
statements.

Forward-looking statements contained in this presentation are made as of the date hereof and are subject to change. All statements other than statements of historical fact may be forward-looking statements. The forward-looking statements
contained in this presentation speak only as of the date of this presentation and are expressly qualified by this cautionary statement. Except as required by applicable Canadian securities laws, neither High Tide nor Meta Growth assume any
obligation to revise or update forward looking statements to reflect new circumstances.
                                                                                                                                                                                                                                                                    2
CREATING THE LEADER IN CANADIAN CANNABIS RETAIL - HIGH TIDE TO COMBINE WITH META GROWTH
DISCLAIMER
Currency, Diagrams, and Tables

In this presentation, all amounts are in Canadian dollars, unless otherwise indicated. Any graphs, tables or other information in this presentation demonstrating the historical performance of High Tide and Meta Growth or of any other entity
contained in this presentation are intended only to illustrate past performance and are not necessarily indicative of future performance of High Tide, Meta Growth or such entities.

Non-IFRS Measures and Discussion

Certain financial measures contained in this presentation are non-International Financial Reporting Standards (“IFRS”) measures, including Pro Forma Revenue and Adjusted EBITDA. These terms are not defined by IFRS and, therefore, may
not be comparable to similar measures provided by other companies. These metrics have no direct comparable IFRS financial measure. Such information is intended solely to provide additional information in respect of understanding and
analyzing High Tide, Meta Growth and the resulting company’s business trends and performance and should not be considered in isolation or as a substitute for measures of performance prepared in accordance with IFRS. Management of
High Tide and Meta Growth believe that, in conjunction with results presented in accordance with IFRS, these non-IFRS financial measures assist in providing a more complete understanding of certain aspects of High Tide or Meta Growth's
results of operations and financial performance. Readers are cautioned, however, that these measures should not be construed as an alternative to measures determined in accordance with IFRS as an indication of each entity's performance.
Reference is made to High Tide and Meta Growth’s publicly filed documents available on SEDAR, including the most recently filed financial statements and MD&A of High Tide and Meta Growth, for a discussion of certain of these measures.
Refer to Appendix A for a reconciliation of net loss from continuing operations to Adjusted EBITDA for Meta Growth. Forecast amounts for the non-IFRS financial measures disclosed here are also prepared on a non-IFRS basis, and this
presentation does not provide reconciliations of such forward-looking measures to the most directly comparable financial measures calculated and presented in accordance with IFRS due to a large number of unknown variables and the
uncertainty related to future results. These unknown variables may include unpredictable transactions of significant value which may be inherently difficult to determine, without unreasonable efforts.

All pro forma financial information contained in this presentation is draft and is subject to change, and some or all of such pro forma financial information may be superseded, in part or in their entirety, by pro forma financial information
contained in the pro forma financial statements to be included in the management information circular for the shareholders meeting of Meta Growth to approve the proposed business combination, and as such, readers are cautioned not to
place undue reliance on the pro forma financial information contained in this presentation.

No Offer or Solicitation

This presentation is not intended to and shall not constitute an offer to sell or the solicitation of an offer to sell or the solicitation of an offer to buy any securities or a solicitation of any vote of approval, nor shall there be any sale of securities in
any jurisdiction in which such offer, solicitation or sale would be unlawful prior to registration or qualification under the securities laws of any such jurisdiction.

                                                                                                                                                                                                                                                                       3
CREATING THE LEADER IN CANADIAN CANNABIS RETAIL - HIGH TIDE TO COMBINE WITH META GROWTH
C R E AT I N G T H E L E A D E R I N C A N A D I A N C A N N A B I S R E TA I L

                                                                                                                                  Industry leading gross margin of 38%
       Creates Canada’s largest cannabis
                                                                                                                                  and the most profitable publicly-traded
          retailer with 62 stores(1) and
                                                                                                                                     Canadian cannabis retailer with
      ~$148 million(2) in annualized revenue
                                                                                                                                     Adj. EBITDA margin of 12%(2)(3)

     Anticipated annual cost and operational
              synergies of between                                                                                              Strong balance sheet with an estimated
       $8 million and $9 million creating                                                                                       $21 million(4) in cash to support growth
          significant operating leverage

  Note: (1) Represents pro forma (“PF”) store count post store optimizations / closures and is inclusive of locations related to transactions that have yet to close including META’s acquisition of its Kitchener location and HITI’s
  divestiture of its KushBar locations; (2) Annualized based on META and HITI’s most recent publicly reported quarters; (3) After taking into effect estimated cost synergies; (4) Cash and cash equivalents as of August 17, 2020
  before transaction costs;                                                                                                                                                                                                              4
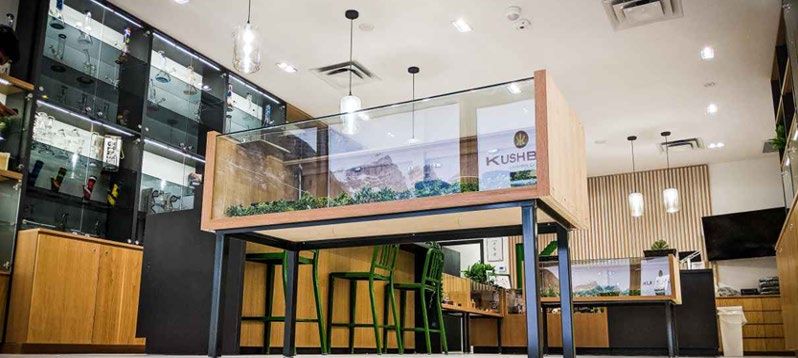
CREATING THE LEADER IN CANADIAN CANNABIS RETAIL - HIGH TIDE TO COMBINE WITH META GROWTH
Canadian Retail
STRONG GEOGRAPHIC FOOTPRINT                                                                                                                                                                                        Position(1)

   Existing Retail Operations
    Near Term Opportunities
                                                                                                                                                                                                                           #1
                                                                                                                                                                                                                       Retail
   Retail Locations                                                                                                                                                                                                 Locations(2)(3)

                                                                                                                                                                                                                           62
                                                                                                                  8                                                                                                  Addressable
                                                                                 42                                                                                                                                   Population
   Achieves AGLC cap of 42                                                                         3                                  9
                                                                                                                                          3

   retail locations in AB and
  realizes immediate EBITDA
    accretion through store                                                                                                                                                                                              26.9
     optimization initiatives                                                                                                                                                                                              million

Note: (1) Based on annualized last quarter revenues and current operational store count; (2) Represents pro forma store count post store optimizations / closures and is inclusive of locations related to transactions that have yet to
close including META’s acquisition of its Kitchener location and HITI’s divestiture of its KushBar locations; (3) Comprised of 7 corporate (store count reflects the sale of META’s Yonge St. location which closed on Sep 1, 2020) and 2   5
branded locations which is inclusive of locations related to transactions that have yet to close including META’s acquisition of its Kitchener location
CREATING THE LEADER IN CANADIAN CANNABIS RETAIL - HIGH TIDE TO COMBINE WITH META GROWTH
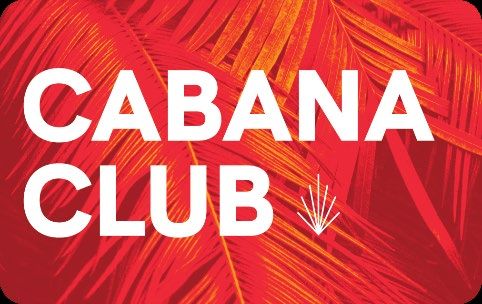
L A R G E S T C A N N A B I S R E TA I L E R I N C A N A D A
Store Count (# of Operating Locations)(1)
                           The combined entity will consolidate and operate high-quality retail locations

                      62
   80

   60
                                                       58                               53
   40
                                                                                                                         37                               32
   20
                                                                                                                                                                                           18                              17

    −

                                  (2)                        (3)                                                               (4)                                 (5)

Last Quarter Annualized Revenue ($mm)

                    $148
 $180

                                                     $114
 $150

 $120

                                                                                       $93
                                                                                                                        $55
 $90

                                                                                                                                                         $22                              $19
 $60

 $30

                                                                                                                                                                                                                           $9
   −

        Sources: Company filings, press releases, company websites
        Notes: As of September 15, 2020; (1) Includes locations temporarily closed due to COVID-19; (2) Represents pro forma store count post store optimization / closure; (3) Includes 47 franchise stores and 11 corporate stores; (4)   6
        Includes three KushBar stores being expected to be sold to Halo Labs; (5) Includes Kitchener store acquisition
CREATING THE LEADER IN CANADIAN CANNABIS RETAIL - HIGH TIDE TO COMBINE WITH META GROWTH
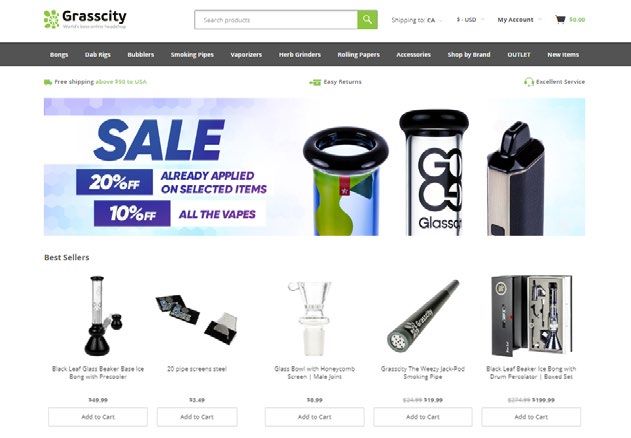
TRANSACTION
OVERVIEW
CREATING THE LEADER IN CANADIAN CANNABIS RETAIL - HIGH TIDE TO COMBINE WITH META GROWTH
T R A N S A C T I O N S U M M A RY
                       •   High Tide to acquire all of the issued and outstanding common shares of Meta Growth (the “Transaction”)

      Proposed         •   Court approved statutory plan of arrangement
     Transaction       •   Pro forma ownership of 54.375% for High Tide and 45.625% for Meta Growth (on an as converted fully diluted basis)
                       •   High Tide to concurrently move its listing to the TSX Venture exchange upon closing of the Transaction

                       •   0.824 High Tide common shares per Meta Growth common share
   Consideration to
    META Growth
                       •   Based on High Tide’s 10-day volume-weighted average price (“VWAP”) of $0.161 on August 20, 2020, implies a value of $0.133 per Meta
                           Growth share which represents a 14% premium to Meta Growth’s 10-day VWAP

                       •   Meta Growth shareholder approval

   Key Approvals &     •   TSX Venture Exchange approval to list High Tide
  Closing Conditions   •   Other customary regulatory and court approvals and customary closing conditions
                       •   Obtained consents, change of control waiver and amendments from secured and unsecured debt holders, as required

                       •   Termination fee and reverse termination fee of $2 million in the event that the Transaction is terminated as a result of a breach of the non-
                           solicitation covenants and $1 million in the event of breach of representations and warranties

   Deal Protections    •   Non-solicitation and a right for each party to match any superior proposal for five business days
                       •   Shareholders representing ~41.4% of High Tide will enter into lock-up agreements for a period of 12 months
                       •   Support agreements from largest Meta Growth shareholders representing ~14.1% of Meta shares outstanding

     Pro Forma         •   Raj Grover, CEO of High Tide and his team will lead the combined entity going forward
    Management         •   Mark Goliger, CEO and Mike Cosic, CFO of Meta Growth will ensure that there is an orderly transition

                       •   Special meeting of Meta Growth shareholders expected to occur in late October
       Timing          •   Anticipated closing Q4 2020
                                                                                                                                                                           8
CREATING THE LEADER IN CANADIAN CANNABIS RETAIL - HIGH TIDE TO COMBINE WITH META GROWTH
T R A N S A C T I O N R AT I O N A L E
 OPERATIONAL METRICS (COMBINED PRO FORMA)                                                                                                       FINANCIAL METRICS (COMBINED PRO FORMA)

                         62                                                              115                                                               $148M                                                                  38%
              Store Count(1)                                                      Store Count                                                                 Revenue                                                     Gross Margin
                        Current                                                          (Dec-21)                                                  (Last Quarter Annualized)                                         (Last Quarter Annualized)
 • Creates Canada’s largest                                       • Growth plans include nearly                                            • Pro forma company is currently                                  • Market leading gross margins
   cannabis retail network                                          doubling current footprint by the                                        the single largest Canadian                                       enhanced by additive business
                                                                    end of 2021 with a focus on                                              cannabis retailer by sales                                        lines outside of retail (ie.
 • Combined entity will pursue
                                                                    Ontario as Canada’s largest                                                                                                                wholesale, accessory
   further build-out in Ontario,                                                                                                           • Approx. 29% larger than the next
                                                                    cannabis market                                                                                                                            distribution, online accessories
   Alberta and British Columbia                                                                                                              biggest competitor
                                                                                                                                                                                                               and CBD sales)

                            9                                                     65,000                                                                  ~$8.4M                                                                 12%
           Ontario Stores(2)                                                    # of Rewards                                                        Cost Synergies(3)                                                    Adj. EBITDA%
                        Current                                                   Members                                                                      (Estimated)                                          (Last Quarter Annualized)
 • #1 in Ontario based on total fully                             • Rewards program focuses on                                             • Annual cost and operational                                     • $18.4 million of Adj. EBITDA
   owned corporate store count(4)                                   building long-term purchase                                              synergies of approx. $8 million to                                (annualized) after taking into
   amongst public-traded peers                                      habits and a strong relationship                                         $9 million expected within 12                                     effect estimated cost synergies
                                                                    with customers to drive sales                                            months of transaction closing
 • Combined entity will represent                                                                                                                                                                            • Additional upside from cross-
   6% Ontario market share(5)                                                                                                                                                                                  selling opportunities

 Source: Company filings; Alcohol and Gaming Commission of Ontario
 Note: (1) Pro forma store count post store optimizations / closures; (2) Includes 7 fully owned corporate stores (store count reflects the sale of META’s Yonge St. location which closed on Sep 1, 2020) and 2 branded stores; (3) Based on High Tide and META Growth   9
 management estimates and representing the mid-point of estimated range; (4) Based on seven fully owned corporate retail stores; (5) Based on current locations authorized to open as reported by AGCO of September 15, 2020
CREATING THE LEADER IN CANADIAN CANNABIS RETAIL - HIGH TIDE TO COMBINE WITH META GROWTH
COMBINATION
OVERVIEW
HIGH TIDE – KEY HIGHLIGHTS                                                                                                                                                               ESTABLISHED IN ALL
                                                                                                                                                                                        DOWNSTREAM MARKETS
                                                 HITI realized gross margins of 40% in its latest quarter through its diverse
                                                 revenue opportunities each complementary to one another (i.e. cannabis retail
  Industry Leading

                                                                                                                                                                                    Retail
                                                 and accessories)
   Gross Margins                                 Average gross margin of publicly-traded cannabis retailers is approximately
                                                 33%(1)

                                                 Second consecutive quarter of record positive adjusted EBITDA of approx. $2.7
Delivering Positive                              million(2)

                                                                                                                                                                                    Wholesale
Adjusted EBITDA                                  HITI was the first publicly-traded Canadian cannabis retailer to achieve this
                                                 milestone metric and continues to lead its public peers in profitability

                                                 33 of 37 branded HITI retail stores have been built internally, demonstrating
    Ability to Grow
                                                 management’s operational excellence and ability to drive profitability through
     Organically                                 organic growth

                                                                                                                                                                                     Online
   Leading Ontario                               HITI has the most fully owned retail locations in the country’s largest market
     Store Count                                 (ON) with 5 stores.(3) In total, HITI has 7 branded locations in ON.(4)

Source: SEDAR filings
Note: (1) As of September 15, 2020, based on publicly-traded Canadian cannabis retailers (for Inner Spirit Holdings, only corporate owned retail store gross margins were included); (2) Net of lease liability payments; (3) Based on fully owned   11
corporate locations amongst publicly-traded peers; (4) Includes 5 fully owned corporate owned locations and 2 branded locations
M E TA G R O W T H – K E Y H I G H L I G H T S                                                                     UNIQUE RETAIL EXPERIENCES
                                                                                                                      ACROSS 4 PROVINCES
  A Leader in the

                                                                                                                    PREMIUM
                               One of the largest cannabis retailers in Canada by sales and store count with
Canadian Cannabis              $54.9 million in last quarter annualized sales(1) and 32 operating locations
   Retail Market
                                                                                                                                11 locations across MB, ON, SK

     Balance Sheet             $14.2 million in cash and equivalents(1) to support future growth initiatives and
       Strength                no significant debt maturities until November 30, 2022

                                                                                                                    VALUE
                                                                                                                                      21 locations in AB
     Differentiated
                               Operates two unique retail formats: META Cannabis Co., a high-end retail brand
     Brand & Retail            and NewLeaf Cannabis, a value-branded retail experience
      Experience

                                                                                                                    ANALYTICS
 Well Positioned to            Strong retail footprint and recently launched membership and rewards programs
  Leverage Data                provides robust data collection to drive operational efficiencies and additional
                               sales as well as produce proprietary analytics
     Analytics

Source: SEDAR filings
Note: (1) As of May 31, 2020                                                                                                                                     12
S I Z E A N D S C A L E F O R P R O F I TA B L E G R O W T H Pro Forma

                                                                                                                                                           +
                                                                                                                                                            +
Capitalization

                                Market Cap(1)                                                    $52.6 million                                                                                 $38.7 million(2)                                                $91.2 million(2)
  Current

                                    Liquidity(3)                                                 $12.7 million                                              +                                    $20.6 million                                                   $33.3 million

                             Enterprise Value                                                    $77.4 million                                              +                                    $59.1 million                                                  $136.5 million

                            Operating Stores                                                                 37                                             +                                               32                                                            62(5)
Operational
 Metrics

                            Ontario Locations                                                                 7                                             +                                                 2                                                               9

                  Accessories + CBD Online
                                                                                                                                                           +                                                                                                             
                                                                                                                                                            +
LQ Annualized

                                     Revenue                                                     $92.8 million                                                                                   $54.9 million                                                  $147.7 million
 Financials(4)

                        Gross Profit / Margin                                             $36.9 million / 40%                                               +                             $19.8 million / 36%                                             $56.7 million / 38%

                        Adj. EBITDA / Margin                                            $10.8 million(6) / 12%                                              +                          $(0.8) million(7) / (NM)                                           $18.4 million / 12%
                                                                                                                                                                                                                                                               Incl. Est. Cost Synergies

 Notes: (1) Market capitalization calculated on a fully diluted in-the-money basis using the treasury stock method; (2) META and pro forma capitalization based on High Tide closing share price as of August 20, 2020 and exchange ratio of 0.824; (3) Includes cash & cash equivalents and debt
 available to drawdown as of August 17, 2020 before transaction costs; (4) LQ (last quarter) Annualized Financials based on latest reported quarter for each company (High Tide – July 31, 2020; META Growth – May 31, 2020) after taking into effect estimated cost synergies; (5) Represents pro               13
 forma store count post store optimizations / closures and is inclusive of locations related to transactions that have yet to close including META’s acquisition of its Kitchener location and HITI’s divestiture of its KushBar locations; (6) Net of lease liability payments; (7) Refer to Appendix A for a
 reconciliation of net loss from continuing operations to adjusted EBITDA
L AY I N G O U T A C L E A R PAT H TO P R O F I TA B I L I T Y
Annual cost and operational synergies of approx. $8 million to $9 million expected within 12 months of
transaction closing
Last Quarter Annualized Pro Forma Adj. EBITDA Bridge ($mm)                                                                                                                                1 Store Optimization + Leases
                                                                                                            Synergies                                                                           HITI and META to close or sell select
  $ Increase          $ Total
                                                                                                                                                                                                retail locations and immediately realize
                                                                                                                                                                                                cost savings.
                                                                                                                                  2
                                                                                                                               +$4.5                                                            Termination of several dark leases on
                                                                                                                                                            $18.4
                                                                                                     1                                                                                          locations that are no longer deemed
                                                                                                                                                                                                attractive given changing competitive
                                                                                                  +$3.8
                                                                                                                                                                                                environment.
                                        +$10.8                       $10.0
                                                                                                                                                                                          2 Overhead SG&A and Other
                                                                                                            +$8 to $9                                                                           Elimination of redundant corporate
                                                                                                             million                                                                            overhead costs including but not limited
                                                                                                                                                                                                to corporate payroll, public company
                                                                                                                                                                                                costs, HQ lease, etc.
           ($0.8)

          META (2)                      HITI                      Pro Forma               Store Optimization            Overhead SG&A                   Pro Forma                          Synergies exclude anticipated
       Adj. EBITDA                  Adj. EBITDA(3)
                                    Contribution
                                                                 Adj. EBITDA
                                                                Pre-Synergies
                                                                                              + Leases                    and Other                    Adj. EBITDA
                                                                                                                                                      Incl. Synergies
                                                                                                                                                                                         impact of significant cross-selling
                                                                                                                                                                                                   opportunities
                          Last Quarter Annualized(1)

Notes: (1) Represents META’s latest reported quarter as of May 31, 2020 and HITI’s latest reported quarter as of July 31, 2020, both annualized; (2) Refer to Appendix A for a reconciliation of net loss from continuing operations to
adjusted EBITDA; (3) Represents adjusted EBITDA net of lease liability payments
                                                                                                                                                                                                                                          14
BENCHMARKING AGAINST PEERS
 Enterprise Value(1) ($mm) and Enterprise Value / Store

                                                                                                    EV                                    EV / Store
$330.0
                      3.9x
$300.0
                                                                                                                                                                                                                                                3.0x

                                                       2.2x                                                                                                 2.4x
                                                                                         2.1x
$270.0

$240.0

$210.0
                    $204.5                                                                                                1.7x
                                                                                                                                                                                                                                                2.0x

                                                               (2)                                                                                                                                                             0.7x
                                                                                                                                                                                                                                                1.0x

                                                                                                                                                                                             0.6x
                                                     $136.5
$180.0

$150.0
                                                                                                                                                                                                                                                0.0x

                                                                                       $77.4
$120.0

                                                                                                                                                                   (3)
                                                                                                                         $54.1                            $44.1
                                                                                                                                                                                                                                                -1.0x

                                                                                                                                                                                            $33.8
 $90.0

                                                                                                                                                                                                                             $11.9
 $60.0

                                                                                                                                                                                                                                                -2.0x

 $30.0

    −                                                                                                                                                                                                                                           -3.0x

 Enterprise Value / Last Quarter Annualized Revenue
                                                                                                                                                           5.0x

                     1.8x                                                                                                                                                                    1.6x
                                                       0.9x                             0.8x                              1.0x                                                                                                0.6x
  0.0x

         Sources: Company filings, press releases
         Notes: As of September 15, 2020; (1) Figures presented on a fully diluted basis (TSM method); (2) Pro forma capitalization based on High Tide closing share price as of September 15, 2020 and the exchange ratio of 0.824; (3) Does
                                                                                                                                                                                                                                                        15
         not include impact of pending acquisition of Phivida Holdings Inc.
STRENGTHENED BALANCE SHEET AND INCREASED
C A P I TA L M A R K E T S P R O F I L E TO S U P P O R T G R O W T H

                                                                                                                                                                                                   +
High Tide Restructures $10.8 Million of Debt                                                  Amendment and Extension of META                                                       Increased Capital Markets Profile
  Into Interest Free Debenture Due in 2025                                                        Convertible Debentures                                                                  & Access To Capital
   •    Extends maturity on $10.8 million of debt by                                      •    Holders of over 66 2/3% of META’s $21.2                                       •    Estimated ~$21 million in cash          and
        over four years, from December 2020 to                                                 million principal amount of convertible                                            equivalents at Transaction closing(1)
        January 2025                                                                           debentures have agreed to extend the
                                                                                                                                                                             •    Combining the High Tide and META Growth
                                                                                               maturity date by 12 months to November
   •    Bolsters financial position by removing                                                                                                                                   platforms will create a dominant player in
                                                                                               30, 2022
        interest on the debt over the four-year                                                                                                                                   the Canadian cannabis retail market and
        period – ~$0.9 million in annual savings to                                                                                                                               enhance capital markets presence
        the bottom-line

  Recent restructuring and extension of $34 million(1) in combined debt, ~$21 million in cash(2) and a significant
capital markets profile positions the combined entity well to maintain and build upon its market leadership position
Note: (1) Includes High Tide’s recent announcement on September 14, 2020 extending the term of its $2.0 million loan; (2) Cash & cash equivalents before transaction costs as of August 17, 2020
                                                                                                                                                                                                                          16
I N D U S T RY- L E A D I N G R E TA I L P O R T F O L I O

                                                             17
C O M B I N E D D ATA A N D A N A LY T I C S P L AT F O R M
                                                              Over 65,000 pro forma members on the
                                                                        combined platform

                 57k                  50%+                     Database communicates with targeted
                                     of total transactions
                                                             consumers who are segmented at the local
                 Members                 completed by
                                           members            level by delivering regular content that is
                                                                       specific to their location

                                                              Members receive email communications

                           8.5k                               highlighting new and upcoming product
                                                              arrivals, member-only events, and other
                                                                            special offers
                           Members
                                                             Allows for direct yet compliant marketing to
                                                                        drive additional sales.

                                                                                                            18
LEVERAGING OUR DIVERSIFIED BUSINESS
                                          WHOLESALE                                                                      ONLINE

                                        Manufacturer and distributor of smoking                                Grasscity.com is a major e-retailer of smoking
                                      accessories and cannabis lifestyle products                               accessories and cannabis lifestyle products

   House Brands                      Other Brands
                                                               • +10 years of operations
                                                                                            • +7.0 million US site visits per year
                                                                • +5,000 SKUs (+75%
                                                                                           • +800,000 customers in the database
                                                                 manufactured in-house)

                                         Global manufacturer and distributor of
                                                                                                                  Launched in May 2020, CBDcity.com is an
                                      celebrity-licensed smoking accessories and
                                                                                                                       online store for CBD products
                                               cannabis lifestyle products

      • Celebrity licenses with Snoop Dogg                                                                            • Showcases carefully curated CBD brands
      Pounds, Cheech & Chong’s Up in Smoke,                                                                                     from the US and EU
            Trailer Park Boys and more
                                                                                                                     • The global CBD market is expected to grow
       • Large US customer base and a key                                                                              at a CAGR of ~32% over the next five years
                supplier to the OCS                                                                                        and will reach US$1.3 billion in 2024

Source: MarketWatch – Global Cannabidiol (CBD) Market Report
                                                                                                                                                                    19
A P P E N D I X A – A D J . E B I T D A R E C O N C I L I AT I O N ( M E TA )
                                      Three Months
                                         Ended
                                       31-May-20
Net loss from continuing operations   ($22,632,560)
  Deferred tax recovery               ($1,040,022)
  Accretion and interest expense       $1,608,130
  Depreciation                         $1,491,964
EBITDA                                ($20,572,488)
  Impairment loss                     $22,134,025
  Loss on disposal of assets            $18,186
  Gain on investment                  ($1,122,544)
  Share-based compensation              $118,468
  Loss on lease termination              $4,399
  Transaction and acquisition costs     $230,911
  Lease liability payments            ($1,010,748)
Adjusted EBITDA                        ($199,791)

Source: SEDAR filings
                                                                                20
THANK YOU

            21
You can also read