COVID-19 Mortality Prediction From Deep Learning in a Large Multistate Electronic Health Record and Laboratory Information System Data Set: ...
←
→
Page content transcription
If your browser does not render page correctly, please read the page content below
JOURNAL OF MEDICAL INTERNET RESEARCH                                                                               Sankaranarayanan et al

     Original Paper

     COVID-19 Mortality Prediction From Deep Learning in a Large
     Multistate Electronic Health Record and Laboratory Information
     System Data Set: Algorithm Development and Validation

     Saranya Sankaranarayanan*, MS; Jagadheshwar Balan*, MS; Jesse R Walsh, PhD; Yanhong Wu, PhD; Sara Minnich,
     BA; Amy Piazza, MLS; Collin Osborne, MS; Gavin R Oliver, MS; Jessica Lesko, MA; Kathy L Bates, MBA; Kia
     Khezeli, PhD; Darci R Block, PhD; Margaret DiGuardo, MD; Justin Kreuter, MD; John C O’Horo, MPH, MD; John
     Kalantari, PhD; Eric W Klee, PhD; Mohamed E Salama, MD; Benjamin Kipp, PhD; William G Morice, MD, PhD;
     Garrett Jenkinson, PhD
     Mayo Clinic, Rochester, MN, United States
     *
      these authors contributed equally

     Corresponding Author:
     Garrett Jenkinson, PhD
     Mayo Clinic
     200 1st St SW
     Rochester, MN, 55905
     United States
     Phone: 1 507 293 9457
     Email: Jenkinson.William@mayo.edu

     Abstract
     Background: COVID-19 is caused by the SARS-CoV-2 virus and has strikingly heterogeneous clinical manifestations, with
     most individuals contracting mild disease but a substantial minority experiencing fulminant cardiopulmonary symptoms or death.
     The clinical covariates and the laboratory tests performed on a patient provide robust statistics to guide clinical treatment. Deep
     learning approaches on a data set of this nature enable patient stratification and provide methods to guide clinical treatment.
     Objective: Here, we report on the development and prospective validation of a state-of-the-art machine learning model to
     provide mortality prediction shortly after confirmation of SARS-CoV-2 infection in the Mayo Clinic patient population.
     Methods: We retrospectively constructed one of the largest reported and most geographically diverse laboratory information
     system and electronic health record of COVID-19 data sets in the published literature, which included 11,807 patients residing
     in 41 states of the United States of America and treated at medical sites across 5 states in 3 time zones. Traditional machine
     learning models were evaluated independently as well as in a stacked learner approach by using AutoGluon, and various recurrent
     neural network architectures were considered. The traditional machine learning models were implemented using the
     AutoGluon-Tabular framework, whereas the recurrent neural networks utilized the TensorFlow Keras framework. We trained
     these models to operate solely using routine laboratory measurements and clinical covariates available within 72 hours of a
     patient’s first positive COVID-19 nucleic acid test result.
     Results: The GRU-D recurrent neural network achieved peak cross-validation performance with 0.938 (SE 0.004) as the area
     under the receiver operating characteristic (AUROC) curve. This model retained strong performance by reducing the follow-up
     time to 12 hours (0.916 [SE 0.005] AUROC), and the leave-one-out feature importance analysis indicated that the most
     independently valuable features were age, Charlson comorbidity index, minimum oxygen saturation, fibrinogen level, and serum
     iron level. In the prospective testing cohort, this model provided an AUROC of 0.901 and a statistically significant difference in
     survival (P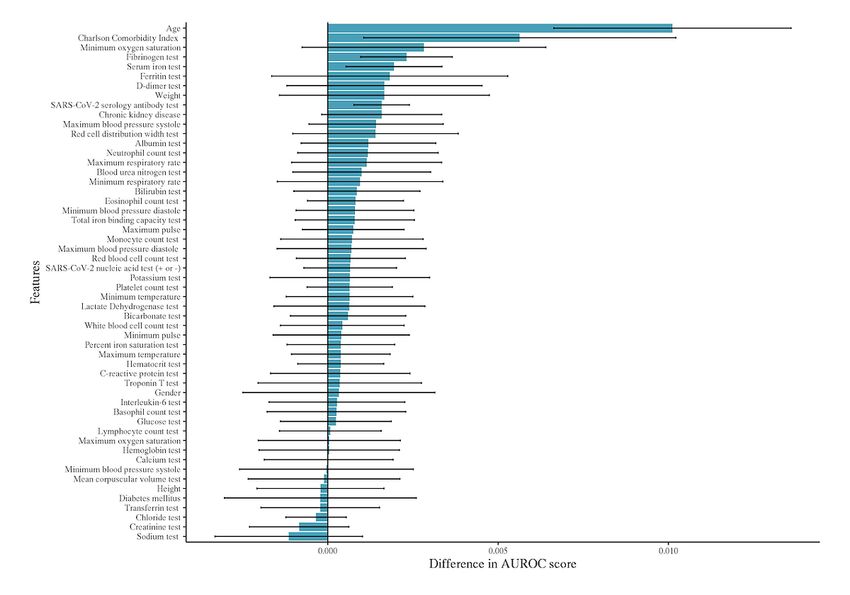
JOURNAL OF MEDICAL INTERNET RESEARCH                                                                                  Sankaranarayanan et al

     KEYWORDS
     COVID-19; mortality; prediction; recurrent neural networks; missing data; time series; deep learning; machine learning; neural
     network; electronic health record; EHR; algorithm; development; validation

                                                                            to date. We report the successful development and validation
     Introduction                                                           of a state-of-the-art ML model to provide mortality prediction
     COVID-19 is caused by the SARS-CoV-2 virus and is suspected            shortly after confirmation of SARS-CoV-2 infection in this
     to be of zoonotic origin, with spillover from bats or pangolins        Mayo Clinic patient population and discuss in detail the various
     into humans in Wuhan, China [1,2]. COVID-19 has become                 logistical and scientific challenges involved in the early
     one of the largest public health emergencies of the past century       deployment of such a system in a rapidly changing pandemic
     with over 203 million confirmed cases and 4.3 million deaths           environment.
     as of August 2021 according to the World Health Organization
     [3]. The COVID-19 pandemic has overwhelmed global medical              Methods
     supply chains, hospitals, and economies, which has led
     governments to respond with varying policies, including mask
                                                                            Study Design
     mandates and travel restrictions [4,5]. At times, hospitals and        This work required the development of a data set and the
     health care workers have become so overburdened with patients          subsequent modeling of the resultant cohort. After data
     with COVID-19 that they have been forced to ration care, raising       collection and cleaning, 2 broad classes of algorithms were
     logistical and ethical concerns [6].                                   considered to model this data. The first approach ignores the
                                                                            time series nature of the underlying data and applies traditional
     The clinical course of COVID-19 is diverse with most                   ML classifiers. The second approach explicitly models the time
     individuals experiencing mild or asymptomatic disease, but             series data while dealing with the missing-not-at-random
     many patients develop life-threatening diseases, including             (MNAR) values by using specialized recurrent neural networks
     features such as cytokine storms, thrombotic complications, or         (RNNs). Both types of modeling methods were run
     severe acute respiratory syndrome requiring mechanical                 independently and compared using cross-validation, and a single
     ventilation or extracorporeal membrane oxygenation [7]. A              winning model was selected for prospective performance
     major medical challenge is therefore to reliably triage patients       validation.
     according to their risk for severe disease. Age is consistently
     observed to be a predominant risk factor for severe disease [7],       EHR and Laboratory Information System
     but deaths are not limited to older adults and the majority of         Observational Cohort Data Collection
     older patients survive COVID-19 [7]. Other comorbidities and           This study adheres to a research protocol approved by the Mayo
     laboratory test values are expected to be capable of further           Clinic Institutional Review Board. Data were retrospectively
     individualizing and enhancing mortality prediction. Recent             collected after March 1, 2020 on COVID-19–positive
     studies investigating statistical and machine learning (ML)            individuals presenting to a Mayo Clinic site or health system,
     models for mortality prediction have confirmed that detailed           while excluding patients without research consent or from
     evaluation of medical records can facilitate further stratification    European Union countries covered by the general data protection
     of patients [8-12].                                                    regulation law. We restricted our focus to 11,807 patients with
     A systematic review of 147 published or preprint prediction            a positive COVID-19 nucleic acid test result on or before
     models found consistent problems with inherent biases in the           January 27, 2021 and at least one non-COVID test result.
     data sets investigated or created in all such studies, ultimately      Although the data collection system is deployed and ongoing,
     concluding that “we do not recommend any of these reported             the January cutoff was selected for this study to provide
     prediction models for use in current practice” [12]. Clinical          sufficient cohort size while allowing a minimum of 3 weeks of
     practices differ in the nature of their observational electronic       follow-up to accurately establish survival status. Mayo Clinic’s
     health record (EHR) data set, patient population, clinical             EHR and laboratory information system (LIS) contain data from
     practices, and electronic record or laboratory ordering practices.     each of its 3 campuses (Rochester, Minnesota; Jacksonville,
     Correspondingly, the literature review conducted at the outset         Florida; Scottsdale, Arizona) as well as the surrounding health
     of this study indicated that the existing prediction models were       system sites spanning 5 states (MN, IA, WI, FL, and AZ).
     likely unsuited to our clinical setting without essentially starting   Although the EHR contains clinically reportable laboratory
     afresh by retraining, validating, and testing predictions.             results, many of these can only be reported within defined
                                                                            ranges, which can result in qualitative text values rather than
     We describe Mayo Clinic’s experience assembling, what is to            the raw numeric measurements. Because many ML algorithms
     our knowledge, the largest reported COVID-19 database for              typically work better with quantitative rather than qualitative
     mortality prediction and using this database to create a system        results, we used the LIS to gather such laboratory testing
     for COVID-19 mortality prediction, tailored to a unique patient        measurements and the EHR to gather the remaining variables.
     population. Despite the biases inherent to it, because this large      The EHR data were queried from an underlying Db2 database
     and growing database represents a health care system spanning          (IBM Corp), and the LIS data were queried from an SQL
     5 states and 3 time zones over a study window greater than 11          database (Microsoft).
     months, our model is expected to be the least confounded and
     the most generalized COVID-19 mortality predictor published

     https://www.jmir.org/2021/9/e30157                                                              J Med Internet Res 2021 | vol. 23 | iss. 9 | e30157 | p. 2
                                                                                                                   (page number not for citation purposes)
XSL• FO
RenderX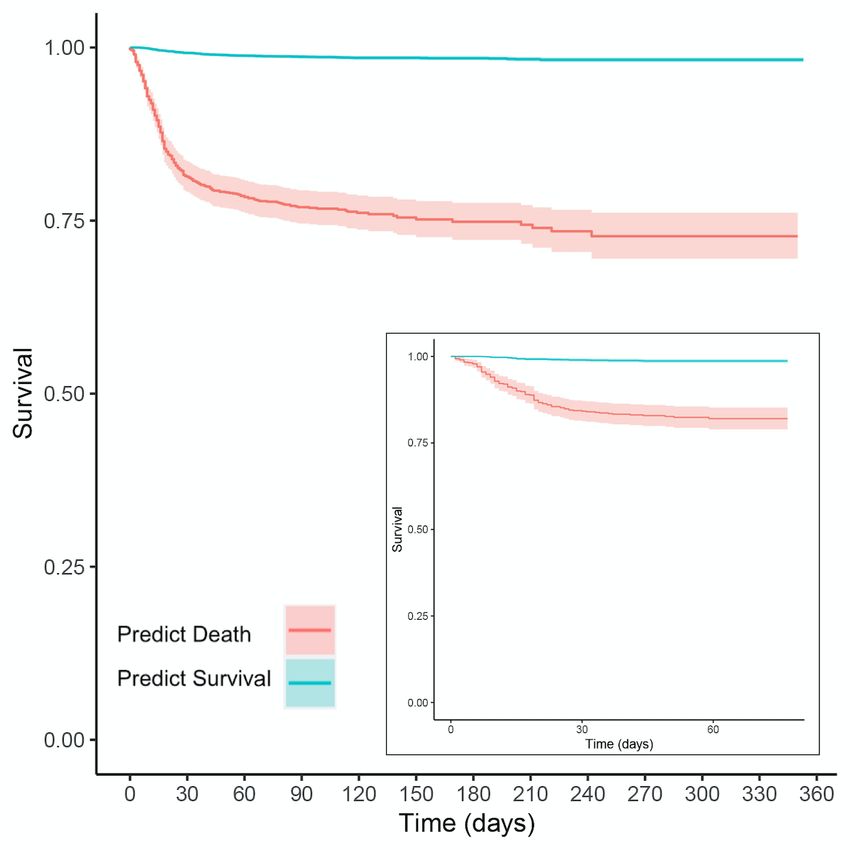
JOURNAL OF MEDICAL INTERNET RESEARCH                                                                                Sankaranarayanan et al

     Multivariate Time-Series Data With Missingness                       acknowledging that these variables conflate missingness with
     The clinical covariates collected were age, sex, height, weight,     lack of a condition.
     Charlson comorbidity score, temperature, blood pressure,             Clinical covariates such as pre-existing conditions, height, and
     respiratory rate, oxygen saturation (SpO2) levels, and diagnoses     weight were sampled infrequently, whereas heart rate and SpO2
     of chronic kidney disease or diabetes mellitus. Furthermore, we      were recorded every 15 minutes for inpatients in our EHR, and
     included laboratory test values from a basic metabolic panel,        other laboratory tests were intermediate in terms of frequency.
     complete blood counts, and some less routine test results of         Therefore, to deal with these multiscale time series
     relevance to COVID-19, as determined by scientific literature        measurements, we used the laboratory measurements as the
     and physician collaborators. Table 1 details the features collated   starting point to define our sampling time points. For the
     into our database. In Multimedia Appendix 1, we provide a            variables of sex, age, weight, height, diabetes mellitus, chronic
     detailed breakdown of these clinical covariates and laboratory       kidney disease, and Charlson comorbidity index, we encoded
     values in our cohort (Table S1 of Multimedia Appendix 1) as          these variables to exist at the first time point only; in our top
     well as the cohort’s geographic distribution (Figure S1 of           performing RNN models, we observed no difference in
     Multimedia Appendix 1). Differentiating between missing data         performance using this strategy when compared to repeating
     and absence of a condition is not possible from EHR diagnostic       the observations at each time point. For the frequently observed
     codes, particularly for patients treated in an outpatient setting.   variables of blood pressure systole, blood pressure diastole,
     Therefore, we focused mainly on the Charlson comorbidity             temperature, pulse, respiratory rate, and SpO2, we computed
     index [13], which is populated in our EHR when there is a            the minimum and maximum measurements for each calendar
     recorded medical history during a “patient encounter” in the         day and appended these to each laboratory time point during
     EHR. Thus, this variable is available and can be assigned a          those dates; if no laboratory time point existed on a given day,
     value corresponding to no comorbidities, which is distinct from      we created a new one at noon using these minimum and
     missingness in the case of no recorded medical history in the        maximum values. We considered time points within ±72 hours
     EHR. However, owing to their emphasis within the literature,         of each patient’s first positive polymerase chain reaction (PCR)
     we also included chronic kidney disease [9] and diabetes             result and performed a sensitivity analysis on the length of the
     mellitus [14] as independent comorbidity variables using their       patient follow-up after this positive test result.
     ICD-10 (International Classification of Diseases) codes while

     https://www.jmir.org/2021/9/e30157                                                            J Med Internet Res 2021 | vol. 23 | iss. 9 | e30157 | p. 3
                                                                                                                 (page number not for citation purposes)
XSL• FO
RenderX
JOURNAL OF MEDICAL INTERNET RESEARCH Sankaranarayanan et al
Table 1. Feature measurements collected.
Abbreviation Description (units or levels)
sex Sex (male or female)
age Age at time of polymerase chain reaction–positive test result (years)
weight Weight (kg)
height Height (cm)
PCR SARS-CoV-2 nucleic acid test (+ or –)
SERO SARS-CoV-2 serology antibody test (+ or –)
BASAA Basophil count test (109/L)
EOSAA Eosinophil count test (109/L)
HCT Hematocrit test (%)
HGB Hemoglobin test (g/dL)
LYMAA Lymphocyte count test (109/L)
MCV Mean corpuscular volume test (fL)
MONAA Monocyte count test (109/L)
NEUAA Neutrophil count test (109/L)
PLTC Platelet count test (109/L)
RBC Red blood cell count test (1012/L)
RDW Red cell distribution width test (%)
WBC White blood cell count test (109/L)
CRP C-reactive protein test (mg/L)
D-DIMER D-dimer test (ng/mL)
FERR Ferritin test (mg/L)
IL6 Interleukin-6 test (pg/mL)
TRPS Troponin T test (ng/L)
FIBTP Fibrinogen test (mg/dL)
LD Lactate dehydrogenase test (U/L)
IRON Serum iron test (mg/dL)
TIBC Total iron binding capacity test (mg/dL)
SAT Percent iron saturation test (%)
TRSFC Transferrin test (mg/dL)
BUN Blood urea nitrogen test (mg/dL)
CHL Chloride test (mmol/L)
GLU Glucose test (mg/dL)
CALC Calcium test (mg/dL)
CREA Creatinine test (mg/dL)
POTA Potassium test (mmol/L)
ALB Albumin test (g/dL)
BICA Bicarbonate test (mmol/L)
SODI Sodium test (mmol/L)
BILI Bilirubin test (mg/dL)
BPsystole Blood pressure systole (mm Hg)
https://www.jmir.org/2021/9/e30157 J Med Internet Res 2021 | vol. 23 | iss. 9 | e30157 | p. 4
(page number not for citation purposes)
XSL• FO
RenderXJOURNAL OF MEDICAL INTERNET RESEARCH Sankaranarayanan et al
Abbreviation Description (units or levels)
BPdiastole Blood pressure diastole (mm Hg)
Temp Temperature (°C)
Pulse Heart rate (1/min)
Resp Respiratory rate (1/min)
SpO2 Oxygen saturation (%)
Charlson Charlson comorbidity index (10-year survival probability)
CKD Chronic kidney disease (+ or –)
DM Diabetes mellitus (+ or –)
the last observation carried forward modeling, since proper
Time-Flattened ML Models modeling efforts should account for the time series structure in
Time series data were flattened/encoded to a fixed length list the EHR data. We next look at models of this form.
of features by carry forward imputation (ie, selection of the
most recently observed covariate values), ensuring compatibility RNN Time Series Models
with traditional ML models. Specifically, after the data are As the second approach, we implemented the modified gated
flattened in this fashion, it forms a tabular prediction task recurrent unit (GRU) binary classification models proposed by
suitable for any canonical supervised classification algorithm. Che et al [16] that are capable of accounting for the MNAR
The recently published [15] Python-based automated ML tool patterns within EHR data, and we adopt their notation. For a
AutoGluon-Tabular (v0.2.0) was utilized to enable standardized given patient, we have D = 54 variables and a given time series
and reproducible ensemble stacking of many model classes (eg, of T time points can be represented as a T × D matrix X whose
deep neural networks, LightGBM boosted trees, CatBoost
rows xt ∈ D, t= 1, . . . , T represent the t-th observation with
boosted trees, Random Forests, Extremely Randomized Trees,
XGBoost, and k-Nearest Neighbors). D variables , d = 1, . . . , D. Accompanying each observation
AutoGluon-Tabular models were fit to our tabular data frames xt is a time stamp st ∈ , which starts at time 0, s1 = 0 and a
using the “AutoGluon.TabularPrediction.fit” function using all
binary masking vector mt ∈ {0, 1}D with taking value 1
the default parameters except eval_metric='roc_auc'. After
running the fit function, access to each individual model created when is observed and 0 otherwise. From these values, we
by AutoGluon was achieved by the “get_model_names” method can compute the time intervals.
on the resulting prediction object. This then allowed us to pass
the specified model to the “predict_proba” method’s optional
“model” argument for each of the following model types:
KNeighborsUnif, KNeighborsDist, NeuralNetFastAI,
LightGBMLarge, NeuralNetMXNet, RandomForestGini,
ExtraTreesGini, RandomForestEntr, ExtraTreesEntr, LightGBM, With these definitions, we can look at various modifications to
XGBoost, LightGBMXT, CatBoost, WeightedEnsemble_L2. the standard GRU architecture whose j-th hidden unit has a reset
Hereon, we refer to WeightedEnsemble_L2 as the “AutoGluon”
model since this was the output of the “predict_proba” method gate and update gate with hidden state at time t and
when no single model type was specified. update the equations.
For relatively static features such as height, weight, or Charlson
comorbidity index, we would expect the time-flattened models
to be at no disadvantage, whereas the more frequently measured
data such as laboratory values or blood pressure will lose
information, particularly about trends in the covariates. For
instance, 2 individuals with a fever of 39°C recorded in the most With matrices Wz, Wr, W, Uz, Ur,U and vectors bz, br, b
recent observation would be treated the same even if one had a composed of model parameters, ⊙ is the Hadamard product,
sustained high fever and the other had a brief downward trending and σ(·) is the elementwise sigmoid function. Before modifying
spike. Of course, there are many potential degrees of freedom the architecture, there are 3 methods to use the GRU above to
to capture more information in the flattened data; one could handle missing data: in “GRU-Mean,” missing values are
define a fixed number of the most recent observations or fit a imputed by their means in the training data; in “GRU-Forward,”
line through the observations over time and pass the slope and missing values are imputed by their last observed value; and in
intercept as features to the classifier. However, ultimately, the “GRU-Simple,” we simply concatenate the xt, mt, and δt
choice to flatten the time series is a choice of convenience and variables into a single observation vector x ‘t and pass this
one that attempts to leverage the extensive research efforts through the GRU equations above. The GRU-D method uses
devoted to tabular prediction, and therefore, we study here only trainable decay weights.
https://www.jmir.org/2021/9/e30157 J Med Internet Res 2021 | vol. 23 | iss. 9 | e30157 | p. 5
(page number not for citation purposes)
XSL• FO
RenderXJOURNAL OF MEDICAL INTERNET RESEARCH Sankaranarayanan et al
(version 2.1.0) and numpy (version 1.19.2) used in our
high-performance computing cluster environment. We selected
the specific RNN algorithm by setting the “--model“ argument
With Wγ and bγ being trainable model parameters. The
to be “GRUforward,” “GRU0,” “GRUsimple,” and “GRUD”
observations are then replaced by the update. for GRU-forward, GRU-mean, GRU-simple, and GRU-D,
respectively. We utilized the default hyperparameters of the
algorithm; however, in our testing, we found that increasing the
batch size from 32 to 256 facilitated faster training of the
where is the last observed value of the d-th variable and algorithms. Therefore, a batch size of 256 is the only nondefault
is the empirical mean of the d-th variable in the training data. hyperparameter selection made in our implementation of the
The modified GRU update equations for GRU-D become the RNN algorithms.
following.
Temporal Cohort Split
As depicted in the CONSORT (Consolidated Standards of
Reporting Trials) diagram of Figure 1, patients who first tested
positive for COVID-19 from March 1, 2020 through December
15, 2020 (9435/11,807, 79.9%) were assigned to a model
selection cohort, whereas patients who first tested positive for
COVID-19 from December 16, 2020 through January 27, 2021
(2372/11,807, 20.1%) were used as a prospective testing cohort
where Vz, Vr, V are new model parameters to directly handle for the final algorithm. All experiments in the model selection
the masking vector mt in the model. cohort were performed using an identical 10-fold stratified
cross-validation using binary classification with the positive
Our implementation of the above equations in Python is a class defined as death within 21 days of the first positive PCR
slightly modified version of the code available on the GRU-D test result. Only the single best performing model was evaluated
paper’s [16] GitHub repository. For the core RNN algorithms, on the prospective cohort after being fit against the entire model
we only edited the original GRU-D code, where required, to be selection cohort.
compatible with the more recent versions of tensorflow.keras
Figure 1. CONSORT (Consolidated Standards of Reporting Trials) diagram demonstrating the temporal split of our cohort for model selection and
prospective validation.
the findings of Che et al [16], discovering that the GRU-D model
Results has the highest average cross-validation AUROC curve among
Model Selection all other standard variants of GRU modeling in time series with
missing values. In addition, GRU-Simple has higher average
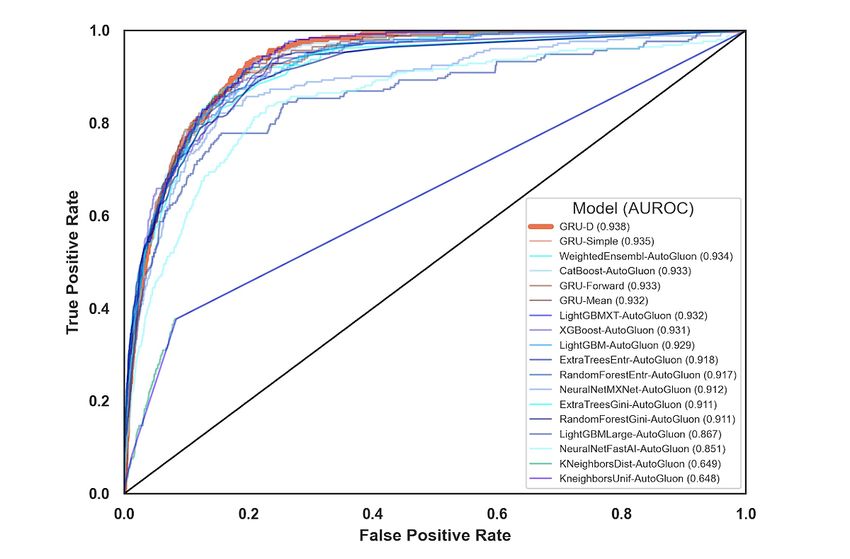
In Figure 2 and Table 2, we compared the results of our various cross-validation AUROC curve than the GRU-Forward and
models by using cross-validation area under the receiver GRU-Mean, and the most notable difference underlying these
operator characteristic (AUROC) curve in the training cohort. categories is the inclusion of missingness indicators as features
Although not in a statistically significant way, we recapitulated to GRU-Simple, which could indicate the value of MNAR
https://www.jmir.org/2021/9/e30157 J Med Internet Res 2021 | vol. 23 | iss. 9 | e30157 | p. 6
(page number not for citation purposes)
XSL• FO
RenderXJOURNAL OF MEDICAL INTERNET RESEARCH Sankaranarayanan et al
patterns in the classification task. GRU-D’s biologically inspired AutoGluon, each method’s performance fell within the other’s
architecture attempts to make even more efficient use of this standard error intervals. AutoGluon’s automated hyperparameter
information and exceeds the performance of all the tested RNN tuning and model stacking may indicate that GRU-D could
methods. AutoGluon, which only had access to the last benefit from the addition of hyperparameter search. However,
measurement of each variable, showed strong performance this process may risk overfitting this cross-validation data set,
despite this limitation. In Table 2, each individual AutoGluon and thus, we selected GRU-D with the default settings rather
model was also benchmarked (those with suffix “-AutoGluon”), than attempting to further improve the cross-validation AUROC
along with the final ensemble estimate (labeled simply as curve via hyperparameter optimization.
“AutoGluon”). Although GRU-D ultimately outranked
Figure 2. Receiver operating characteristic curves for the 18 models evaluated. AUROC: area under the receiver operating characteristic.
https://www.jmir.org/2021/9/e30157 J Med Internet Res 2021 | vol. 23 | iss. 9 | e30157 | p. 7
(page number not for citation purposes)
XSL• FO
RenderXJOURNAL OF MEDICAL INTERNET RESEARCH Sankaranarayanan et al
Table 2. Modeling results sorted by performance.
Model Area under the receiver operator characteristic curve (SE)
KNeighborsUnif-AutoGluon 0.648 (0.011)
KNeighborsDist-AutoGluon 0.649 (0.011)
NeuralNetFastAI-AutoGluon 0.858 (0.013)
LightGBMLarge-AutoGluon 0.867 (0.014)
NeuralNetMXNet-AutoGluon 0.907 (0.008)
RandomForestGini-AutoGluon 0.911 (0.007)
ExtraTreesGini-AutoGluon 0.911 (0.009)
RandomForestEntr-AutoGluon 0.917 (0.008)
ExtraTreesEntr-AutoGluon 0.918 (0.007)
LightGBM-AutoGluon 0.929 (0.007)
XGBoost-AutoGluon 0.931 (0.006)
LightGBMXT-AutoGluon 0.931 (0.005)
GRU-Mean 0.932 (0.005)
GRU-Forward 0.933 (0.006)
CatBoost-AutoGluon 0.933 (0.005)
AutoGluon 0.934 (0.005)
GRU-Simple 0.935 (0.004)
GRU-D 0.938 (0.004)
12, 24, 48, and 72 hours of follow-up after the first positive
Length of Time Series PCR test result. The results in Table 3 demonstrate that although
Clearly, we would expect availability of more time series data we lose performance when predicting earlier in the patient’s
to result in improved model performance. To determine if disease, we are still able to provide accurate predictions even
predictions could be made utilizing data prior to 72 hours of a using data within the same day (12 hours of follow-up) that a
patient’s first positive PCR test result, we assessed the patient tests positive for COVID.
performance of GRU-D when we restricted the time series to
Table 3. GRU-D performance versus length of time series.
Follow-up after positive finding for polymerase chain reaction Area under the receiver operator characteristic curve (SE)
12 h 0.916 (0.005)
24 h 0.919 (0.006)
48 h 0.925 (0.005)
72 h 0.938 (0.004)
experiment omitting the laboratory values entirely, which
MNAR as an Asset and Feature Importance produced a lower AUROC of 0.890 (0.006). Therefore, the
To demonstrate the fact that MNAR data can improve model missing patterns alone contributed 0.014 to the AUROC. To
predictions by GRU-D, we generated a synthetic data set with contextualize this finding, we dropped each feature individually
laboratory test values replaced by Bernoulli coin flips. from the model, assessed the decrease in the AUROC score,
Therefore, the only valuable information contained within this and summarized the top 10 features in the decreasing order of
data set’s laboratory values is the missing data patterns that can the difference in the AUROC score (Figure 3). We note here
be viewed as encoding clinical suspicion or concern. For that the drop due to missing patterns exceeds the drop due to
instance, the D-dimer laboratory value is ordered less frequently removing any single variable from the analysis, making the
than other tests, and therefore, its presence alone can be MNAR pattern one of the most valuable pieces of information
informative of clinical concern for thrombotic events. Our results available to GRU-D. In Multimedia Appendix 1, we show a
found that randomizing the laboratory values resulted in an detailed error analysis of our model using these top 10 features.
AUROC curve of 0.904 (0.006), which indicates that the The fact that age and Charlson comorbidity index are the most
laboratory values in aggregate contributed 0.034 to the AUROC significant contributors to mortality prediction is consistent with
score (since this is the drop in performance compared to the the well-known risk factors for COVID mortality. The findings
model with actual laboratory values). We ran a further
https://www.jmir.org/2021/9/e30157 J Med Internet Res 2021 | vol. 23 | iss. 9 | e30157 | p. 8
(page number not for citation purposes)
XSL• FO
RenderXJOURNAL OF MEDICAL INTERNET RESEARCH Sankaranarayanan et al
of the fibrinogen test, serum iron test, and ferritin test were the indicating that BMI may not be as effective as weight itself in
3 most important laboratory values in our models. The presence mortality prediction. However, a limitation of this
of chronic kidney disease, weight, serology test, and SpO2 were drop-one-feature variable importance is that a low-ranking
the clinical covariates that also ranked in the top 10 variables feature such as height cannot be said to be irrelevant, just that
by importance. Interestingly, height had low importance, any information it carries is redundant within other features.
Figure 3. Feature importance in the GRU-D recurrent neural network model as defined by the average drop in the area under the receiver operator
characteristic curve (with 95% CI) when each feature is individually removed from the analysis. The top 5 features are seen to be age, Charlson
comorbidity index, minimum oxygen saturation, fibrinogen levels, and serum iron levels. AUROC: area under the receiver operator characteristic.
of 85% (95% CI 77%-91%), precision of 14% (95% CI
Prospective Validation and Survival Analysis 12%-17%), and a negative predictive value of 99% (95% CI
To demonstrate the efficacy of our proposed mortality 99%-100%).
prediction, we performed a Kaplan-Meier analysis using the
survival R library [17]. Specifically, we chose a decision Our Kaplan-Meier analysis results in Figure 4 demonstrate the
boundary on the GRU-D model’s ROC curve, which provided statistically significant stratification provided by our ML model
a specific delineation of high-risk and low-risk groups of in both the cross-validation and prospective testing experiments.
patients. In our cross-validation cohort, binary classification Building a Cox Proportional Hazards model for our prediction
provides accuracy of 89% (95% CI 88%-90%), recall of 80% in the cross-validation cohort provides a statistically significant
(95% CI 74%-85%), precision of 17% (95% CI 15%-19%), and difference in survival between the 2 groups (PJOURNAL OF MEDICAL INTERNET RESEARCH Sankaranarayanan et al
Figure 4. Kaplan-Meier survival curves for the GRU-D stratified populations in the cross-validation cohort (main figure) and the prospective test cohort
(inset), where teal is the prediction of low risk of death and red is the prediction of high risk. Both figures have 95% CIs visualized for the teal and red
curves, although the teal confidence bands are tight due to our large sample sizes.
Principal Results
Discussion
Our cross-validation experiments summarized in Table 2
Study Overview indicated that the top performing model to predict mortality in
In this study, we collected and processed over 50 laboratory our cohort was the GRU-D RNN. We thus selected the GRU-D
and clinical covariates in a population of nearly 12,000 Mayo method to predict the mortality of patients with COVID-19 and
Clinic patients who tested positive for SARS-CoV-2 by PCR. prospectively found an AUROC of 0.901, accuracy of 78%
In this large and geographically diverse data set, we found that (95% CI 76%-79%), recall of 85% (95% CI 77%-91%),
the GRU-D RNN could provide state-of-the-art mortality precision of 14% (95% CI 12%-17%), negative predictive value
prediction. This performance remained strong even in a held-out of 99% (95% CI 99%-100%), and a statistically significant
test set that mimics how a deployed system would be trained difference in survival (PJOURNAL OF MEDICAL INTERNET RESEARCH Sankaranarayanan et al
accuracy showed minor decreases with the recall showing passive EHR/chart-based flags or a direct page to the frontline
modest improvements. clinical provider. Passive chart alerts are less intrusive to
existing workflows (ie, a direct page interrupts a physician while
We chose a prospective/retrospective split in time since this is
tending to other patients) but also provide less-immediate
the most realistic way to assess the potential performance of a
feedback. Additionally, active alerts could also be sent to a
system if launched clinically, because it would be trained on
triage group to consider if evaluation is needed (for example,
data up until its go-live date and then run prospectively in a
from the registered respiratory therapist) rather than interrupting
potentially evolving pandemic environment. Notably, the cutoff
bedside clinicians. Furthermore, for either type of alert, there
date for the 80/20 split creating the prospective test set was
is the question of prescribing a bedside assessment or leaving
December 15, 2020, which is the day after the first COVID
it to provider discretion, which is again a matter of balancing
vaccine received the United States Food and Drug
disruption of the workflow with the likelihood of missing a
Administration approval, meaning that our prospective cohort
critical event. There will not be a universally appropriate
represented a distinctly different clinical environment compared
implementation for all hospital systems owing to staffing and
to the period in which the model was trained. The relatively
procedural differences. However, since our algorithm predicts
minor loss of performance in prospective validation shows the
overall COVID-19 mortality and is not tailored to flag imminent
robustness of the modeling herein, but the observed loss of
events such as cardiopulmonary arrest, it may be appropriate
performance also demonstrates the need for continued
to consider less intrusive chart alerts without prescribed bedside
retraining/validation of such a model during a constantly
follow-ups.
evolving pandemic.
We have also seen nuances in the challenges and opportunities
Limitations presented by MNAR data. In the context of traditional statistical
The application and deployment of ML methods in clinical inference and imputation, MNAR data is a worst-case scenario
practice require concerted care and diligence. One may be so challenging that many practical applications effectively ignore
inclined to interpret the high negative predictive value of our the reality and proceed with algorithms designed for the missing
prediction algorithm as an indication that the best use of the completely at random or missing at random settings. A diligent
algorithm in practice is as a screening mechanism to discharge statistician making this decision may perform a sensitivity
patients who are not at risk in order to conserve resources for analysis under a very limited set of assumed MNAR mechanisms
higher-risk individuals. However, such a conclusion illustrates to provide some assurances regarding the robustness of the
a pitfall of using a correlative prediction algorithm to make chosen imputation or analytical strategy [18]. However, here
causal conclusions. The algorithm is highly confident that under we have demonstrated that classification problems can be quite
the current standards of care at Mayo Clinic, these individuals distinct in this regard. Specifically, if the missing data
are not likely to succumb to their illness; this is quite distinct mechanism is tightly coupled to the ultimate prediction task, it
from asserting that it is safe to reduce the care for these patients. is entirely possible for MNAR data to be an asset rather than
Arriving at this latter conclusion would likely require a an impediment. One can construct a context where the class
randomized controlled trial, and given the much lower survival label is so tightly linked to the missing data mechanism that the
rate published in the New York City data set [11] where medical patterns of missingness provide more discriminative power than
systems were overcapacity, it seems unlikely that reducing care the underlying values themselves (see Multimedia Appendix
from those who survived in our cohort would have been a safe 2) [19]. In LIS systems, the number of potential laboratory tests
measure. Because the Mayo Clinic health systems have not been that could be ordered at any time is astronomical, and it is
overcapacity, our mortality predictions should be viewed as unlikely that a practicing physician will ever order a “complete
representing patient stratification when full clinical support is observation” of every test available on a single patient at every
available. point in time. Instead, tests are ordered based on reasonable
Therefore, we conclude that the algorithm is better deployed as clinical suspicion that a test might return an abnormal result.
an alert system that flags only those patients it deems as high From a prognostication point of view, this clinical suspicion is
risk to provide the treating physician with an additional data an enormously valuable piece of information that will almost
point that aims to summarize the many covariates and the never be captured in a structured data field in the EHR. If an
laboratory values routinely available. In this context, the algorithm cannot build off of this clinical suspicion as a starting
algorithm has had abundant experience in the provider’s system, point, it is also likely that its conclusions may appear to be a
effectively “seeing” all patients with COVID-19 that have “step behind” the ordering clinician. Instead, an algorithm
attended Mayo Clinic and conveying these lessons to physicians should learn what it can from the MNAR data patterns (here
who could not have gained such experience personally. partly encoding clinical suspicion) in addition to the final value
returned by the laboratory test.
A web interface to this model may allow for widespread usage
but given the complexity and error-prone nature of users We also note some of the real-world challenges that are faced
providing the high dimensional time-series measurements with when attempting to deploy such an alert system into clinical
correct units, the system is better suited for integration within practice. First, in the retrospective experimental design followed
the EHR/LIS infrastructure. We are now exploring the details here and by other papers in the literature, the time series data
of deployment of such a GRU-D alert system, which involves are constructed using the time of sample collection since this
discussions with physicians to assess numerous implementation is the most biologically accurate way to represent the data and
details, for example, deciding whether the alerts would be build predictive models. However, in practice, if there can be
https://www.jmir.org/2021/9/e30157 J Med Internet Res 2021 | vol. 23 | iss. 9 | e30157 | p. 11
(page number not for citation purposes)
XSL• FO
RenderXJOURNAL OF MEDICAL INTERNET RESEARCH Sankaranarayanan et al
delays in the turnaround for certain tests, this will either result Comparison With Prior Work
in delayed predictions (so that the deployed testing data match For context, in Table 4, we summarize some of the largest
its retrospective training counterpart) or result in biased published COVID-19 mortality studies and specifically, the
predictions when delayed laboratory test results are treated as cohorts analyzed and the most relevant features identified. When
missing. Therefore, although 72 hours is early in the course of smaller cohorts see insufficient numbers of deaths for direct
illness, it is crucial that we have demonstrated reasonable mortality prediction, studies tend to focus on the prediction of
performance even when only considering data collected on the severe outcomes. For instance, in a cohort of 123 patients with
same day as the first positive PCR result, because a real-world COVID-19 in Vulcan Hill Hospital, China, in the study of Pan
delay of 48 hours on certain laboratory test values may occur et al [20], the mortality classifier based on XGBoost yielded an
during a global pandemic, and thus, it is critical that the system AUC of 0.86-0.92. Likewise, in a cohort of 372 Chinese cases
can still provide accurate and timely predictions even when (99.7% cohort survival rate), Gong et al [9] found that the
laboratory test results are delayed. Additionally, with vaccines following variables provided an AUROC of 0.85. Similarly, in
now being delivered, the models presented herein should be a study of 375 patients with COVID-19 conducted by Ko et al
considered as mortality predictions for an unvaccinated [21], the mortality prediction model based on XGBoost had
individual, and in practice, a vaccinated individual will be 92% accuracy. In a study of 398 COVID-19–positive patients
expected to be at low risk for mortality based on the clinical by Abdulaal et al [22], 86% accuracy was achieved (95% CI
trials data. 75%-93%). In a large study of 2160 cases over 54 days from 3
Another challenge in dealing with LIS data comes from hospitals in Wuhan, China with sufficient cases to assess
nonstandardization of test coding prior to reporting to the EHR. mortality (88% cohort survival rate), Gao et al [8] reported
In a multisite system, the same laboratory test may have multiple 0.92-0.98 as the AUROC using an ensemble classifier.
test codes to account for the different ordering facilities or Furthermore, Vaid et al [11] used 4098 inpatient cases over 68
variability in local billing regulations. This creates the potential days in New York City (83% cohort survival rate) to achieve
for discrepancies in the values stored within the underlying an AUROC of 0.84-0.88 in mortality prediction. Kim et al [23]
database such as differing units of measure. Substantial effort studied 4787 patients and their XGBoost-based classifier
is therefore devoted to linking the LIS results to the EHR to demonstrated an AUC of 0.88-0.89 (95% CI 0.85-0.91) in
ensure consistency across test codes and complete coverage of predicting the need for intensive care, which is distinct from
results in the EHR. The COVID-19 pandemic has created added mortality prediction. Bolourani et al [24] studied 11,525 patients
complexity due to the rapidly evolving and continuously to achieve an AUROC of 0.77 in predicting respiratory failure
updating availability of COVID-19 nucleic acid and antibody within 48 hours of admission, which is also distinct from
tests. Therefore, effective data collection and deployment of mortality prediction, based on data from the emergency
ML methodologies necessitates extensive team-based laboratory department by using an XGBoost model.
and medical expertise to ensure that data aggregation and The dramatically different cohort mortality rates and the
modeling efforts can be rapidly modified to suit the changing associated predictive accuracies may be in part due to the
nature of the underlying data set. Scalability also presents differing straining of the local health care systems at the time
practical challenges. This is illustrated by a scenario in which of study (both Wuhan and New York City experienced waves
internal workflows began to fail due to limitations in the number of patients that at different times overwhelmed the health care
of query results being returned by Tableau, necessitating that infrastructure), and the relatively geographically narrow nature
SQL queries take place on a high-performance computing cluster of each of these data sets underscores why it is unlikely that
using a Python/Pandas toolchain. Although these logistical these mortality predictions would extend directly to our patient
challenges may be of limited academic interest, they are population in a health care system spanning 3 time zones and
important to document, as such barriers have been a greater multiple locales unrepresented in the literature.
impediment to rapid real world deployment than more traditional
topics in the ML literature such as the identification of
appropriate classification algorithms.
https://www.jmir.org/2021/9/e30157 J Med Internet Res 2021 | vol. 23 | iss. 9 | e30157 | p. 12
(page number not for citation purposes)
XSL• FO
RenderXJOURNAL OF MEDICAL INTERNET RESEARCH Sankaranarayanan et al
Table 4. Summary of the related studies.
Study Patients (n) Model/algorithm Cohort Prediction Area under the re- Feature importance
survival ceiver operating
characteristic curve
Pan et al [20] 123 XGBoost 52.8% Mortality 0.86-0.92 Lymphocyte percentage, prothrombin
time, lactate dehydrogenase, total biliru-
bin, eosinophil percentage, creatinine,
neutrophil percentage, and albumin level
Gong et al [9] 372 Nomogram 99.7% Severity 0.85 (95% CI 0.790- Higher lactate dehydrogenase, C-reactive
0.916) protein, red blood cell distribution width,
direct bilirubin, blood urea nitrogen, and
lower
albumin
Ko et al [21] 375 XGBoost 98.1% Mortality —,a accuracy of Not assessed
92%
Abdulaal et al 398 Artificial neural — Mortality —, accuracy of 86% Altered mentation, dyspnea, age, collapse,
[22] network (95% CI 75%-93%) gender, and cough
Shi et al [10] 487 Custom risk score 100% Severity — Advanced age, presence of hypertension,
calculation and being male
Gao et al [8] 2160 Ensemble model based 88% Mortality 0.92-0.98 Consciousness, chronic kidney disease,
on logistic regression, lymphocyte counts, sex, sputum, blood
gradient-boosted deci- urea nitrogen, respiratory rate, oxygen
sion tree, neural net- saturation, D-dimer, number of comorbidi-
work, and support ties, albumin, age, fever, and platelet count
vector machine
Vaid et al [11] 4098 XGBoost 83% Mortality 0.84-0.88 Age, anion gap, C-reactive protein, lactate
dehydrogenase, oxygen saturation, blood
urea nitrogen, ferritin, red cell distribution
width, and
diastolic blood pressure.
Kim et al [23] 4787 XGBoost — Need for 0.88-0.89 Activities of daily living, age, dyspnea,
intensive body temperature, sex, and
care underlying comorbidities
Bolourani et al 11,525 XGBoost — Predicting 0.77 Invasive mode of oxygen delivery being
[24] respiratory a nonrebreather mask, emergency severity
failure index values of 1 and 3, maximum respira-
tory rate, maximum, oxygen saturation,
Black race, age on admission, eosinophil
percentage, serum sodium level, and
serum lactate level.
This study 11,807 GRU-D 95.4% Mortality 0.938 cross-valida- Figure 2, top 5: age, Charlson comorbidity
tion; 0.901 prospec- index, minimum oxygen saturation, fibrino-
tively gen level, and serum iron level
a
Not available.
As indicated in Table 4, this study represents the largest cohort previously, the GRU-D algorithm ended up ranked most highly
collected for mortality prediction in COVID-19, and the GRU-D in our cross-validation experiments.
algorithm shows state-of-the-art performance. Notably, many
papers selected models based on XGBoost, which also showed
Conclusions
strong cross-validation performance in our data. However, Table We have aggregated and analyzed one of the largest multistate
2 demonstrates that XGBoost was not even in the top 5 COVID-19 EHR databases for mortality prediction. Using this
algorithms that we assessed. Additionally, in agreement with database, we have trained and prospectively validated a highly
Gao et al [8], we find that ensemble algorithms such as effective ML algorithm using the GRU-D neural network
AutoGluon can provide stronger performance, although as noted architecture to predict the mortality of patients with COVID-19
shortly after their first positive PCR test result.
https://www.jmir.org/2021/9/e30157 J Med Internet Res 2021 | vol. 23 | iss. 9 | e30157 | p. 13
(page number not for citation purposes)
XSL• FO
RenderXJOURNAL OF MEDICAL INTERNET RESEARCH Sankaranarayanan et al
Acknowledgments
We thank the Advanced Diagnostics Laboratory, Department of Laboratory Medicine and Pathology, and the Center for
Individualized Medicine at Mayo Clinic for funding this research. We thank Dr Nicholas Chia for his insightful discussions and
feedback on this manuscript. We are grateful to the thorough and constructive comments of the anonymous reviewers whose
feedback greatly improved our paper.
Conflicts of Interest
JCO has equity in Doximity, Inc, and has received small grants from Nference, Inc, and personal fees from Bates College. None
of these are related to the current paper.
Multimedia Appendix 1
Error analysis.
[DOCX File , 496 KB-Multimedia Appendix 1]
Multimedia Appendix 2
Monte Carlo missing-not-at-random simulation.
[DOCX File , 592 KB-Multimedia Appendix 2]
References
1. Andersen KG, Rambaut A, Lipkin WI, Holmes EC, Garry RF. The proximal origin of SARS-CoV-2. Nat Med 2020
Apr;26(4):450-452 [FREE Full text] [doi: 10.1038/s41591-020-0820-9] [Medline: 32284615]
2. Zhou P, Yang X, Wang X, Hu B, Zhang L, Zhang W, et al. A pneumonia outbreak associated with a new coronavirus of
probable bat origin. Nature 2020 Mar;579(7798):270-273 [FREE Full text] [doi: 10.1038/s41586-020-2012-7] [Medline:
32015507]
3. WHO Coronavirus disease (COVID-19) dashboard. World Health Organization. URL: https://covid19.who.int/ [accessed
2021-08-11]
4. Chinazzi M, Davis JT, Ajelli M, Gioannini C, Litvinova M, Merler S, et al. The effect of travel restrictions on the spread
of the 2019 novel coronavirus (COVID-19) outbreak. Science 2020 Apr 24;368(6489):395-400 [FREE Full text] [doi:
10.1126/science.aba9757] [Medline: 32144116]
5. Remuzzi A, Remuzzi G. COVID-19 and Italy: what next? Lancet 2020 Apr 11;395(10231):1225-1228 [FREE Full text]
[doi: 10.1016/S0140-6736(20)30627-9] [Medline: 32178769]
6. Rosenbaum L. Facing Covid-19 in Italy - Ethics, Logistics, and Therapeutics on the Epidemic's Front Line. N Engl J Med
2020 May 14;382(20):1873-1875. [doi: 10.1056/NEJMp2005492] [Medline: 32187459]
7. Wiersinga WJ, Rhodes A, Cheng AC, Peacock SJ, Prescott HC. Pathophysiology, Transmission, Diagnosis, and Treatment
of Coronavirus Disease 2019 (COVID-19): A Review. JAMA 2020 Aug 25;324(8):782-793. [doi: 10.1001/jama.2020.12839]
[Medline: 32648899]
8. Gao Y, Cai G, Fang W, Li H, Wang S, Chen L, et al. Machine learning based early warning system enables accurate
mortality risk prediction for COVID-19. Nat Commun 2020 Oct 06;11(1):5033 [FREE Full text] [doi:
10.1038/s41467-020-18684-2] [Medline: 33024092]
9. Gong J, Ou J, Qiu X, Jie Y, Chen Y, Yuan L, et al. A Tool for Early Prediction of Severe Coronavirus Disease 2019
(COVID-19): A Multicenter Study Using the Risk Nomogram in Wuhan and Guangdong, China. Clin Infect Dis 2020 Jul
28;71(15):833-840 [FREE Full text] [doi: 10.1093/cid/ciaa443] [Medline: 32296824]
10. Shi Y, Yu X, Zhao H, Wang H, Zhao R, Sheng J. Host susceptibility to severe COVID-19 and establishment of a host risk
score: findings of 487 cases outside Wuhan. Crit Care 2020 Mar 18;24(1):108 [FREE Full text] [doi:
10.1186/s13054-020-2833-7] [Medline: 32188484]
11. Vaid A, Somani S, Russak AJ, De Freitas JK, Chaudhry FF, Paranjpe I, et al. Machine Learning to Predict Mortality and
Critical Events in a Cohort of Patients With COVID-19 in New York City: Model Development and Validation. J Med
Internet Res 2020 Nov 06;22(11):e24018 [FREE Full text] [doi: 10.2196/24018] [Medline: 33027032]
12. Wynants L, Van Calster B, Collins GS, Riley RD, Heinze G, Schuit E, et al. Prediction models for diagnosis and prognosis
of covid-19: systematic review and critical appraisal. BMJ 2020 Apr 07;369:m1328 [FREE Full text] [doi:
10.1136/bmj.m1328] [Medline: 32265220]
13. Charlson ME, Pompei P, Ales KL, MacKenzie CR. A new method of classifying prognostic comorbidity in longitudinal
studies: development and validation. J Chronic Dis 1987;40(5):373-383. [doi: 10.1016/0021-9681(87)90171-8] [Medline:
3558716]
https://www.jmir.org/2021/9/e30157 J Med Internet Res 2021 | vol. 23 | iss. 9 | e30157 | p. 14
(page number not for citation purposes)
XSL• FO
RenderXJOURNAL OF MEDICAL INTERNET RESEARCH Sankaranarayanan et al
14. Kumar A, Arora A, Sharma P, Anikhindi SA, Bansal N, Singla V, et al. Is diabetes mellitus associated with mortality and
severity of COVID-19? A meta-analysis. Diabetes Metab Syndr 2020;14(4):535-545 [FREE Full text] [doi:
10.1016/j.dsx.2020.04.044] [Medline: 32408118]
15. Erickson N, Mueller J, Shirkov A, Zhang H, Larroy P, Li M, et al. AutoGluon-Tabular: robust and accurate AutoML for
structured data. 2020 Presented at: 7th ICML Workshop on Automated Machine Learning; July 12-18; Virtual Location
URL: https://www.automl.org/wp-content/uploads/2020/07/AutoML_2020_paper_7.pdf
16. Che Z, Purushotham S, Cho K, Sontag D, Liu Y. Recurrent Neural Networks for Multivariate Time Series with Missing
Values. Sci Rep 2018 Apr 17;8(1):6085 [FREE Full text] [doi: 10.1038/s41598-018-24271-9] [Medline: 29666385]
17. Therneau T, Grambsch P. Modeling Survival Data: Extending the Cox Model. New York, USA: Springer; 2000:7-13.
18. Cro S, Morris TP, Kenward MG, Carpenter JR. Sensitivity analysis for clinical trials with missing continuous outcome
data using controlled multiple imputation: A practical guide. Stat Med 2020 Sep 20;39(21):2815-2842. [doi:
10.1002/sim.8569] [Medline: 32419182]
19. Buuren SV, Groothuis-Oudshoorn K. mice: Multivariate Imputation by Chained Equations in R. J Stat Soft 2011;45(3):1-67.
[doi: 10.18637/jss.v045.i03]
20. Pan P, Li Y, Xiao Y, Han B, Su L, Su M, et al. Prognostic Assessment of COVID-19 in the Intensive Care Unit by Machine
Learning Methods: Model Development and Validation. J Med Internet Res 2020 Nov 11;22(11):e23128 [FREE Full text]
[doi: 10.2196/23128] [Medline: 33035175]
21. Ko H, Chung H, Kang WS, Park C, Kim DW, Kim SE, et al. An Artificial Intelligence Model to Predict the Mortality of
COVID-19 Patients at Hospital Admission Time Using Routine Blood Samples: Development and Validation of an Ensemble
Model. J Med Internet Res 2020 Dec 23;22(12):e25442 [FREE Full text] [doi: 10.2196/25442] [Medline: 33301414]
22. Abdulaal A, Patel A, Charani E, Denny S, Mughal N, Moore L. Prognostic Modeling of COVID-19 Using Artificial
Intelligence in the United Kingdom: Model Development and Validation. J Med Internet Res 2020 Aug 25;22(8):e20259
[FREE Full text] [doi: 10.2196/20259] [Medline: 32735549]
23. Kim H, Han D, Kim J, Kim D, Ha B, Seog W, et al. An Easy-to-Use Machine Learning Model to Predict the Prognosis of
Patients With COVID-19: Retrospective Cohort Study. J Med Internet Res 2020 Nov 09;22(11):e24225 [FREE Full text]
[doi: 10.2196/24225] [Medline: 33108316]
24. Bolourani S, Brenner M, Wang P, McGinn T, Hirsch JS, Barnaby D, Northwell COVID-19 Research Consortium. A
Machine Learning Prediction Model of Respiratory Failure Within 48 Hours of Patient Admission for COVID-19: Model
Development and Validation. J Med Internet Res 2021 Feb 10;23(2):e24246 [FREE Full text] [doi: 10.2196/24246] [Medline:
33476281]
Abbreviations
AUROC: area under the receiver operator characteristic
EHR: electronic health record
GRU: gated recurrent unit
LIS: laboratory information system
ML: machine learning
MNAR: missing-not-at-random
PCR: polymerase chain reaction
RNN: recurrent neural network
Edited by C Basch; submitted 03.05.21; peer-reviewed by HJ Kim, S Lalmuanawma; comments to author 28.06.21; revised version
received 18.07.21; accepted 11.08.21; published 28.09.21
Please cite as:
Sankaranarayanan S, Balan J, Walsh JR, Wu Y, Minnich S, Piazza A, Osborne C, Oliver GR, Lesko J, Bates KL, Khezeli K, Block
DR, DiGuardo M, Kreuter J, O’Horo JC, Kalantari J, Klee EW, Salama ME, Kipp B, Morice WG, Jenkinson G
COVID-19 Mortality Prediction From Deep Learning in a Large Multistate Electronic Health Record and Laboratory Information
System Data Set: Algorithm Development and Validation
J Med Internet Res 2021;23(9):e30157
URL: https://www.jmir.org/2021/9/e30157
doi: 10.2196/30157
PMID: 34449401
©Saranya Sankaranarayanan, Jagadheshwar Balan, Jesse R Walsh, Yanhong Wu, Sara Minnich, Amy Piazza, Collin Osborne,
Gavin R Oliver, Jessica Lesko, Kathy L Bates, Kia Khezeli, Darci R Block, Margaret DiGuardo, Justin Kreuter, John C O’Horo,
https://www.jmir.org/2021/9/e30157 J Med Internet Res 2021 | vol. 23 | iss. 9 | e30157 | p. 15
(page number not for citation purposes)
XSL• FO
RenderXJOURNAL OF MEDICAL INTERNET RESEARCH Sankaranarayanan et al
John Kalantari, Eric W Klee, Mohamed E Salama, Benjamin Kipp, William G Morice, Garrett Jenkinson. Originally published
in the Journal of Medical Internet Research (https://www.jmir.org), 28.09.2021. This is an open-access article distributed under
the terms of the Creative Commons Attribution License (https://creativecommons.org/licenses/by/4.0/), which permits unrestricted
use, distribution, and reproduction in any medium, provided the original work, first published in the Journal of Medical Internet
Research, is properly cited. The complete bibliographic information, a link to the original publication on https://www.jmir.org/,
as well as this copyright and license information must be included.
https://www.jmir.org/2021/9/e30157 J Med Internet Res 2021 | vol. 23 | iss. 9 | e30157 | p. 16
(page number not for citation purposes)
XSL• FO
RenderXYou can also read