COVID-19: Forecasting short term hospital needs in France - EA Reperes
←
→
Page content transcription
If your browser does not render page correctly, please read the page content below
COVID-19: Forecasting short term hospital needs in France

                           Clément Massonnaud1,2∗, Jonathan Roux1∗ , Pascal Crépey1†

                                                        2020-03-16

1Univ Rennes, EHESP, REPERES « Recherche en Pharmaco-Epidémiologie et Recours aux Soins » –
EA 7449, 15 avenue du Professeur-Léon-Bernard, CS 74312, 35043 Rennes, France. 2 Rouen University
Hospital, Department of Biostatistics, 76031 Rouen, France.

1        Abstract
Europe is now considered as the epicenter of the SARS-CoV-2 pandemic, France being among the most
impacted country. In France, there is an increasing concern regarding the capacity of the healthcare
system to sustain the outbreak, especially regarding intensive care units (ICU). The aim of this study was
to estimate the dynamics of the epidemic in France, and to assess its impact on healthcare resources for
each French metropolitan Region. We developed a deterministic, age-structured, Susceptible-Exposed-
Infectious-Removed (SEIR) model based on catchment areas of each COVID-19 referral hospitals. We
performed one month ahead predictions (up to April 14, 2020) for three different scenarios (R0 = 1.5,
R0 = 2.25, R0 = 3), where we estimated the daily number of COVID-19 cases, hospitalizations and deaths,
the needs in ICU beds per Region and the reaching date of ICU capacity limits. At the national level, the
total number of infected cases is expected to range from 22,872 in the best case (R0 = 1.5) to 161,832 in
the worst case (R0 = 3), while the total number of deaths would vary from 1,021 to 11,032, respectively.
At the regional level, all ICU capacities may be overrun in the worst scenario. Only seven Regions may
lack ICU beds in the mild scenario (R0 = 2.25) and only one in the best case. In the three scenarios, Corse
may be the first Region to see its ICU capacities overrun. The two other Regions, whose capacity will be
overrun shortly after are Grand-Est and Bourgogne-Franche-Comté. Our analysis shows that, even in
the best case scenario, the French healthcare system will very soon be overwhelmed. While drastic social
distancing measures may temper our results, a massive reorganization leading to an expansion of French
ICU capacities seems to be necessary to manage the coming wave of critically affected COVID-19 patients.

2        Introduction
On December 31, 2019, Chinese authorities informed WHO of grouped pneumoniae cases.1 The majority
of these cases were linked the Huanan South China Seafood Market, in the city of Wuhan, Hubei province,
China. A novel coronavirus, SARS-Cov-2, was identified on January 7, 2020, as the cause of this outbreak.
On January 13, the first case outside of China was confirmed in Thailand.2 The first cases on the European
continent were confirmed in France on January 24.3 The World Health Organization (WHO), declared the
outbreak a Public Health Emergency of International Concern on 30 January 2020,4 and announced a
name for the disease on February 11: COVID-19.5
    ∗
        Both authors contributed equally.
    †
        corresponding author - pascal.crepey@ehesp.fr

                                                            1
As of March 5, the European Centre for Disease Prevention and Control (ECDC) reported 91,315 COVID-
19 confirmed cases in 81 countries, and 3,282 deaths (3.4%). In Europe, 38 countries reported cases, Italy
accounting for the majority of them, with 3,089 cases out of 4,290 (72%), and 107 deaths out of 113
(94.7%). France was ranked second with 423 cases and 5 deaths (1.2%).6 On March 11, WHO declared a
pandemic, as 106 countries reported 118,628 confirmed cases and 4,292 deaths (3.6%).7 In Europe, the
number of countries affected increased to 47, Italy still accounting for the majority of cases.8
Figure 1 shows the number of cases in metropolitan France from January 22 to March 14 (source Santé
Publique France). As of March 10, midnight, 2,030 cases were confirmed, leading to 44 deaths (2.2%).8 The
two Regions the most impacted were Grand Est and Ile-de-France, with 489, and 468 cases, respectively.
People aged over 75 years accounted for 19% of the cases but around 75% of the deaths.8 As of March 10,
102 cases had been hospitalized into Intensive Care Units (ICU), 38% of them aged 65 years or less. The
doubling time is approximately 72h, as the number of cases increased from 1,126 to 2,269 between March
8 and March 11, and from 2,269 to 4,469 between March 11 and March 14. It must be noted that it is
likely that the number of confirmed cases is underestimating the true number of cases as all cases are not
necessarily identified due to logistical issues in some Regions.8
4000
3000
2000
1000
0
Feb 01 Feb 15 Mar 01 Mar 15
Figure 1: Number of confirmed COVID-19 cases in France from January 22 to March 14
SARS-CoV-2 is a zoonotic virus, and bats are believed to be its reservoir. However, human-to-human
transmission has been largely reported.9 Transmission occurs mostly via droplets and fomites during close
unprotected contact. Information about the main transmission parameters is still relatively scarce, and
can vary according to the settings, the data, and the methods used.
The basic reproductive number (R0 ) was estimated in various studies9–19 starting at 1.4, up to 7.23. Most
countries have now implemented control strategies involving contact tracing, quarantine, and isolation
measures, which are likely to significantly reduce the R0 . Li and colleagues used individually documented
case descriptions from China to estimate a reproductive number in the context of control measures (Rc ).17
It was estimated to be 1.54. Zhou and colleagues19 estimated a controlled reproduction number between
1.46 and 2.99. They also estimated mean incubation and contagious periods of 5 and 11 days, respectively.
2Abbott and colleagues estimated the reproduction number of 24 countries using publicly available data
with a 7-day sliding window. Their estimate for France in date of March 13 was between 1.4 and 3.2.20
Several models have already been developed to forecast propagation dynamics of COVID-19 epidemics
in various settings. However, models in European context are lacking. Danon and colleagues explored
disease transmission in England and Wales by adapting an existing stochastic, metapopulation model.21
Pinotti and colleagues modeled international importation of COVID-19 cases to assess rapidity of isolation,
effect of intervention, and undetection rates.22 To this date, no models have been developed to analyze
COVID-19 propagation dynamics in France.
3 Objective
The objective of this study was to estimate the number of COVID-19 cases, hospitalizations and deaths in
France, and to assess the impact of the epidemic on healthcare resources, by estimating the number of
required hospital beds in ICU throughout the epidemic, for each region. As a sensitivity analysis and to
assess the potential impact of large scale control measures, we varied the R0 of the epidemic from 3 to 1.5.
4 Methods
We listed the 138 hospitals that are identified as referral centers for the treatment of COVID-19 cases
in France. Of those, 33 hospitals are listed as primary referral centers, and 98 as secondary referral
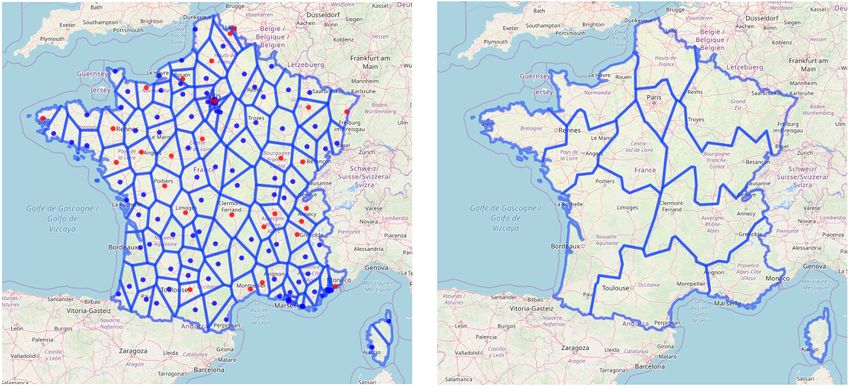
centers in metropolitan France and 7 are overseas hospitals (not included). We then divided metropolitan
France into hospital catchment areas around these referral hospitals using Voronoi polygons (Figure 2).
Population structure was inferred for each catchment area from 2016 and 2017 census data provided by
the French National Institute of Statistics and Economic Studies (Insee).23 Catchment areas were then
aggregated by metropolitan Regions [13 French administrative areas with an averaged population of 4.75
millions ranging from 300,000 (Corse) to 12.55 millions (Ile-de-France)]. Data on ICU beds capacity per
French Region were retrieved from the “Statistique Annuelle des Etablissements de Santé” (SAE).24
Figure 2: Maps of France divided into hospital catchment areas, then aggregated by French Region.
3We developed a deterministic, age-structured, compartmental, Susceptible-Exposed-Infectious-Removed
(SEIR) model, as a set of differential equations (Figure 3). The population was divided into 17 age-groups
(5 years age-band), and can be either susceptible (S), exposed to the virus but not infectious (E), infected
and infectious (I), or removed from the chains of infection (R). We used an inter-individual contacts
matrix for the French population estimated by Prem and colleagues25 to simulate age-dependent mixing.
Figure 3: Diagram of the age-structured SEIR model.
We considered an incubation period of 5 days and a contagious period of 11 days.19 We assumed an
average length of stay in hospitals and in ICU wards of 15 days for all patients, of all ages. We estimated
the age-dependent susceptibility of the population based on the age distribution of infected cases reported
by Wu and colleagues in China.11 We standardized the Chinese age distribution of cases to the French
population to estimate the expected age distribution of cases for France. We then fitted the age dependent
susceptibility vector using the R implementation of the subplex algorithm provided by the nloptr package.
Based on the estimated number of new cases per day, we inferred different outcomes. First, we computed
the number of severe cases, defined according to Guan and colleagues.18 We used their estimations of
age-dependent severity risks across four age groups, which were dispatched across our 17 age groups (Table
1). We also estimated the number of cases which will require hospitalization to ICU using age-dependent
risks from Guan and colleagues18 (Table 1). Using data from Yang and colleagues,26 we set the proportion
of cases which will require mechanical ventilation to 0.711 (not age-dependent). The number of deaths
was estimated using age-dependent deaths risks (10 age groups) provided by the Italian National Institute
of Health (Istituto Superiore di Sanità) (Table 1).27
The transmission model was implemented in C++. Data collection, data management, model runs, and
results analysis and reporting were performed using R. All data and source code were bundled into an
R package and a Shiny application was developed to run the model with different parameters, and to
explore the various results (available upon request).
5 Results
5.1 Identification of ICU capacity limits by French Region
Our first objective was to identify when ICU capacities in each French Region would likely be overrun
by the COVID-19 epidemic. Figure 4 shows the evolution of the number of required ICU beds to treat
patients in critical conditions in each Region, along with the theoretical ICU capacity limits. In the worst
case scenario, all Region will be overrun before April 14th , 2020. As seen on Table 2, Corse is likely to be
at full ICU capacity before the end of March 2020 (March 28 in the best case, March 18 in the worst case
scenario). In the scenario with R0 = 2.25, half of the French Regions will run out of ICU capacities before
mid-April.
4Table 1: Parameters used to compute the main outcomes.
Age group Severity risk ICU risk Death risk
0-4 0.11 0.02 0.000
5-9 0.11 0.02 0.000
10-14 0.11 0.02 0.000
15-19 0.12 0.02 0.000
20-24 0.12 0.02 0.000
25-29 0.12 0.02 0.000
30-34 0.12 0.02 0.002
35-39 0.12 0.02 0.002
40-44 0.12 0.02 0.002
45-49 0.12 0.02 0.002
50-54 0.17 0.07 0.008
55-59 0.17 0.07 0.008
60-64 0.17 0.07 0.027
65-69 0.29 0.21 0.027
70-74 0.29 0.21 0.108
75-79 0.29 0.21 0.108
80 and older 0.29 0.21 0.181
Table 2: Estimated date of ICU capacity overrun in the 13 metropolitan French Regions, for R0 1.5, 2.25,
and 3. Simulations start on March 10, and end on April 14, 2020.
Region R0 1.5 R0 2.25 R0 3
Corse 2020-03-28 2020-03-21 2020-03-18
Grand-Est 2020-03-28 2020-03-22
Bourgogne-Franche-Comte 2020-04-01 2020-03-24
Bretagne 2020-04-06 2020-03-27
Hauts-de-France 2020-04-07 2020-03-28
Auvergne-Rhone-Alpes 2020-04-10 2020-03-30
Ile-de-France 2020-04-14 2020-04-01
PACA 2020-04-05
Normandie 2020-04-08
Pays de la Loire 2020-04-08
Nouvelle-Aquitaine 2020-04-09
Occitanie 2020-04-09
Centre-Val de Loire 2020-04-12
5Figure 4: Predicted needs of ICU beds in the 13 French Regions. The red line stands for the ICU capacity
limit, the dotted line stands for the scenario with R0 = 2.25, the black lines for the worst and best case
scenarios (R0 = 3 and R0 = 1.5, respectively). Panels for each French Region are ordered by time of
overrun (left to right and top to bottom).
6Table 3: Predicted number of infected cases, severe cases, and deaths, from March 10 to April 14, 2020,
by Region, for R0 values of 1.5, 2.25, and 3.
Infected Severe cases Deaths
Region R0 1.5 R0 2.25 R0 3 R0 1.5 R0 2.25 R0 3 R0 1.5 R0 2.25 R0 3
Auvergne-Rhone-Alpes 2714 7352 19306 545 1624 4692 121 385 1317
Bourgogne-Franche-Comte 1851 5044 13280 374 1117 3233 84 266 909
Bretagne 1029 2805 7415 208 621 1806 47 148 508
Centre-Val de Loire 229 624 1654 46 138 403 10 33 113
Corse 536 1450 3764 108 321 916 24 77 257
Grand-Est 5984 16171 41973 1202 3571 10191 267 847 2856
Hauts-de-France 2706 7319 19105 542 1613 4637 120 381 1298
Ile-de-France 4418 11851 30754 879 2602 7448 192 611 2079
Normandie 472 1286 3403 95 285 828 21 68 233
Nouvelle-Aquitaine 682 1866 4960 138 414 1209 31 99 341
Occitanie 775 2112 5594 156 468 1362 35 111 383
Pays de la Loire 346 941 2484 70 208 604 16 49 170
PACA 1128 3073 8139 228 681 1982 51 162 558
All 22872 61896 161832 4590 13663 39311 1020 3237 11025
5.2 Predicted outcomes by Region
Our analysis predict that the most affected French Region would be “Grand-Est”, with up to 42,000
infections, 10,000 severe cases and more than 2,800 deaths between March 10 and April 14 in the worst
case scenario. In the same scenario, Region “Ile-de-France” and “Auvergne-Rhones-Alpes” would be the
second and third most affected with up to 2,000 and 1,300 deaths, respectively. In the middle range
scenario (R0 = 2.25) and best case scenario (R0 = 1.5), the morbidity and mortality burden would
represent, respectively, roughly 30% and 10% of those numbers.
Our analysis shows that in France between 2,500 and 25,000 patients may require an ICU stay, and
between 1,800 and 18,000 may need to be ventilated. Table 4 shows the estimated total number of ICU
beds and ICU ventilated beds required per Region on April 14 under the three R0 scenarios, as well as
the total ICU capacity in the Region, considering an average length of stay of 15 days. We note very large
variations between the two extreme scenarios (from 305 to 4,260 ICU beds in Ile-de-France), and that
the middle range scenario generally shows estimations very close or over the regional ICU capacity limit,
which will restrain possible inter-regional cooperation or patient transfers.
6 Discussion
In the context of few available modeling data on COVID-19 epidemic in France, the purpose of our study
was to provide a one-month forecast of the spreading dynamic of the virus across all metropolitan French
Regions, and to assess hospitals burden, especially regarding ICU beds and ventilation needs.
We modeled the propagation of COVID-19 from March 10 to April 14, across all metropolitan French
Regions. At the national level, the total number of infected cases is expected to range from 22,872 in the
best case (R0 = 1.5) to 161,832 in the worst considered case (R0 = 3). Regarding the total number of
deaths, it is expected to vary from 1,021 to 11,032, respectively. At the regional level, all ICU capacities
may be overrun in the worst scenario, Centre-Val de Loire being the last region to reach its limits on April
12. Only seven Regions may lack ICU beds in the mid scenario (R0 = 2.25) and only one in the best case.
7Table 4: Predicted number of required intensive care units beds on April 14 2020, by Region, for R0 values
of 1.5, 2.25, and 3.
ICU beds ICU beds with ventilation
Region R0 1.5 R0 2.25 R0 3 R0 1.5 R0 2.25 R0 3 Total ICU capacity
Corse 37 147 518 26 105 368 18
Grand-Est 414 1645 5782 294 1169 4111 465
Bourgogne-Franche-Comte 128 515 1843 91 366 1310 198
Bretagne 71 286 1032 51 204 734 162
Hauts-de-France 187 745 2646 133 530 1882 438
Auvergne-Rhone-Alpes 188 749 2682 134 533 1907 559
Ile-de-France 305 1205 4260 217 857 3029 1147
PACA 78 314 1134 56 223 806 460
Normandie 33 131 474 23 93 337 240
Pays de la Loire 24 96 346 17 68 246 181
Nouvelle-Aquitaine 47 191 692 34 136 492 412
Occitanie 54 216 780 38 153 554 474
Centre-Val de Loire 16 64 231 11 45 164 180
In the three scenarios, Corse may be the first Region to see its ICU capacities overrun with a delay of one
week between each scenario, which may be due to its low ICU capacity (18 beds). The two other Regions,
whose capacity will be overrun shortly after, are Grand-Est and Bourgogne-Franche-Comté, despite their
high number of ICU beds (465 and 198, respectively).
COVID-19 mortality risk is not only dependent on the intrinsic virus’ characteristics, but depends also on
health care capacities, especially ICU. Italy is already seeing its ICU capacities exceeded, as well as several
hospitals in France. However, few studies have tried to forecast ICU needs. Grasselli and colleagues used
linear and exponential models to estimate ICU demand in Lombardy, Italy, from March 7 to March 20.28
They concluded that the health care system could not sustain an uncontrolled outbreak, and that strong
containment measures were needed. Remuzzi and Remuzzi fitted exponential models and predicted that
the Italian health care system could be at maximum capacity by March 14.29 Here, we found that ICU
capacities would be rapidly exceeded in several Regions in France, even in optimistic scenarios. Incapacity
to provide adequate treatment to critically ill patients could further increase the already substantial death
toll of the epidemic.
Besides limits inherent to each transmission model, this work has several specific limitations. The model
was run for each catchment area independently, as we did not model population movements between
catchment areas. Although it is theoretically feasible, it seems unnecessary in this context. Infected cases
are already present in most locations, meaning transmission is likely to be mainly driven locally, not by
inter-areas transfers. Moreover, control measures are already implemented to limit population movements.
We are only presenting forecasts at one month, as long term predictions may be unreliable due to the few
data available to calibrate the model concerning the epidemic in France. The critical factor that remains
unknown to this date is the potential impact of seasonality on the transmission dynamic of COVID-
19. Danon and colleagues modeled seasonal transmission by introducing a time-varying transmission
rate.21 They estimated that a 50% reduction in transmission during summer months would result in a
smaller epidemic before the summer, followed by a resurgence in cases in the following winter. However,
whether SARS-CoV-2 transmission will be affected by seasonal variations remains unclear. Although
many infectious diseases have seasonal patterns, like influenza or other coronaviruses, newly introduced
8viruses can behave differently. Several experts suggest that the impact of seasonality on COVID-19
transmission might be very modest,30,31 therefore we did not included such a seasonality in our model
at the time. Also, we decided to explore only R0 values between 1.5 and 3, as it seems to be the most
reliable estimates at the moment, according to Abbott and colleagues.20 Finally, we did not make a
distinction between symptomatic and asymptomatic cases, whereas some modelers decided to create two
compartments (infectious asymptomatic and infectious symptomatic). We believed it was unnecessary
in this context as we are not focusing on detection or control measures, and it should not impact the
interpretation of our results.
Regarding the prediction of ICU needs, the ICU capacities used in this study are theoretical and based on
annual data,24 and may not reflect exactly current ICU capacities. However, the potential discrepancies
are likely to be modest and should not impact the interpretation of the results. More importantly, we
assumed that ICU capacities could entirely be dedicated to COVID-19 critical patients. In France, ICU
wards tend to have more than 80% occupancy rate (personal communication with clinicians), hence our
analysis already assumes an important patient care reorganization, almost doubling current capacities.
Also, we assumed a fixed length of stay of 15 days in ICU as observed in foreign countries. This value
could vary across patients and locations, and could slightly bias the estimation of ICU needs in our study.
To overcome this bias, we plan to use hospitalization data provided by regional health agencies (ARS),
which may help to have better predictions of beds use.
We restricted our model to metropolitan France, as overseas Regions are at a lower epidemic stage at
the moment, and the transmission dynamics are likely to differ from metropolitan France. Finally, it
must be noted that spatial division of the French territory used in this model does not exactly reflect
administrative boundaries of the French Regions, as it was based on the merge of each Voronoi polygons
representing the catchment areas of referral centers. However, division by catchment areas might help to
better estimate the pressure on the referral centers, as people are more likely to be referred to hospitals
based on geographical distance rather than administrative boundaries.
To mitigate the epidemic, the French government announced a series of nation-wide measures, of increasing
importance. On February 29, gatherings were restricted to 5,000 persons in confined settings. This
threshold has since been revised downwards, with 5,000 persons on March 8, and 100 persons on March
13. On March 12, schools and universities were asked to close starting from March 16, and voluntary
household quarantine and social distancing of those over 70 years of age were recommended. Finally,
on March 14, the stage 3 of the epidemic was declared. Consequently, all non-essential public places
(i.e. non-food shops, restaurants, pubs,. . . ) are closed, and people are enjoined to stay home, limit social
interactions, and travels as much as possible. These mitigation measures were not directly implemented in
the present study, but their impact was assessed indirectly by modifying the value of the reproduction
number.
7 Conclusion
While preliminary, our analysis shows that, even in the best case scenario, the French healthcare system
will very soon be overwhelmed. While drastic social distancing measures may temper our results, a massive
reorganization leading to an expansion of French ICU capacities seems to be necessary to manage the
coming wave of critically affected COVID-19 patients.
8 References
1 World Health Organization. Pneumonia of unknown cause – china. 2020. www.who.int/csr/don/05-
january-2020-pneumonia-of-unkown-cause-china/en/.
92 World Health Organization. WHO statement on novel coronavirus in thailand. 2020. https://www.who.
int/news-room/detail/13-01-2020-who-statement-on-novel-coronavirus-in-thailand.
3 Bernard Stoecklin S, Rolland P, Silue Y et al. First cases of coronavirus disease 2019 (covid-19) in
france: Surveillance, investigations and control measures, january 2020. Eurosurveillance 2020; 25.
DOI:https://doi.org/10.2807/1560-7917.ES.2020.25.6.2000094.
4 World Health Organization. WHO director-general’s statement on ihr emergency committee on novel
coronavirus (2019-nCoV). 2020. https://www.who.int/dg/speeches/detail/who-director-general-s-
statement-on-ihr-emergency-committee-on-novel-coronavirus-(2019-ncov).
5 World Health Organization. Naming the coronavirus disease (covid-19) and the virus that causes it.
2020. https://www.who.int/emergencies/diseases/novel-coronavirus-2019/technical-guidance/naming-
the-coronavirus-disease-(covid-2019)-and-the-virus-that-causes-it.
6 Santé Publique France. Point épidémiologique -situation au 5 mars 2020 -15h. 2020. https://www.
santepubliquef rance.fr/maladies-et-traumatismes/maladies-et-infections-respiratoires/infection-a-
coronavirus/documents/bulletin-national/covid-19-point-epidemiologique-du-5-mars-2020.
7 World Health Organization. WHO director-general’s opening remarks at the media briefing on covid-19 -
11 march 2020. 2020. https://www.who.int/dg/speeches/detail/who-director-general-s-opening-remarks-
at-the-media-briefing-on-covid-19---11-march-2020.
8 Santé Publique France. Point épidémiologique -situation au 10 mars 2020 à minuit. 2020. https:
//www.santepubliquefrance.fr/maladies-et-traumatismes/maladies-et-infections-respiratoires/infection-
a-coronavirus/documents/bulletin-national/covid-19-point-epidemiologique-du-10-mars-2020.
9 World Health Organization. Report of the who-china joint mission on coronavirus disease 2019 (covid-19).
https://www.who.int/docs/default-source/coronaviruse/who-china-joint-mission-on-covid-19-final-
report.pdf.
10 Liu T, Hu J, Kang M et al. Transmission dynamics of 2019 novel coronavirus (2019-nCoV). bioRxiv
2020. DOI:10.1101/2020.01.25.919787.
11 Wu JT, Leung K, Leung GM. Nowcasting and forecasting the potential domestic and international
spread of the 2019-nCoV outbreak originating in Wuhan, China: a modelling study. Lancet 2020; 395:
689–97.
12 Read JM, Bridgen JR, Cummings DA, Ho A, Jewell CP. Novel coronavirus 2019-nCoV: Early estimation
of epidemiological parameters and epidemic predictions. medRxiv 2020. DOI:10.1101/2020.01.23.20018549.
13 Backer JA, Klinkenberg D, Wallinga J. The incubation period of 2019-nCoV infections among travellers
from wuhan, china. medRxiv 2020. DOI:10.1101/2020.01.27.20018986.
14 Li Q, Guan X, Wu P et al. Early transmission dynamics in wuhan, china, of novel coronavirus–infected
pneumonia. New England Journal of Medicine; 0: null.
15 Zhao S, Lin Q, Ran J et al. Preliminary estimation of the basic reproduction number of novel
coronavirus (2019-nCoV) in China, from 2019 to 2020: A data-driven analysis in the early phase of the
outbreak. Int J Infect Dis 2020; 92: 214–7.
16 Riou J, Althaus CL. Pattern of early human-to-human transmission of Wuhan 2019 novel coronavirus
(2019-nCoV), December 2019 to January 2020. Euro Surveill 2020; 25.
17 Li M, Chen P, Yuan Q, Song B, Ma J. Transmission characteristics of the covid-19 outbreak in china:
A study driven by data. medRxiv 2020. DOI:10.1101/2020.02.26.20028431.
1018 Guan WJ, Ni ZY, Hu Y et al. Clinical Characteristics of Coronavirus Disease 2019 in China. N Engl J
Med 2020; published online Feb.
19 Zhou X-H, Author F, You Yuhao Deng Wenjie Hu Jiarui Sun Qiushi Lin Feng Zhou Cheng Heng Pang
Yuan Zhang Zhengchao Chen C. The Lancet Public Health Estimation of the Time-Varying Reproduction
Number of COVID-19 Outbreak in China. 2020. https://ssrn.com/abstract=3539694.
20 Sam Abbott JDM Joel Hellewell. Temporal variation in transmission during the COVID-19 outbreak.
2020. https://cmmid.github.io/topics/covid19/current-patterns-transmission/global-time-varying-
transmission.html.
21 Danon L, Brooks-Pollock E, Bailey M, Keeling MJ. A spatial model of covid-19 transmission in england
and wales: Early spread and peak timing. medRxiv 2020. DOI:10.1101/2020.02.12.20022566.
22 Pinotti F, Di Domenico L, Ortega E et al. Lessons learnt from 288 covid-19 international cases:
Importations over time, effect of interventions, underdetection of imported cases. medRxiv 2020.
DOI:10.1101/2020.02.24.20027326.
23 INSEE. Les résultats des recensements de la population..
24 DREES. Statistique annuelle des établissements de santé (SAE). https://www.sae-diffusion.sante.gouv.
fr/sae-diffusion/accueil.htm.
25 Prem K, Cook AR, Jit M. Projecting social contact matrices in 152 countries using contact surveys
and demographic data. PLOS Computational Biology 2017; 13: 1–21.
26 Yang X, Yu Y, Xu J et al. Clinical course and outcomes of critically ill patients with SARS-CoV-2
pneumonia in Wuhan, China: a single-centered, retrospective, observational study. Lancet Respir Med
2020; published online Feb.
27 Task force COVID-19 del Dipartimento Malattie Infettive e Servizio di Informatica. Sorveglianza
integrata covid-19 in italia. 2020. https://web.archive.org/web/20200314180814/https://www.epicentro.
iss.it/coronavirus/bollettino/covid-19-infografica_ita.pdf.
28 Grasselli G, Pesenti A, Cecconi M. Critical Care Utilization for the COVID-19 Outbreak in Lombardy,
Italy: Early Experience and Forecast During an Emergency Response. JAMA 2020; published online
March. DOI:10.1001/jama.2020.4031.
29 Remuzzi A, Remuzzi G. COVID-19 and Italy: what next? Lancet Health Policy 2020.
30 Lipsitch M. Seasonality of sars-cov-2: Will covid-19 go away on its own in warmer weather? https:
//web.archive.org/web/20200314112820/https://ccdd.hsph.harvard.edu/will-covid-19-go-away-on-its-
own-in-warmer-weather/.
31 Cohen J. Why do dozens of diseases wax and wane with the seasons—and will covid-19? https:
//web.archive.org/web/20200314133613/https://www.sciencemag.org/news/2020/03/why-do-dozens-
diseases-wax-and-wane-seasons-and-will-covid-19.
11You can also read