COVID-19 and Air Pollution: A Spatial Analysis of Particulate Matter Concentration and Pandemic-Associated Mortality in the US
←
→
Page content transcription
If your browser does not render page correctly, please read the page content below
International Journal of
               Environmental Research
               and Public Health

Article
COVID-19 and Air Pollution: A Spatial Analysis of Particulate
Matter Concentration and Pandemic-Associated Mortality in
the US
Brian H. Bossak * and Samantha Andritsch

                                          Department of Health and Human Performance, College of Charleston, Charleston, SC 29424, USA;
                                          andritschsc@g.cofc.edu
                                          * Correspondence: bossakbh@cofc.edu

                                          Abstract: In 2019, a novel coronavirus, SARS-CoV-2, was first reported in Wuhan, China. The virus
                                          causes the disease commonly known as COVID-19, and, since its emergence, it has infected over
                                          252 million individuals globally and taken the lives of over 5 million in the same time span. Primary
                                          research on SARS-CoV-2 and COVID-19 focused on understanding the biomolecular composition
                                          of the virus. This research has led to the development of multiple vaccines with great efficacy and
                                          antiviral treatments for the disease. The development of biomedical interventions has been crucial
                                          to combating this pandemic; additionally, environmental confounding variables that could have
                                          exacerbated the pandemic need further assessment. In this research study, we conducted a spatial
                                          analysis of particulate matter (PM) concentration and its association with COVID-19 mortality in the
                                          United States. Results of this study demonstrate a significant positive correlation between PM concen-
                                          tration levels and COVID-19 mortality; however, this does not necessarily imply a causal relationship.

                                   These results are consistent with similar studies in Italy and China, where significant COVID-19 cases
Citation: Bossak, B.H.; Andritsch, S.     and corresponding deaths were exhibited. Furthermore, maps of the data demonstrate clustering
COVID-19 and Air Pollution: A             of COVID-19 mortality which suggest further investigation into the social determinants of health
Spatial Analysis of Particulate Matter    impacting the pandemic.
Concentration and Pandemic-
Associated Mortality in the US. Int. J.   Keywords: COVID-19; pandemic; SARS-CoV-2; air pollution; spatial analysis; mortality; PM
Environ. Res. Public Health 2022, 19,
592. https://doi.org/10.3390/
ijerph19010592

Academic Editor: Paul B.                  1. Introduction
Tchounwou                                      SARS-CoV-2 is a novel virus that was first reported in Wuhan, China in December
                                          of 2019. The virus causes the disease commonly known as COVID-19, which, since its
Received: 3 December 2021
Accepted: 25 December 2021
                                          emergence, has infected over 252 million individuals globally and taken the lives of more
Published: 5 January 2022
                                          than 5 million in the same time span. As of 12 November 2021, the United States has
                                          experienced the highest number of cases, 46,868,744, with India just behind at 34,414,186,
Publisher’s Note: MDPI stays neutral      with cases still on the rise. Primary research on SARS-CoV-2 and COVID-19 was initially
with regard to jurisdictional claims in
                                          focused on understanding the biomolecular composition of the virus. This research has
published maps and institutional affil-
                                          been used to develop multiple vaccines with great efficacy and antiviral treatments for the
iations.
                                          disease. The development of biomedical interventions has been crucial to combating this
                                          pandemic; now, we need to address the environmental confounding variables that could
                                          have exacerbated the pandemic. In this research study, we conducted a spatial analysis of
Copyright: © 2022 by the authors.
                                          particulate matter (PM) concentration and its association with COVID-19 mortality in the
Licensee MDPI, Basel, Switzerland.
                                          United States. Studies in Italy and China have explored this research question, in locations
This article is an open access article    where high COVID-19 cases and corresponding deaths were exhibited. Few ecological
distributed under the terms and           studies concerning COVID-19 and PM had been conducted in the United States at the
conditions of the Creative Commons        time of analysis (summer 2021), and this research will contribute to filling that void of
Attribution (CC BY) license (https://     knowledge and information.
creativecommons.org/licenses/by/               Air pollution exists everywhere globally, although to a different extent, and concen-
4.0/).                                    trations of pollutants have been on the rise as the combustion of fossil fuels and burning

Int. J. Environ. Res. Public Health 2022, 19, 592. https://doi.org/10.3390/ijerph19010592                   https://www.mdpi.com/journal/ijerph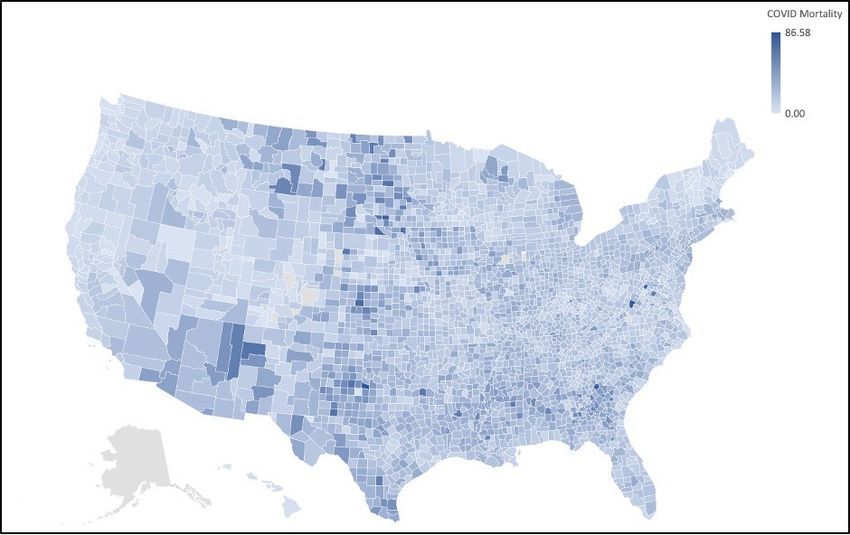
Int. J. Environ. Res. Public Health 2022, 19, 592                                                                               2 of 12

                                        of natural gas has increased. Natural events such as wildfires and volcanic eruptions can
                                        also contribute to air pollution levels. Consequently, health conditions, such as respiratory
                                        disease (RD), cardiovascular disease (CVD), nonfatal heart attacks, aggravated asthma,
                                        decreased lung function, increased infant mortality, and COPD, associated with ambient
                                        air pollution, cause 4.2 million deaths a year globally [1]. One of the primary pollutants
                                        associated with these illnesses is fine particulate matter.
                                              Particulate matter is a combination of solid particles and liquid droplets that exist
                                        suspended in the air. These particles enter the atmosphere from either primary or secondary
                                        sources. Primary sources of particulate matter are particulates emitted directly from the
                                        source, and include construction sites, smokestacks, wildfires, and agricultural operations.
                                        Secondary sources of particulate matter are sources that emit precursors for particulate mat-
                                        ter that undergo chemical/mechanical reactions in the atmosphere. Secondary sources of
                                        particulate matter include pollutants from vehicle emissions and power plants that include
                                        sulfur oxide, nitrous oxide, volatile organic compounds (VOCs), and ammonia [2]. Regula-
                                        tions on vehicle emissions and industrial pollutants to regulate the release of particulate
                                        matter precursors into the atmosphere has been beneficial in decreasing the concentration
                                        of particulate matter in the ambient air; however, concentrations are still above health
                                        regulations in some areas. In the United States (US), the Environmental Protection Agency
                                        (EPA) is the primary federal regulatory agency for protecting the environment and its
                                        interaction with human health. By order of the Clean Air Act, the EPA sets and enforces the
                                        National Ambient Air Quality Standards (NAAQS) for six common pollutants that have all
                                        been linked to negative human health outcomes when found in excess [3]. Evidence of the
                                        detrimental human health effects from particulate matter, one of the six common pollutants
                                        defined by the EPA, can be observed in historical case studies.
                                              Between 1 December and 5 December 1930, in the Meuse River Valley, Belgium,
                                        individuals began reporting symptoms of larynx irritation, coughing, chest pain, and
                                        even foaming at the mouth. Within 24 h of the first reported symptoms, more than
                                        60 individuals had died and many more were afflicted. Air pollution from numerous
                                        factories, in combination with a temperature inversion, trapped the particulate matter,
                                        creating a smog that killed many [4]. A brief 18 years later, in late October of 1948,
                                        the citizens of Donora and Webster, Pennsylvania experienced a nearly identical event.
                                        Citizens of the industrial region began mass-reporting respiratory distress, and by the
                                        end of the phenomenon, 20 citizens had died, 1440 were affected by serious illness, and
                                        another 1470 had mild to moderate symptoms. Subsequent studies of the Donora region
                                        have defined many long-term effects from the smog. A significantly excessive amount
                                        of CVD and cancer cases were reported in the decade following the smog event. In
                                        addition, core samples drawn from a nearby lake determined that after the opening of the
                                        Zinc Works industrial factory in 1915, a substantial increase in cadmium, lead, and zinc
                                        concentrations were found. Even after operations ceased, there was no visible reduction in
                                        the concentrations of cadmium or lead 70 years after the smog [5]. These contaminants are
                                        at high risk of being released into the water source if human disturbance or severe flood
                                        were to occur, subsequently causing another cascade of human health issues.
                                              The health disasters that occurred in Donora and Webster initiated a chain of events
                                        that led to the passage of the Clean Air Act in the US; however, incidents continued to occur
                                        across global space. In December of 1952, London experienced one of the worst smog events
                                        ever recorded. It is estimated that there were approximately 12,000 excess deaths during the
                                        5-day event and the subsequent 3-month period that can be directly tied to the particulate
                                        matter pollution. Similar to the previously discussed events, a temperature inversion
                                        occurred which allowed for minimal horizontal or vertical air movement near the ground.
                                        The colder temperature observed during this period exacerbated the pollution because
                                        domestic heat sources and power plants were functioning at maximum capacity to keep
                                        the citizens warm. In addition, London had just abandoned their electric trams for diesel-
                                        powered buses in July of 1952, which released an abundance of diesel emissions [6]. Traffic-
                                        related air pollutants (TRAPs) are still a large concern in the present day. A study conducted
Int. J. Environ. Res. Public Health 2022, 19, 592                                                                                 3 of 12

                                        in Finland suggests that TRAPs severely impact the functioning and interaction of astrocytes
                                        (cells that regulate homeostasis, maintain functionality, and defend the central nervous
                                        system) and microglial cells (resident immune cells of the central nervous system). Results
                                        of the study suggest that TRAPs directly induce inflammation and neurodegeneration,
                                        which can lead to many other neurological diseases [7]. Case studies such as Meuse
                                        River Valley (Belgium), Donora (Pennsylvania), and London (England) demonstrate the
                                        importance of studying the relationship between particulate matter and human health and
                                        using the research to mitigate any future health and environmental disasters.
                                              Previous research on particulate matter has demonstrated positive associations be-
                                        tween particulate matter and mortality, especially mortality due to RD and CVD. A study
                                        conducted in 2003 explored the geographical variation in the effects of particulate matter on
                                        mortality. Using Bayesian statistics, the researchers divided the US into seven geographical
                                        regions (Northwest, Upper Midwest, Industrial Midwest, Northeast, Southern California,
                                        Southwest, and Southeast) and analyzed the concentrations of coarse particulate matter
                                        ≤ 10 µm (PM10 ) and daily cause-specific mortality data for the 90 largest cities (excluding
                                        Honolulu, HI and Anchorage, AK). The analysis concluded that daily variation of PM10 is
                                        positively associated with daily variation of mortality [8]. Although there was a modest
                                        variation in relative risk between the geographical regions, the stratification of the US in this
                                        manner does not consider geographical features, industries, and lifestyles that could impact
                                        the ecological environment, which impacts the onset and virulence of disease. Analyzing
                                        the US as a whole and then drawing regional differences can more effectively demonstrate
                                        and infer which geographical features, industries, and lifestyles are responsible for the
                                        increase in particulate matter and increased disease. In 2016, a similar research study ana-
                                        lyzing the risk of asthma, myocardial infarction, and heart failure in association with fine
                                        particulate matter (PM2.5 ) concentration was conducted (defined as having an aerodynamic
                                        diameter ≤ 2.5 µm). Using advanced spatial epidemiological technologies, the research
                                        group used satellites and hierarchical Bayesian modeling to estimate PM2.5 concentrations
                                        in regions where ground monitors did not collect data. This methodology was used to
                                        study the geographical region of New York City, NY metropolitan and surrounding areas.
                                        This data collection method allowed the researchers to pull PM2.5 concentration data from
                                        multiple sources and overlay heat maps to obtain the most accurate and comprehensive
                                        PM2.5 data for the region. The use of heat maps provides great data visualization, and
                                        similar techniques are used in our research study to demonstrate where the association
                                        between COVID-19 and PM2.5 is high and low, “hot” and “cold”. In the study, the pol-
                                        lution data was tracked daily in concurrence with hospital admittance data for asthma,
                                        myocardial infarction, and heart failure, and the study concluded that high PM2.5 exposure
                                        is associated with increased risk of asthma, myocardial infarction, and heart failure [9].
                                              Comparable conclusions were made about the association between human health risk
                                        and particulate matter in studies conducted in 2017 and 2018 in Beijing, China, and Verona,
                                        Italy, respectively. However, these studies looked specifically at long-term and continuous
                                        exposure to particulate matter. Both studies analyzed mortality specifically associated with
                                        CVD and RD. The Beijing study used a generalized additive model (GAM) to estimate
                                        excess risk for CVD and RD in relation to daily mean PM2.5 concentrations. The study
                                        stratified the results into four thresholds (75 µg/m3 , 85 µg/m3 , 105 µg/m3 , and 115 µg/m3 ).
                                        The analysis concluded that individuals that were single, illiterate, and worked outdoors
                                        were more at risk for particulate matter-related CVD and RD than other demographic
                                        groups. Once the PM2.5 concentration reached 105 µg/m3 for nine consecutive days, the
                                        excess risk of CVD death for single, illiterate, or outdoor working individuals increased by
                                        as much as 45% [10]. This study supports the hypothesis that heavy industrial and mining
                                        regions may exhibit higher rates of COVID-19 mortality. In addition to infectious disease,
                                        individuals become more susceptible to chronic diseases, such as chronic obstructive
                                        pulmonary disease (COPD), in these regions, and chronic diseases can be comorbidities
                                        with COVID-19. In comparison, the study in Verona discovered that 11.3% of the total
                                        annual deaths due to CVD and RD from 2009 to 2014 can be attributed to PM2.5 pollution.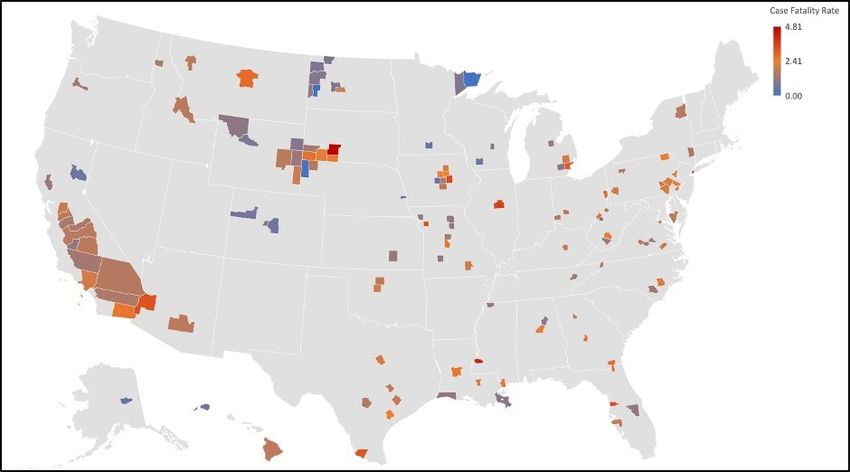
Int. J. Environ. Res. Public Health 2022, 19, 592                                                                                  4 of 12

                                        The highest causes of mortality attributed to PM2.5 pollution were for ischemic heart
                                        disease and cerebrovascular disease (stroke). This study in Verona was unique because of
                                        its geographical location in the center of Italy’s Po Valley. The Po Valley is a highly industrial
                                        and agricultural region, and, in conjunction with the valley feature, is one of the most
                                        polluted regions in the world. Over the past decades, PM2.5 and PM10 concentrations there
                                        have decreased; however, concentration levels are still consistently above the European
                                        standard of 25 µg/m3 , making particulate matter pollution an ongoing threat to human
                                        health in that region [11]. However, not all pollution is caused by anthropogenic activities.
                                        Pollution from natural events, such as wildfire, can also have adverse health effects, both
                                        chronic and associated with infectious disease.
                                              In 2020, a study took place in Montana, USA to research the delayed effect of wildfire
                                        season particulate matter pollution on the subsequent influenza season. The study ana-
                                        lyzed both short-lag (1–4 weeks) and long-lag (prior wildfire season months) effects on
                                        the following winter influenza season in Montana, USA. Using spatial regression models
                                        and a quasi-Poisson model, the study discovered no short-lag PM2.5 effect nor short-lag
                                        temperature effect on influenza. However, analysis did show that higher daily average
                                        PM2.5 concentrations during the wildfire season were positively associated with increased
                                        influenza in the following winter influenza season. Two different analyses of differing
                                        p-values (p = 0.04 and p = 0.008) demonstrated respective 16% and 22% increases in in-
                                        fluenza rate per 1 µg/m3 increase in average daily summer PM2.5 [12]. This analysis of the
                                        impact of particulate matter on a viral respiratory disease in the US supports the hypothesis
                                        that forms our research question.
                                              In addition to chronic and noninfectious diseases, particulate matter has been histor-
                                        ically associated with infectious diseases, especially coronaviruses. Coronaviruses are a
                                        family of viruses that range from the common cold to severe acute respiratory syndrome
                                        (SARS). SARS, Middle Eastern respiratory syndrome (MERS), and COVID-19 are all in this
                                        family of coronaviruses. SARS first surfaced in 2002 and 2003 in Beijing, China. In compari-
                                        son to COVID-19, SARS exhibited an extremely high global case fatality rate of up to 15%.
                                        Although more fatal, SARS could only spread from asymptomatic individuals, whereas
                                        individuals with COVID-19 can infect others several days prior to exhibiting any symptoms.
                                        This is one of the reasons why SARS-CoV-2, a very similar virus to SARS-CoV, has evolved
                                        from an epidemic to a pandemic. However, the biomolecular and symptomatic similarities
                                        of COVID-19 and SARS sparked similar ecological investigations into the relationship
                                        between ambient air quality and the virus.
                                              A 2003 ecological study following the SARS epidemic found a strong correlation
                                        (correlation coefficient of 0.8568; p-value = 0.0636) between PM10 air pollution and SARS
                                        fatality. This study gathered air pollution index (API) and SARS fatality data from five
                                        geographical regions in China (Guangdong, Shanxi, Hebei, Beijing, and Tianjin). Rela-
                                        tive risk (RR) and 95% confidence intervals were calculated for the data using Statistical
                                        Analysis Software (SAS). Final data analysis demonstrated APIs in Guangdong, Shanxi,
                                        Hebei, Beijing, and Tianjin during April and May to be 75, 95, 98, 99, and 104, and the
                                        corresponding case-fatality rates were 3.84%, 5.36%, 5.58%, 7.66%, and 8%, respectively.
                                        In addition, short-term and long-term PM exposures were analyzed, and both concluded
                                        an association between PM exposure and SARS fatality [13]. In 2005, a study focused on
                                        the region of Beijing, specifically, came to similar conclusions. In addition to analyzing the
                                        relationship between pollution and SARS fatality, this more recent study included meteo-
                                        rological variables (daily mean temperature, relative humidity, and dew point) collected
                                        from the State Meteorological Administration. Using a generalized additive model (GAM)
                                        with log link and Poisson error, the study produced relative risks that were statistically
                                        significant for PM10 and NO2 with a 4- or 5-day lag. However, the study did not find any
                                        significant association between daily SO2 concentration and SARS mortality with lags up
                                        to 6 days [14].
                                              In the first year after COVID-19 emerged, ecological studies analyzing the relationship
                                        between particulate matter and COVID-19 mortality grew exponentially, especially in
Int. J. Environ. Res. Public Health 2022, 19, 592 5 of 12
China and Italy. An Italian study looked at the spatial variation and patterns between
PM10 and PM2.5 in comparison to COVID-19 incidence proportions and death rates using
adjusted regression models. The study found that both fine and coarse particulate matter
are positively associated with COVID-19 cases and deaths, and consequently explain the
heterogenous distribution of COVID-19 cases and deaths in Italian provinces [15]. A similar
study conducted in Wuhan, China used multivariate linear regression to conduct a temporal
comparison between PM10 and PM2.5 concentrations with the case fatality rate (CFR) of
COVID-19 in Wuhan. The temporal variation curves for particulate matter concentrations
and COVID-19 CFR exhibited strong similarities. Results of the study found a positive
relationship (r > 0.65, p ≤ 0.00003) between PM10 and PM2.5 concentrations and the COVID-
19 CFR [16]. An additional meta-analysis offered an indirect impact of particulate matter on
mortality of COVID-19 due to overexpression of ACE-2 receptors in the lungs. As explained
in the article, the inhalation of large quantities of particulate matter causes inflammation
in the lungs. This immune response stimulates several immune pathways, including the
overexpression of ACE-2 receptors [17].
The research results found in Italy’s Po Valley and China correlating increased PM
pollution to increased COVID-19 mortality prompted the study here. However, both of
these prior studies focused on their respective geographic locations. Analysis of the PM
relationship with COVID-19 mortality in the US was still relatively absent from literature at
the conception of this study. Therefore, we were motivated to explore the spatiotemporal
association between PM2.5 and COVID-19 mortality within the continental US and Hawaii
(due to a lack of data consistency at the time of the analysis, Alaska was not included in the
study population).
2. Materials and Methods
To evaluate the association between COVID-19 mortality and PM2.5 concentration
in the United States, county-level data was collected. COVID-19 data was collected from
USAFacts on 7 June 2021. USAFacts collects the raw COVID-19 county data exclusively
from approximately 70 different government agencies, including varying commissions,
bureaus, and departments. Raw COVID-19 case numbers and total deaths were provided
for each individual county [18]. The mortality rate per 10,000 for each county was calculated
in MS Excel (Microsoft Corporation, Redmond, WA, USA) using Equation (1).
Total Deaths
( × 10, 000) (1)
Population
PM2.5 data was collected from the CDC National Environmental Public Health Track-
ing Network for the year 2016, the most recent annual data [19]. Population data for each
county was collected from the United States Department of Agriculture (USDA) Economic
Research Service. The USDA county population data was derived from the United States
Census Bureau and was last updated on 13 May 2020 [20]. Alaskan counties were excluded
from this study due to a lack of particulate matter data at the time of the study.
All data was organized in Excel, and repopulated into SPSS (IBM Corporation, New
York, NY, USA) for analysis. Descriptive statistics (N, minimum, maximum, mean, standard
deviation) were calculated in SPSS for all variables. Next, a Kolmogorov–Smirnov (K–S)
test was conducted to check for normality in the dataset using Equation (2).
D = Maximum| Fo ( X ) − Fr ( X )| (2)
To analyze the correlation between the variables we then utilized both a Spearman’s
rho and Kendall’s tau analysis. The equations for each, respectively, are represented below.
6 ∑ d2i
ρ = 1− (3)
n ( n2 − 1)Int. J. Environ. Res. Public Health 2022, 19, 592 6 of 12
P−Q
tb = p (4)
( P + Q + X0 )( P + Q + Y0 )
A Spearman’s rho correlation test is for nonparametric ordinal, interval, or ratio data.
This test determines the strength and direction of a correlation assuming a monotonic
relationship between the two variables. Similarly, a Kendall’s tau rank correlation test was
conducted due to the nonparametric nature of the dataset. Kendall’s tau assumes that
the variables are either continuous or ordinal, and that the variables have a monotonic
relationship. Following the primary data analysis, the Excel 3D Maps tool was used to
create a data visualization. A gradient color scale was used to depict the varying levels of
COVID-19 mortality and PM2.5 annual average concentration levels, similar to a heat map.
The maps were stratified by county, and each map represents the spatial distribution of an
individual variable.
3. Results
All variable correlations were statistically significant at the 0.01 alpha level (2-tailed),
as depicted in Tables 1 and 2. Considering the large sample of 3110 counties included in
this study, these results demonstrate a significant association between COVID-19 mortality
and fine particulate matter concentrations.
Table 1. Kendall’s tau correlation analysis.
COVID-19 COVID-19 COVID-19 Daily PM2.5
Cases Deaths Mortality Rate Annual Average
COVID-19 Cases 1.000 0.785 −0.064 0.254
COVID-19
0.785 1.000 0.124 0.309
Deaths
COVID-19
−0.064 0.124 1.000 0.140
Mortality Rate
Daily PM2.5
0.254 0.309 0.140 1.000
Annual Average
All correlations are statistically significant at the 0.01 alpha level.
Table 2. Spearman’s rho correlation analysis.
COVID-19 COVID-19 COVID-19 Daily PM2.5
Cases Deaths Mortality Rate Annual Average
COVID-19 Cases 1.000 0.931 −0.085 0.365
COVID-19
0.931 1.000 0.190 0.440
Deaths
COVID-19
−0.085 0.190 1.000 0.203
Mortality Rate
Daily PM2.5
0.365 0.440 0.203 1.000
Annual Average
All correlations are statistically significant at the 0.01 alpha level.
Some correlation coefficients of particular interest include Kendall’s tau correlation
analysis between COVID-19 deaths and daily PM2.5 annual average (r = 0.309), Spear-
man rho correlation analysis between COVID-19 deaths and daily PM2.5 annual average
(r = 0.440), and Spearman rho correlation analysis between COVID-19 cases and daily
PM2.5 annual average (r = 0.365). From the results of the statistical analysis and visual
interpretation of the maps, we can conclude that there is a significant positive correlation
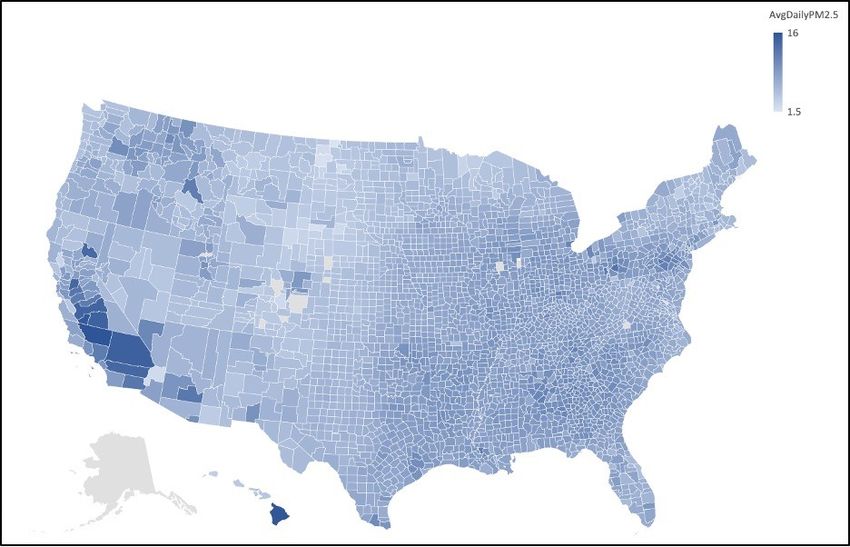
between COVID-19 mortality rate and PM2.5 concentration. Figures 1 and 2 depict the
regions of high and low COVID-19 mortality rates and PM2.5 concentration for all counties
in the United States, excluding Alaska.0.440), and Spearman rho correlation analysis between COVID-19 cases and daily PM₂.₅
0.440), and
annual Spearman
average (r = rho correlation
0.365). From theanalysis between
results of theCOVID-19
statistical cases and and
analysis dailyvisual
PM₂.₅
annual average
interpretation (r =maps,
of the 0.365).
we From the results
can conclude of the
that there is astatistical
significantanalysis
positive and visual
correlation
interpretation of the maps, we can conclude that there is a significant positive
between COVID-19 mortality rate and PM₂.₅ concentration. Figures 1 and 2 depict the correlation
Int. J. Environ. Res. Public Health 2022,between
19, 592 7 ofthe
12
regions ofCOVID-19
high and lowmortality rate mortality
COVID-19 and PM₂.₅ concentration.
rates Figures 1 and
and PM₂.₅ concentration for2all
depict
counties
regions
in of high
the United and low
States, COVID-19
excluding mortality rates and PM₂.₅ concentration for all counties
Alaska.
in the United States, excluding Alaska.
Figure 1.
Figure 1. Average daily PM
Average daily PM₂.₅ map
map of
of U.S.
U.S. counties.
counties. Map
Map of
of the
the average
average daily PM₂.₅ for
daily PM for each
each country
country
Figure 1. Average daily 2.5 map
PM₂.₅ of U.S.Clusters
counties. 2.5 for
in the United States, excluding Alaska. ofMap of the
higher average
PM₂.₅ daily PM₂.₅
concentration can beeachseencountry
in the
in the United
in the United States, excluding Alaska. Clusters of higher PM 2.5 concentration can be seen in
can be seen in the
Detroit, MI andStates, excluding
Philadelphia, PAAlaska.
regions,Clusters of higher
California’s PM₂.₅
Central concentration
Valley, and in Hawaii. the
Detroit, MI and Philadelphia, PA regions, California’s Central Valley, and in Hawaii.
Detroit, MI and Philadelphia, PA regions, California’s Central Valley, and in Hawaii.
Figure 2. COVID-19 mortality totals of U.S. counties map. Map of the COVID-19 mortality rate per
10,000 by county in the United States, excluding Alaska. Clusters of high COVID-19 mortality can be
observed in the Upper Midwest, Southwest, and South.Int. J. Environ. Res. Public Health 2022, 19, x 8 of 12
Figure 2. COVID-19 mortality totals of U.S. counties map. Map of the COVID-19 mortality rate per
Int. J. Environ. Res. Public Health 2022, 19, 592 8 of 12
10,000 by county in the United States, excluding Alaska. Clusters of high COVID-19 mortality can
be observed in the Upper Midwest, Southwest, and South.
In addition to the general study that encompassed all United States counties (minus
Alaska), we conducted a substudy to identify clusters of high COVID-19 mortality and
high PM 2.5 concentration.
PM₂.₅ concentration.ToTo complete
completethis this
study, the particulate
study, matter data
the particulate matterwasdata
stratified
was
into low, medium,
stratified into low, and high groups.
medium, and high Atgroups.
least 30Atdata points
least werepoints
30 data selected
werefrom each strata
selected from
and depicted
each strata and viadepicted
Excel 3Dviamaps.
Excel 3D maps.
Results of a Pearson correlation found that in the high strata, there was a significant
negative correlation
negative correlation between
betweenthe theCFR
CFRand andPM₂.₅
PM2.5asaswell
wellasasthe
the mortality
mortality rate
rate andand PM2.5
PM₂.₅ at
at the
the 0.050.05 level.
level. This
This analysis
analysis contradictsthe
contradicts thefindings
findingsofofthetheoverall
overallstudy.
study. Analyzing
Analyzing the
maps inin Figures
Figures33andand4,4,we
wecan see
can that
see counties
that countiesin the Upper
in the UpperMidwest, where
Midwest, PM2.5
where is low,
PM₂.₅ is
inversely
low, have have
inversely high case
highfatality rates from
case fatality rates COVID-19.
from COVID-19. The rural
The nature of the of
rural nature region opens
the region
opportunities
opens for further
opportunities for investigation into the level
further investigation intoof the
access to adequate
level of accesshealthcare
to adequateand
other social determinants of health that could influence this inverse
healthcare and other social determinants of health that could influence this inverse relationship between
PM2.5 concentrations
relationship between and
PM₂.₅ COVID-19 CFR inand
concentrations theCOVID-19
region. CFR in the region.
Figure
Figure 3.3.Substudy
Substudy average
average dailydaily
PM2.5PM₂.₅
map ofmap of U.S. counties.
U.S. counties. Map of matter
Map of particulate particulate matter
concentration
concentration levels by county for the stratified substudy. High PM₂.₅ concentrations are
levels by county for the stratified substudy. High PM2.5 concentrations are concentrated in California’s
concentrated in California’s Central Valley and Hawaii. The middle strata are evenly dispersed
Central Valley and Hawaii. The middle strata are evenly dispersed across the eastern United States,
across the eastern United States, and low PM₂.₅ levels are concentrated in the Upper Midwest.
and low PM2.5 levels are concentrated in the Upper Midwest.
4. Discussion
Analysis of the maps created in our study demonstrated small clusters of counties
for both COVID-19 mortality and PM2.5 concentrations. The first group of clusters that
indicates an association between air pollution and COVID-19 mortality is located in the
Upper Midwest (Iowa, Nebraska, Wyoming, South Dakota, and North Dakota). The small
clusters in this region suggest possible associations with social determinants of health in
terms of mortality correlations. The rural environment that exists in this region contributes
negatively to many of the social determinants of health. Poverty, proximity to healthcare
facilities, and health literacy are all associated with rural environments and are all additional
variables that could contribute to increased mortality rate in their respective counties. In
addition, the Upper Midwest is home to multiple Native American reservations. The
Native American population is more vulnerable to COVID-19 due to the “prevalence
of underlying chronic health conditions, lack of institutional resilience, the relationshipInt. J. Environ. Res. Public Health 2022, 19, 592 9 of 12
between the federal government and tribal governments, and lack of social trust” [21].
Additionally, a CDC Morbidity and Mortality Weekly Report (MMWR) suggested that
American Indian and Alaska Native (AI/AN) persons experience a COVID-19 incidence
3.5 times higher than their white neighbors. However, this elevated incidence is influenced
by other socioeconomic factors that could possibly facilitate the spread of the virus, such
as reliance on shared transportation, lack of running water, and large household size
Int. J. Environ. Res. Public Health 2022,(multigenerational
19, x 9 of 12
households) [22]. Similar cluster patterns can be seen in the Southwest,
where Native American reservations are also prevalent.
Figure 4.
Figure 4. Substudy
Substudy case
casefatality
fatalityrate
rateofofU.S.
U.S.counties
counties map.
map. Map
Map of of case
case fatality
fatality rates
rates by county
by county for
for the
the stratified substudy. High CFRs are observed in California’s Central Valley in addition to the
stratified substudy. High CFRs are observed in California’s Central Valley in addition to the Upper
Upper Midwest where low PM₂.₅ concentrations were observed.
Midwest where low PM2.5 concentrations were observed.
4. Discussion
Clusters of counties were also demonstrated on the map depicting elevated PM2.5
Analysis ofTwo
concentrations. theareas
mapswith
created in ourclusters
correlated study demonstrated smallMI,
were in the Detroit, clusters of counties
and Philadelphia,
for both COVID-19 mortality and PM₂.₅ concentrations. The first group
PA cities and surrounding counties. Detroit is an urban center that has a large population. of clusters that
indicates an association between air pollution and COVID-19 mortality
In addition to traditional urban density of activity, Detroit is a global hub for many indus- is located in the
UpperSome
tries. Midwestof the(Iowa, Nebraska,
highly pollutingWyoming,
industries South Dakota,include:
in Detroit and North Dakota).
an oil refinery,Theasmall
steel
clusters
mill, in this region
a wastewater suggestplant,
treatment possibleandassociations with social
coal- and gas-fired determinants
power plants [23]. of Similarly,
health in
terms of mortality
Philadelphia, correlations.
the location The
of a cluster ruralmap,
on our environment that existscity.
is an industry-packed in this region
One final,
contributes and greatly
negatively to manysignificant, spatial
of the social anomaly demonstrated
determinants on theproximity
of health. Poverty, PM2.5 map to
is the extremely
healthcare high
facilities, concentration
and health literacy levels in associated
are all the counties withof rural
California’s Centraland
environments Valley.
are
The valley’s geographical
all additional variables thatfeature has been associated
could contribute to increased with climaterate
mortality inversion
in theirevents that
respective
trap air in In
counties. theaddition,
valley, leading to increased
the Upper Midwestpollution
is homeand stagnant
to multipleair [24]. Similar
Native clima-
American
tology is exhibited
reservations. in Italy’s
The Native Po Valley,
American one ofisthe
population morehotvulnerable
spots for COVID-19
to COVID-19 early
dueinto the
pandemic
“prevalence [25].
of Research
underlying conducted by Zlatev
chronic health and his associates
conditions, has demonstrated
lack of institutional resilience,thatthe
as
climate change progresses and temperatures rise, corresponding
relationship between the federal government and tribal governments, and lack of socialair pollution levels will
rise concurrently
trust” [26,27]. Ifathis
[21]. Additionally, CDCtrend continues,
Morbidity and living in valley
Mortality regions
Weekly such as
Report Central
(MMWR)
Valley and Po Valley will be a severe comorbid exposure for
suggested that American Indian and Alaska Native (AI/AN) persons experience any kind of respiratory illness.
a
Prior to the study, we did not anticipate that Hawai’i County
COVID-19 incidence 3.5 times higher than their white neighbors. However, this elevated would have some of
the highestislevels
incidence of annual
influenced particulate
by other matter pollution.
socioeconomic factors thatAfter further
could investigation,
possibly we
facilitate the
discovered that, whereas Honolulu and Maui have some of the cleanest
spread of the virus, such as reliance on shared transportation, lack of running water, and air in the country,
volcanic activity size
large household from(multigenerational
Kı̄lauea emits enormous amounts
households) [22].ofSimilar
PM2.5 and sulfur
cluster dioxide
patterns caninto
be
seen in the Southwest, where Native American reservations are also prevalent.
Clusters of counties were also demonstrated on the map depicting elevated PM₂.₅
concentrations. Two areas with correlated clusters were in the Detroit, MI, and
Philadelphia, PA cities and surrounding counties. Detroit is an urban center that has aInt. J. Environ. Res. Public Health 2022, 19, 592 10 of 12
the air [28]. Interestingly, even with such high levels of PM2.5 , the COVID-19 mortality
rates in Hawai’i were well below the national average and what would be expected based
on the results of this study. It is unclear why Hawai’i County is an outlier in this study,
but confounding variables, such as population density, lifestyle habits, isolation of the
island, and medical practices, could all impact the COVID-19 mortality rate. Some recent
studies have found associations between vitamin D levels and COVID-19. Current research
suggests that those with higher levels of vitamin D, which is to be expected in the Hawaiian
population, have generally better COVID-19 outcomes. In fact, the Northern Hemisphere
has borne most of the burden of cases and deaths for COVID-19, with the exception of
the Nordic countries [29,30]. Furthermore, it is evident that individual factors, such as
exercise, diet, and vitamin D exposure, in addition to structural policy issues, such as
essential worker exposure, blue- vs. white-collar exposure, and nonuniversal healthcare
coverage, concurrently influence an individual’s risk of contracting, and possibly dying
from, the COVID-19 virus [31–35]. Moreover, individual risk factors related to age [36] and
obesity [37] have also been associated with severity of COVID-19 disease.
Based on the methodology of this research, we cannot attribute causation to these
variables; however, the results of this study and similar studies in the US, China, and Italy
warrant further investigation into a possible association between high PM2.5 concentrations
and increased COVID-19 mortality rates.
5. Conclusions
The results of this study add valuable information to the ever-growing data on COVID-
19. However, the study does raise many questions and variables for further investigation.
The clustering of high mortality rates in rural regions in the Upper Midwest and somewhat
in the Southwest and South allude to the intervention of social determinants that could
influence health outcomes. Specifically, social and healthcare structures on Native American
reservations that are present in the Upper Midwest and Southwest regions may have been
associated with the anomalously high COVID-19 mortality observed in rural counties
colocated there. Investigations on how to improve health systems and communication
on these reservations would be suggested in order to prepare for any future epidemics.
Additionally, the high PM2.5 concentrations and low mortality rates on the island of Hawaii
warrant further investigation. Individual risk factors related to age, obesity, diet, vitamin D
levels, and physical activity are all variables that could influence the inverse relationship
between COVID-19 mortality and PM2.5 concentrations on the island.
Author Contributions: Conceptualization, S.A. and B.H.B.; Methodology, S.A. and B.H.B.; Validation,
S.A. and B.H.B.; Formal Analysis, S.A.; Investigation, S.A. and B.H.B.; Resources, S.A. and B.H.B.;
Data Curation, S.A. and B.H.B.; Writing—Original Draft Preparation, S.A. and B.H.B.; Writing—
Review and Editing, S.A. and B.H.B.; Visualization, S.A. and B.H.B.; Supervision, B.H.B.; Project
Administration, S.A. and B.H.B.; Funding Acquisition, S.A. and B.H.B. All authors have read and
agreed to the published version of the manuscript.
Funding: This work was supported by a Summer Undergraduate Research Funding (SURF) award
at the College of Charleston. Funding for a component of this project was provided through a CPIE
award from the School of Education, Health, and Human Performance at the College of Charleston.
Institutional Review Board Statement: Not applicable.
Informed Consent Statement: Not applicable.
Data Availability Statement: Publicly available datasets were analyzed in this study. This data can
be found here: https://usafacts.org/visualizations/coronavirus-covid-19-spread-map/ (accessed
on 7 June 2021); https://data.ers.usda.gov/reports.aspx?ID=17827 (accessed on 9 June 2021); https:
//ephtracking.cdc.gov (accessed on 1 June 2021).Int. J. Environ. Res. Public Health 2022, 19, 592 11 of 12
Acknowledgments: We thank the School of Education, Health, and Human Performance for sup-
porting a portion of this research through a Center for Partnerships to Include Education (CPIE)
award and thank the Undergraduate Research and Creative Activities (URCA) office at the College
of Charleston.
Conflicts of Interest: The authors declare no conflict of interest.
References
1. World Health Organization. Available online: https://www.who.int/health-topics/air-pollution#tab=tab_2 (accessed on
18 December 2021).
2. Valley Air District. Available online: https://www.valleyair.org/Air_Quality_Plans/AQ_plans_PM_sourcs.htm (accessed on
17 September 2021).
3. United States Environmental Protection Agency. Available online: https://www.epa.gov/criteria-air-pollutants (accessed on
18 December 2021).
4. Nemery, B.; Hoet, P.H.M.; Nemmar, A. The Meuse Valley fog of 1930: An air pollution disaster. Lancet 2001, 357, 704. [CrossRef]
5. Jacobs, E.T.; Burgess, J.L.; Abbott, M.B. The Donora Smog Revisited: 70 Years After the Event That Inspired the Clean Air Act.
Am. J. Public Health 2018, 108, S85–S88. [CrossRef] [PubMed]
6. Hunt, A.; Abraham, J.L.; Judson, B.; Berry, C.L. Toxicologic and Epidemiologic Clues from the Characterization of the 1952
London Smog Fine Particulate Matter in Archival Autopsy Lung Tissues. Environ. Health Perspect. 2003, 111, 1209. [CrossRef]
7. Gómez-Budia, M.; Konttinen, H.; Saveleva, L.; Korhonen, P.; Jalava, P.I.; Kanninen, K.M.; Malm, T. Glial smog: Interplay between
air pollution and astrocyte-microglia interactions. Neurochem. Int. 2020, 136, 104715. [CrossRef] [PubMed]
8. Dominici, F.; McDermott, A.; Zeger, S.L.; Samet, J.M. National Maps of the Effects of Particulate Matter on Mortality: Exploring
Geographical Variation. Environ. Health Perspect. 2003, 111, 39. [CrossRef]
9. Weber, S.A.; Insaf, T.Z.; Hall, E.S.; Talbot, T.O.; Huff, A.K. Assessing the impact of fine particulate matter (PM2.5 ) on respiratory-
cardiovascular chronic diseases in the New York City Metropolitan area using Hierarchical Bayesian Model estimates. Environ.
Res. 2016, 151, 399–409. [CrossRef] [PubMed]
10. Wang, J.; Yin, Q.; Tong, S.; Ren, Z.; Hu, M.; Zhang, H. Prolonged continuous exposure to high fine particulate matter associated
with cardiovascular and respiratory disease mortality in Beijing, China. Atmos. Environ. 2017, 168, 1–7. [CrossRef]
11. Pozzer, A.; Bacer, S.; Sappadina, S.; Predicatori, F.; Caleffi, A. Long-term concentrations of fine particulate matter and impact on
human health in Verona, Italy. Atmos. Pollut. Res. 2018, 10, 731–738. [CrossRef]
12. Landguth, E.L.; Holden, Z.A.; Graham, J.; Stark, B.; Mokhtari, E.B.; Kaleczyc, E.; Anderson, S.; Urbanski, S.; Jolly, M.; Semmens,
E.O.; et al. The delayed effect of wildfire season particulate matter on subsequent influenza season in a mountain west region of
the USA. Environ. Int. 2020, 139, 105668. [CrossRef]
13. Chui, Y.; Zhang, Z.-F.; Froines, J.; Zhao, J.; Wang, H.; Yu, S.-Z.; Detels, R. Air pollution and case fatality of SARS in the People’s
Republic of China: An ecologic study. Environ. Health A Glob. Access Sci. Source 2003, 2, 15.
14. Kan, H.D.; Chen, B.H.; Fu, C.W.; Yu, S.Z.; Mu, L.N. Relationship between ambient air pollution and daily mortality of SARS in
Beijing. Biomed. Environ. Sci. 2005, 18, 1–4.
15. Bianconi, V.; Bronzo, P.; Banach, M.; Sahebkar, A.; Mannarino, M.R.; Pirro, M. Particulate matter pollution and the COVID-19
outbreak: Results from italian regions and provinces. Arch. Med. Sci. 2020, 16, 985–992. [CrossRef]
16. Yao, Y.; Pan, J.; Liu, Z.; Meng, X.; Wang, W.; Kan, H.; Wang, W. Temporal association between particulate matter pollution and
case fatality rate of COVID-19 in Wuhan. Environ. Res. 2020, 189, 109941. [CrossRef] [PubMed]
17. Khan, Z.; Ualiyeva, D.; Khan, A.; Zaman, N.; Sapkota, S.; Khan, A.; Ali, B.; Ghafoor, D. A Correlation among the COVID-19
Spread, Particulate Matters, and Angiotensin-Converting Enzyme 2: A Review. J. Environ. Public Health 2021, 2021, 5524098.
[CrossRef] [PubMed]
18. USAFacts. Available online: https://usafacts.org/visualizations/coronavirus-covid-19-spread-map/ (accessed on 25 June 2021).
19. Centers for Disease Control and Prevention. Available online: www.cdc.gov/ephtracking (accessed on 16 August 2021).
20. United States Department of Agriculture Economic Research Service. Available online: https://data.ers.usda.gov/reports.aspx?
ID=17827 (accessed on 17 September 2021).
21. Wang, H. Why the Navajo Nation was hit so hard by coronavirus: Understanding the disproportionate impact of the COVID-19
pandemic. Appl. Geogr. 2021, 134, 102526. [CrossRef]
22. Hatcher, S.M.; Agnew-Brune, C.; Anderson, M.; Zambrano, L.D.; Rose, C.E.; Jim, M.A.; Baugher, A.; Liu, G.S.; Patel, S.V.; Evans,
M.E.; et al. COVID-19 among American Indian and Alaska native persons—23 states, January 31–July 3, 2020. 2020. Morb. Mortal.
Wkly. Rep. 2020, 69, 1166. [CrossRef]
23. Air pollutant Sources, Exposures, & Health Impacts. Available online: http://caphedetroit.sph.umich.edu/air-pollutant-source-
exposures-health-impacts/ (accessed on 17 September 2021).
24. San Joaquin Valley Air Pollution Control District. Available online: https://www.valleyair.org/newsed/ca_primer/bigpicture/
IIIA4a.html (accessed on 17 September 2021).Int. J. Environ. Res. Public Health 2022, 19, 592 12 of 12
25. Gray, E.; Gilardoni, S.; Sartini, C.; Baldocchi, D.D.; Facchini, C.; Goldstein, A.H. Unraveling the influences of pollution and climate
trends on radiation fog frequency: A comparison of California’s Central Valley and Italy’s Po Valley. In Proceedings of the AGU
Fall Meeting Abstracts, Washington, DC, USA, 10–14 December 2018; Volume 2018.
26. Zlatev, Z.; Moseholm, L. Impact of climate changes on pollution levels in Denmark. Ecol. Model. 2008, 217, 305–319. [CrossRef]
27. Zlatev, Z.; Georgiev, K.; Dimov, I. Influence of climatic changes on pollution levels in the Balkan Peninsula. Comput. Math. Appl.
2013, 65, 544–562. [CrossRef]
28. American Lung Association. Available online: https://www.lung.org/research/sota/city-rankings/states/hawaii/hawaii
(accessed on 18 September 2021).
29. Bossak, B.H.; Turk, C.A. Spatial Variability in COVID-19 Mortality. Int. J. Environ. Res. Public Health 2021, 18, 5892. [CrossRef]
30. Mitchell, F. Vitamin-D and COVID-19: Do deficient risk a poorer outcome? Lancet Diabetes Endocrinol. 2020, 8, 570. [CrossRef]
31. Lee, S.W.; Lee, J.; Moon, S.Y.; Jin, H.Y.; Yang, J.M.; Ogino, S.; Song, M.; Hong, S.H.; Ghayda, R.A.; Kronbichler, A.; et al. Physical
activity and the risk of SARS-CoV-2 infection, severe COVID-19 illness and COVID-19 related mortality in South Korea: A
nationwide cohort study. Br. J. Sports Med. 2021, 1–13. [CrossRef] [PubMed]
32. Salgado-Aranda, R.; Pérez-Castellano, N.; Núñez-Gil, I.; Orozco, A.J.; Torres-Esquivel, N.; Flores-Soler, J.; Chamaisse-Akari, A.;
Mclnerney, A.; Vergara-Uzcategui, C.; Wang, L.; et al. Influence of baseline physical activity as a modifying factor on COVID-19
mortality: A single-center, retrospective study. Infect. Dis. Ther. 2021, 10, 801–814. [CrossRef]
33. Lange, K.W. Food science and COVID-19. Food Sci. Hum. Wellness 2021, 10, 1–5. [CrossRef]
34. Wang, M.L.; Behrman, P.; Dulin, A.; Baskin, M.L.; Buscemi, J.; Alcaraz, K.I.; Goldstein, C.M.; Carson, T.L.; Shen, M.; Fitzgibbon, M.
Addressing inequities in COVID-19 morbidity and mortality: Research and policy recommendations. Transl. Behav. Med. 2020, 10,
516–519. [CrossRef]
35. Fielding-Miller, R.K.; Sundaram, M.E.; Brouwer, K. Social determinants of COVID-19 mortality at the county level. PLoS ONE
2020, 15, e0240151. [CrossRef] [PubMed]
36. Mallapaty, S. The coronavirus is most deadly if you are old and male. Nature 2020, 585, 16–17. [CrossRef]
37. Kuehn, B.M. More Severe Obesity Leads to More Severe COVID-19 in Study. JAMA 2021, 325, 1603. [CrossRef]You can also read