SOIL DEFORMATION ANALYSIS THROUGH FLUID-DYNAMIC MODELLING AND DINSAR MEASUREMENTS: A FOCUS ON GROUNDWATER WITHDRAWAL IN THE RAVENNA AREA (ITALY)
←
→
Page content transcription
If your browser does not render page correctly, please read the page content below
Bollettino di Geofisica Teorica ed Applicata                                  Vol. 62, n.2, pp. 301-318; June 2021
DOI 10.4430/bgta0350

               Soil deformation analysis through fluid-dynamic modelling
               and DInSAR measurements: a focus on groundwater
               withdrawal in the Ravenna area (Italy)
               I. Antoncecchi1,2, F. Ciccone1,3, G. Rossi1, G. Agate2, F. Colucci2,
               F. Moia2, M. Manzo4, R. Lanari 4, M. Bonano 4, C. De Luca4,
               L. Calabres5, L. Perini5, P. Severi5, G. Pezzo6, P. Macini7,
               C. Benetatos8, V. Rocca8, E. Carminati9, A. Billi10 and L. Petracchini10
               1
                  Ministero dello Sviluppo Economico, Direzione Generale per le Infrastrutture e la
                  Sicurezza dei Sistemi Energetici e Geominerari (ex DGS-UNMIG), Roma, Italy
               2
                  Ricerca Sistema Energetico, RSE S.p.A., Milano, Italy
               3
                  Consiglio Nazionale delle Ricerche, CNR-ISMAR, Bologna, Italy
               4
                  Consiglio Nazionale delle Ricerche, CNR-IREA, Napoli, Italy
               5
                  Regione Emilia-Romagna, Bologna, Italy
               6
                  Istituto Nazionale di Geofisica e Vulcanologia, Osservatorio Nazionale Terremoti,
                  Roma, Italy
               7
                  Dipartimento di Ingegneria Civile, Chimica, Ambientale e dei Materiali, DICAM,
                  Università di Bologna, Italy
               8
                  Dipartimento di Ingegneria dell’Ambiente, del Territorio e delle Infrastrutture,
                  Politecnico di Torino, Italy
               9
                  Dipartimento di Scienze della Terra, Università La Sapienza, Roma, Italy
               10
                  Consiglio Nazionale delle Ricerca, CNR-IGAG, Roma, Italy

               (Received: 22 May 2020; accepted: 15 December 2020)

ABSTRACT       This study aims at assessing the deformation processes affecting an area NW of the
               city of Ravenna (northern Italy), caused by groundwater withdrawal activities. In-situ
               data, geologic and structural maps, piezometric measurements, underground water
               withdrawal volumes, and satellite C-band SAR data were used to jointly exploit two
               different techniques: 1) fluid-dynamic and geomechanical modelling (by RSE S.p.A),
               and 2) Differential Synthetic Aperture Radar Interferometry (DInSAR) analysis (by
               CNR - IREA). The results of the comparative analysis presented in this work brought
               new evidence about the contribution of groundwater withdrawal to the total subsidence
               affecting the area during the 2000-2017 time interval. In particular, they show an
               increase of the subsidence from year 2000 to 2010 and a decrease from year 2010 to
               2017. These results are generally in line with groundwater withdrawal data that report
               a reduction of the extracted water volumes during the considered temporal interval.
               Meantime, they show a delay effect in the subsidence process, partially recovered
               during the 2010-2017 thanks to a stabilisation of the extracted groundwater volumes.
               The presented results shade new light on the groundwater withdrawal contribution to
               the subsidence of the analysed zone, although further investigations are foreseen to
               better clarify the ongoing scenario.

Key words:     Soil deformation, DInSAR analysis, numerical simulation, fluid-dynamic modelling, groundwater
               withdrawal.

© 2021 - OGS                                                                                                301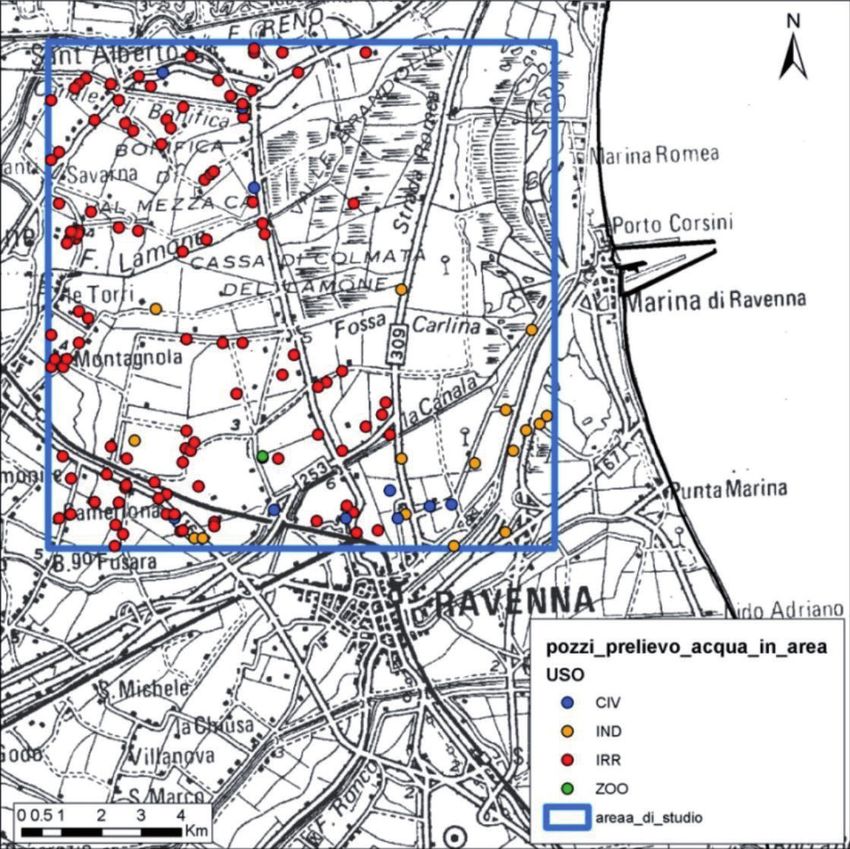
Boll. Geof. Teor. Appl., 62, 301-318 Antoncecchi et al.
1. Introduction
Subsidence and local uplift are processes frequently observed in the Po Plain area (northern
Italy) and in the Adriatic off-shore have been the focus of numerous investigations (e.g. Gambolati
et al., 1991; Teatini et al., 1998; Gambolati and Teatini, 2015; Benetatos et al., 2017, 2020; Coti et
al., 2018). Subsidence and local uplift in the Po Plain area can be attributed to several climate driven
factors like floods, Messinian salinity crisis, regional uplift, and loss of accommodation space in
Po basin (Carminati and Martinelli, 2002; Scardia et al., 2012; Amadori et al., 2018). Subsidence
in the Adriatic Sea coastline, in particular, can be ascribed to different natural and anthropogenic
factors locally impacting in different manner: tectonic movements, glacial isostatic adjustment,
natural sediments compaction, reclaimed peatland oxidation, groundwater withdrawal, oil and
gas extraction, and storage (Bertoni et al., 1995; Carminati and Martinelli, 2002; Carminati et al.,
2003b; Teatini et al., 2005; Fiaschi et al., 2017). These processes are particularly marked along
the coastline of the Emilia-Romagna region, and have been investigated through several studies
and technical reports (Gambolati, 1998; Gambolati et al., 1999; Carminati et al., 2003a; ENI and
ARPAE, 2003; Regione Emilia-Romagna and ARPAE, 2007, 2008, 2010, 2018; Calabrese et al.,
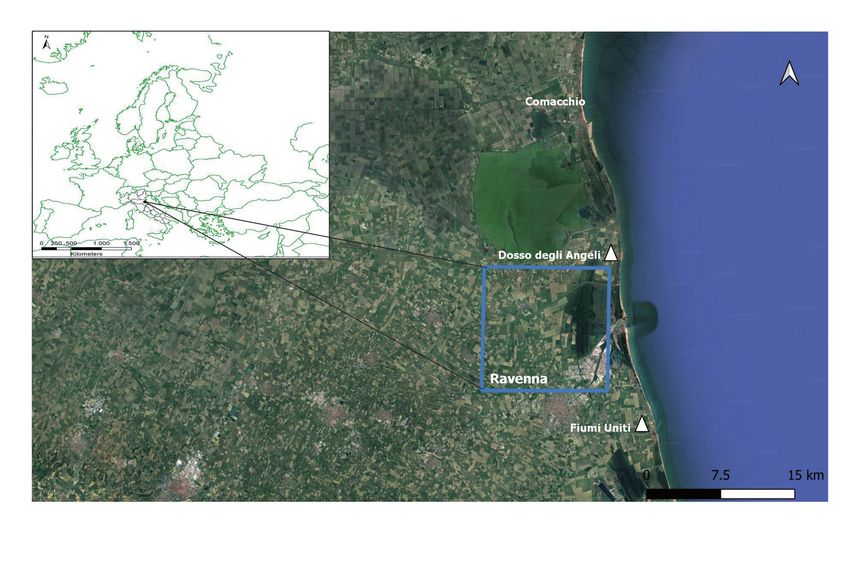
2021; Severi, 2021). In particular, the area located between Comacchio and Ravenna city (Fig.
1), extending for about 12.5×12.5 km2 in the Emilia-Romagna region onshore, is significantly
affected by subsidence related to several factors, such as oil and gas extraction and storage (https://
unmig.mise.gov.it/index.php/it/) and groundwater withdrawal for several uses and functions, e.g.
civil, industrial, irrigation, livestock, etc. (Bissoli et al., 2010; Cenni et al., 2013).
Fig. 1 - The blue polygon represents the study area in the Ravenna onshore.
302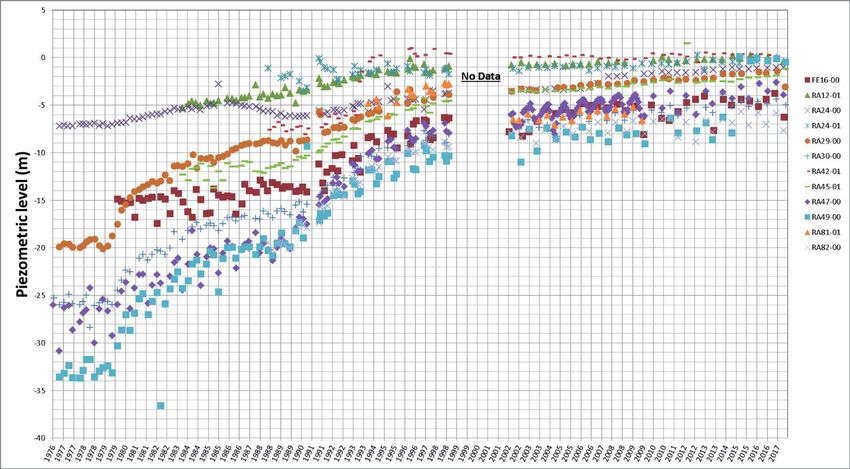
Soil deformation by 3D modelling and DInSAR measurements                 Boll. Geof. Teor. Appl., 62, 301-318

   According to the Regione Emilia-Romagna and ARPAE (2007) report, which investigates
subsidence affecting the whole region by exploiting Differential Synthetic Aperture Radar (DInSAR)
technique and satellite SAR data acquired during the 1992-2000 and 2002-2006 time intervals, the
ground deformations in the Ravenna area are characterised by a subsidence rates of -15 mm/yr for the
1992-2000 period [when the piezometric level was about -10 m on sea level (Regione Emilia-Romagna
and ARPAE, 2008) report], and of -10 mm/yr for the 2002-2006 period [when the piezometric level
was about -5 m on sea level (Regione Emilia-Romagna and ARPAE, 2008) report]. These results
were computed by applying the DInSAR technique known as Permanent Scatteres (PSs) to SAR data
(Ferretti et al., 2001) acquired from: ERS-1/2 sensors along descending orbits within the 1992-2000
time interval, ENVISAT sensor along ascending and descending orbits during the 2002-2006 period,
and RADARSAT-1 sensor along ascending orbits for the 2003-2005 time period. Moreover, these
DInSAR analyses were referred to pixels located in the area north (for the ERS/ENVISAT analyses)
and west (for the RADARSAT analysis) of the city of Reggio Emilia (Italy).
   In addition, the Regione Emilia-Romagna and ARPAE (2018) report shows the results of
a subsequent interferometric analysis performed by exploiting SAR data (RADARSAT-1/2
and Cosmo-SkyMed) acquired from ascending orbits during the 2011-2016 time interval and
processed via the PS technique that reveals a subsidence rate of about -5 mm/yr.
   Overall, these values suggest decreasing subsidence rates and uprising piezometric level
due to the diminishing of groundwater withdrawal in 1992-2016 time interval. However, on the
preliminary results of the Regione Emilia-Romagna and ARPAE (2008) report it is specified that:
   - in several areas a strong spatial and temporal correlation between groundwater withdrawal
     activity, piezometric level and subsidence is noticeable;
   - in localised areas along the coastline and sometimes inland subsidence appears to be not
     totally correlated to groundwater withdrawal;
   - in some areas the data available through piezometric measurements and well groundwater
     withdrawal are not sufficient to study the local subsidence, as for our study area.
    In addition, the Regione Emilia-Romagna and ARPAE (2010) report revealed that the contribution
of groundwater extraction to the total subsidence spatially ranges between 10% at Dosso degli
Angeli, located NE of the study area (Fig. 1), and 30% at Fiumi Uniti, SE of the study area (Fig. 1).
    In order to investigate the impact and evaluate the amount of groundwater movements
due to groundwater withdrawal and its contribution to the total subsidence in the study area,
in-situ data, such as geologic and structural maps, piezometric measurements, underground water
withdrawal volumes (provided by Emilia-Romagna Region), and satellite C-band SAR data were
used to integrate two different methods: a) numerical modelling to evaluate the contribution of
groundwater withdrawal to ground deformation; b) satellite radar interferometry to detect and
estimate the total vertical displacements in the study area. Regarding the first method, based on
the availability of water withdrawal time series (see sections 3.1 and 3.2), a 3D fluid-dynamic and
geomechanical modelling was carried out for the years 1975, 1990, 2000, 2010, and 2017. DInSAR
analysis was performed by exploiting SAR data, acquired from ERS/ENVISAT and Sentinel-1
sensors, available for the 1995-2010 and 2015-2018 time intervals (see section 3.3), respectively.
The results of the performed joint analysis allowed us to constrain the subsidence affecting the
study area during these periods and to assess the contribution of groundwater withdrawal to the
total vertical displacement, particularly relevant for the years 2000, 2010, and 2017.

                                                                                                       303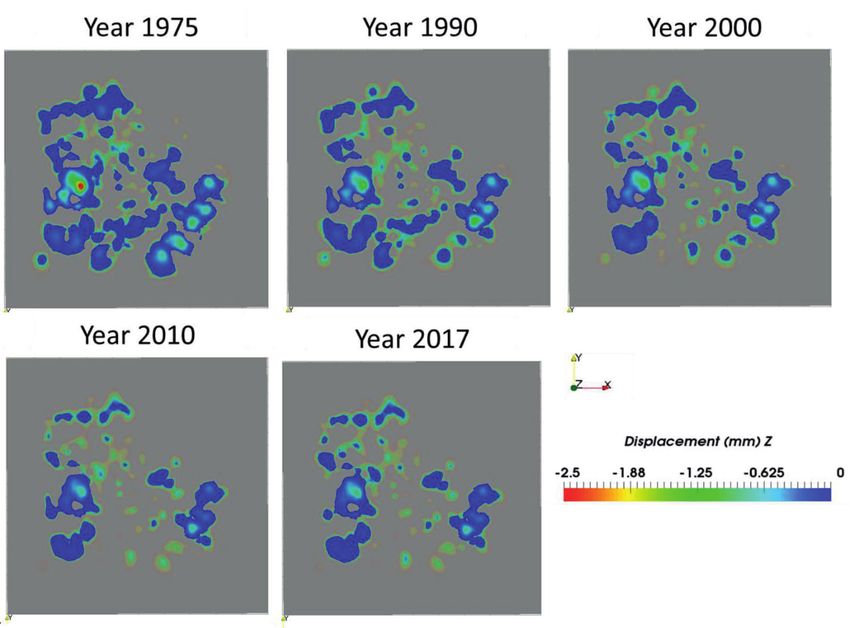
Boll. Geof. Teor. Appl., 62, 301-318                                                 Antoncecchi et al.

2. Geological framework

    The study area lays in onshore Ravenna over the south-eastern portion of the Po Plain. The
Po Plain is the foreland basin of both Alps and Apennines (Doglioni, 1993). The subsidence in
this area is likely to be heavily influenced by the tectonic and geodynamic processes responsible
for the formation of the two mountain belts (Carminati et al., 2005). These two mountain belts
developed on top of two subduction zones (Carminati et al., 2003a). The Alps are related to
the southward dipping subduction of the European plate beneath the Adriatic plate, whereas the
Apennines are generated by the westward/SW-ward dipping subduction of the Adriatic plate
under the Tyrrhenian lithosphere (Doglioni, 1993; Carminati et al., 1998).
    The River Po sedimentary basin, which encompasses an area about 38,000 km2 in size, is
rapidly subsiding and filled by sediments of Alpine and Apenninic origin (Carminati et al.,
2003a). Tectonic structures (mainly thrust faults and related folds) are buried under ca. 2000 m
of Quaternary sediments deposited in continental to marine environments (Amorosi et al., 1999;
Carminati et al., 2003a, 2003b; Ghielmi et al., 2010). Geodynamics and climatological changes
(Vittori and Ventura, 1995) are the main drivers of sedimentation, which has filled the basin with
alternate layers of sand and clay (Carminati et al., 2003b). Pre-Quaternary rocks are characterised
by a complex structure of folds and thrust faults that developed parallel to the main Apennine
tectonic structures. These structures provided traps for the accumulation of natural gas and oil
(Gambolati et al., 1991).
    A multi-layer aquifer system developed in the first ca. 500 m of sediments accumulated since
the Pleistocene (Di Dio, 1998). This system consists of a sequence of stratified deposits laid
down during the Quaternary and the upper Pliocene in different environments, from continental,
lagoonal, and deltaic in the upper zone to littoral and marine in the lower one (Gambolati et al.,
1991). The dynamics of Late Quaternary (last 20,000 years) sedimentation in the south-eastern Po
Plain has been directly controlled by sea level changes induced both by tectonics and deglaciation
(Amorosi et al., 1999).
    Quaternary sediments of the Emilia-Romagna coastal plain are characterised by the cyclical
organisation of marine and continental deposits in succession of various hierarchical order,
for a thickness of several hundred metres. In the study area, two main depositional cycles are
identified, defined as Qm and Qc, whose discontinuity surface is at the boundary between the
Supersynthem of the Marine Quaternary, corresponding to the Qm cycle, and the overlying
Emiliano - Romagnolo Supersynthem, equivalent to the Qc cycle (Ricci Lucchi et al., 1982;
Di Dio, 1998; Preti, 2002). The Emiliano - Romagnolo Supersyntem is divided into the Lower
Emiliano - Romagnolo Synthem - AEI and the Upper Emiliano - Romagnolo Synthem - AES,
both ca. 300 m thick. Studies based on the interpretation of seismic profiles integrated by well
data provided a general stratigraphic framework of the Quaternary deposits in the Ravenna area,
showing that the Emiliano - Romagnolo Supersynthem has in this sector of the plain a total
thickness of about 600-700 m (Di Dio, 1998; Preti, 2002).
    According to Carminati et al. (2003a), a significant amount of the natural subsidence in the
study area is related to the flexure of the Adriatic plate due to its subduction. Sediment load/
compaction and deglaciation-related ice melting also contribute to natural subsidence (Carminati
et al., 2003a). The onshore (along coast) total natural subsidence rates in the study area were
estimated to be around 3 mm/yr (Carminati et al., 2003b). The difference between present-day
subsidence rates from geodetic data and this subsidence rate from geological data can be used to
evaluate the effects of anthropic activities (Severi et al., 2021).

304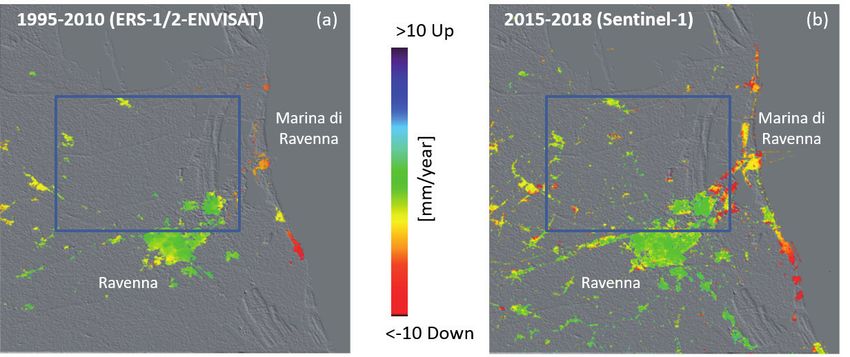
Soil deformation by 3D modelling and DInSAR measurements               Boll. Geof. Teor. Appl., 62, 301-318

3. Materials, methods and preliminary results

   In this paragraph, the data and the methods exploited to investigate subsidence affecting
the area of study are presented. In particular, in section 3.1 the in-situ data provided by the
Emilia-Romagna Region and Regional Agency for the Environmental Protection and Energy
(ARPAE Emilia-Romagna), such as geological and structural maps, piezometric measurements,
underground water withdrawal volumes, etc., are listed and detailed. In the subsequent section
3.2, the numerical simulations carried out by a 3D fluid-dynamic and geomechanical modelling
based on these data are presented. Finally, in section 3.3 the description of the used satellite
data, the processing technique, the performed DInSAR analysis, and the achieved results, is
reported.

3.1. Description of in-situ data

    The Emilia-Romagna Region and ARPAE Emilia-Romagna have provided the following data
set for the study area (blue polygon in Fig. 1):

   • cartographic basemaps: topographic map, geologic and structural maps, the latter specifi-
     cally processed for the case study;
   • 14 deep geological and hydrogeological cross-sections (7 from ISPRA, 1988);
   • 612 geologic surveys from geognostic database of the Emilia-Romagna Region that provi-
     ded different information (e.g. location, depth, lithological pattern). This database includes
     several static penetrometric tests [Cone Penetration Test (CPT)], for which the raw para-
     meters and some elaborations as Robertson’s parameters are provided (Robertson, 2009;
     Robertson and Cabal, 2014);
   • 106 surveyed groundwater withdrawal wells classified for function and use (civil, indust-
     rial, irrigation, livestock) with the corresponding volumes of water (Mm3/yr) annually pro-
     duced by the wells. These data are available for the following years: 1975, 1990, 2000,
     2010, and 2017 (Figs. 2 and 3);
   • 12 piezometers, belonging to the Regional Groundwater Monitoring Network with the
     relative piezometric measurements carried out over time. The frequency of piezometric
     measures changes from well to well, so it is not uniform and can be annual or monthly
     (note that experimental piezometric data are not available between 1998 and 2002 as
     reported in Fig. 4).

3.2. Numerical simulations: fluid-dynamic and geomechanical modelling

   The data described in the previous section (like stratigraphy, well data, etc.) were imported in
PetrelTM software (Schlumberger Ltd, 2016) and were processed and used for the 3D modelling.
The elaboration of the 3D geological model was used to perform fluid-dynamic simulations
aimed to define the effects induced on the surface by the groundwater withdrawal. The code
used for the fluid-dynamic modelling was Tough2 (Pruess, 1990) integrated in GeoSIAM -
Integrated System of Analysis for geomodelling developed by RSE (Agate and Guandalini,
2018); the geomechanical modelling was performed with PyLith code (Aagaard, et al., 2013,
2017). In detail, to define the interface surfaces of geologic units in Petrel, well data were
analysed together with the available geological and hydrogeological cross-sections to define
petrophysical parameters.

                                                                                                     305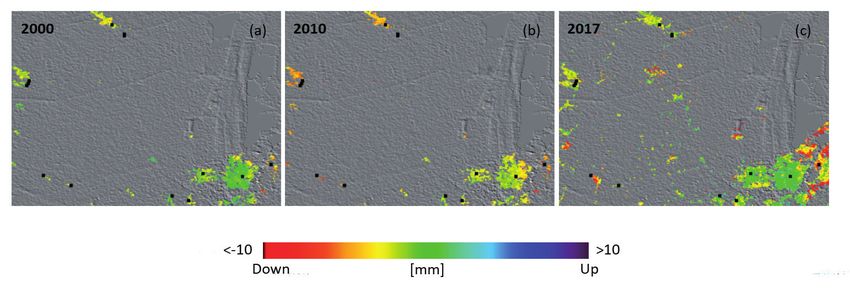
Boll. Geof. Teor. Appl., 62, 301-318                                                                   Antoncecchi et al.

Fig. 2 - Location of groundwater withdrawal wells in the study area (blue polygon) classified for use and function
(yellow for industrial, red for irrigation, blue for civil, green for livestock) (data from Regional Agency for the Envi-
ronmental Protection and Energy - ARPAE Emilia-Romagna).

Fig. 3 - Volumes (Mm3/yr) of groundwater withdrawal in the study area classified for use and function (yellow for
industrial, red for irrigation, blue for civil, green for livestock) (data from Regional Agency for the Environmental
Protection and Energy - ARPAE Emilia-Romagna).

306

Soil deformation by 3D modelling and DInSAR measurements                             Boll. Geof. Teor. Appl., 62, 301-318

Fig. 4 - Piezometric trend recorded during the 1976-2017 period from wells located in the study area. This chart high-
lights the build-up of piezometric level during time when the water volumes withdrawal decremented. Data are not
available for the 1998-2002 period (data from ARPAE Emilia-Romagna).

   A 3D dynamic grid was created with dimensions of approximately 12.5×12.5 km2 in the
x and y directions and -400 m of depth in z direction. This 3D dynamic grid was carried out
by following the Voronoi tessellation method (Voronoi, 1909; Okabe et al., 2010; Mei, 2014)
implemented in GeoSIAM software with each element of the grid consisting of a 3D polygonal
element with a maximum of 20 sides. This type of computational grid has the advantage of
having the connection sides orthogonal to the mass centre connectors as required by the method
of discretisation to integral finite differences used by the Tough2 simulator (Pruess, 1990). The
geometry of the 106 examined wells for water production was integrated into the dynamic grid
and a grid refining was carried out near the wells creating 3D concentric rings of 8 elements
each around the wells. The geological and structural characteristics of this investigated area
were subdivided into 98 vertical layers whose thickness ranges between 3 and 10 m; therefore,
the final 3D dynamic grid consists of 463,050 elements, 745,173 nodes and 1,652,651
connections. During the grid generation phase, the pertinent petrophysical properties derived
from the geological and lithological characteristics of the area were attributed to each cell and
are summarised in Tables 1 and 2.
   Before performing groundwater withdrawal simulations, an initialisation phase is required
during which the wells are not active and thus reproduction of the correct initial pressure and
temperature distribution is allowed within the calculation domain. Then, using the geological
model and computational grid described above, groundwater drainage simulations were
performed for the 5 years with full availability of experimental data (1975, 1990, 2000, 2010,
and 2017) and the annual pressure difference between initial and final state of groundwater
withdrawal was estimated. This pressure difference represents the input force for the
geomechanical simulation and the vertical subsidence estimation related to the groundwater
withdrawal from superficial aquifers.

                                                                                                                   307
Boll. Geof. Teor. Appl., 62, 301-318 Antoncecchi et al.
The geomechanical numerical simulation was carried out using the PyLith software and the
3D dynamic grid was transformed into a hexahedral 3D grid necessary to operate with a finite
element software. For finite element grid generation, a subdivision of elements with the same
geomechanical properties was carried out and the final 3D grid consists of 33 vertical layers,
180,048 cells, and 186,898 nodes.
To better understand the magnitude of subsidence process, further simulations were performed
using 3 different rock compressibility values to cover the variability range for the available
experimental values and the results of the numerical simulations are reported in Table 3. Maps
of vertical displacement (z axis) obtained considering the average compressibility values for
the study area in 2000, 2010, and 2017 are shown in Fig. 5. The uncertainties associated with
the deformation results retrieved via the numerical simulations depends on numerous factors
that requires an in depth analysis. However, preliminary results using as example a different
discretisation of the mesh produced no appreciable differences on the simulations.
Table 1 - Geomechanical parameters used for the study.
Parameter [unit] Symbol Sand Clay
Poisson’s coefficient [-] ν 0.3 0.3
Young’s modulus [Pa] E 2.00 E+09 2.18E+07
Porosity [-] εf 0.35 0.07
Permeability [m2] k 9.09E-13 1.00E-14
Density [kg/m3] ρ 1.90E+03 1.90E+03
Biot coefficient (α = εf) [-] a 0.35 0.07
Vertical compressibility [Pa-1] mv 6.00E-10 5.50E-08
Pores compressibility [Pa-1] βp = mv/ef 1.71E-09 7.86E-07
Bulk modulus [Pa] K 1.67E+09 1.82E+07
Confined modulus [Pa] M 2.69E+09 2.94E+07
Tangential modulus [Pa] G=μ 7.69E+08 8.39E+06
Table 2 - Different compressibility values (z axis oriented upwards): lower, average and upper values for sand and clay.
Sand Clay
Average Lower Upper Average Lower Upper
Parameters [unit]
value value value value value value
Vertical compressibility
6.00E-10 3.00E-10 9.00E-10 5.50E-08 1.00E-08 1.00E-07
[Pa-1]
308Soil deformation by 3D modelling and DInSAR measurements Boll. Geof. Teor. Appl., 62, 301-318
Table 3 - Simulated maximum vertical displacement in mm recorded at surface in different years (1975, 1990, 2000,
2010, and 2017) for different compressibility values in Table 2 (z axis oriented upwards).
Maximum vertical displacement values
retrieved via numerical simulations [mm]
1975 1990 2000 2010 2017
Average compressibility value (see Table 2) - 2.87 - 1.65 - 1.62 - 0.92 - 0.98
Lower compressibility value (see Table 2) - 2.55 - 1.56 -1.49 - 0.93 - 0.93
Upper compressibility value (see Table 2) - 4.16 - 2.44 - 2.30 - 1.34 - 1.33
Fig. 5 - Maps of the simulated vertical displacement (in mm) relevant to the average compressibility values of Table 2
for years 1975, 1990, 2000, 2010, and 2017.
3.3. DInSAR analysis
The ground deformation affecting the investigated area has been deeply analysed by using
the satellite remote sensing technique referred to as DInSAR technique (Gabriel et al., 1989;
Massonet et al., 1993) that allows the generation of spatially dense ground deformation
309Boll. Geof. Teor. Appl., 62, 301-318 Antoncecchi et al.
maps with centimetre to millimetre accuracy. This is done by analysing the phase difference
(interferogram) of two temporally separated SAR images, with the measured displacements
representing the projection of the surface deformation on the radar Line Of Sight (LOS). The
results presented in this study are retrieved by applying the advanced DInSAR algorithm
referred to as Small BAseline Subset (SBAS) approach (Berardino et al., 2002), that allows
following the temporal evolution of the detected deformation phenomena via the generation
of displacement velocity maps and corresponding time series relevant to the whole period of
observation. In particular, the SBAS approach implements an easy combination of the differential
SAR interferograms generated from an appropriate selection of SAR data pairs characterised
by a small spatial and temporal separation (baseline) between the acquisition orbits in order to
mitigate the noise effects (Zebker and Villasenor, 1992) and on the application of the Singular
Value Decomposition (SVD) method. The latter is applied to the set of multilooked (Rosen et
al., 2000) and unwrapped (Pepe et al., 2015) interferograms and allows linking independent
SAR acquisition data sets separated by large spatial baselines, thus increasing the number
of data used for the analysis. Moreover, this technique includes a step for the detection and
removal of orbital fringes, topography-related contributions and atmospheric phase components
(Berardino et al., 2002).
In this study, the following four sets of C-band SAR data, acquired from ERS/ENVISAT, and
Sentinel-1 sensors were considered:
1. 70 ERS-1/2 and ENVISAT SAR data acquired from ascending orbits (track 172) in the
June 1995 - July 2010 time interval;
2. 138 ERS-1/2 and ENVISAT SAR data acquired from descending orbits (track 122) in the
May 1995 - July 2010 time interval;
3. 166 Sentinel-1 SAR data acquired from ascending orbits (track 117) in the March 2015 -
December 2018 time interval;
4. 171 Sentinel-1 SAR data acquired from descending orbits (track 95) in the March 2015 -
December 2018 time interval.
The related differential interferograms were computed for each data set by exploiting the
1-arcsec STRM (Shuttle Radar Topography Mission) DEM (Digital Elevation Model) of the
study area; in addition, a complex multilook operation, resulting in a pixel size of approximately
80×80 m2, was performed. Moreover, to each SAR data set the SBAS technique was applied
(Berardino et al., 2002; Pepe et al., 2005; Casu et al., 2014; Manunta et al., 2019) and the LOS
mean deformation velocity maps and the corresponding time series for each coherent pixel (i.e.
the pixels where the noise effects can be assumed negligible) identified in the imaged scene were
generated. In addition, the obtained results were referred to a (reference) pixel in the centre of the
city of Ravenna, close to the Giardini Pubblici.
By benefitting from the availability of DInSAR measurements from both ascending and
descending radar LOS, the vertical and E-W mean velocity components (Manzo et al., 2006)
for the pixels common to both radar geometries were estimated. Accordingly, the mean vertical
deformation velocity maps for the ERS/ENVISAT (1995-2010) and Sentinel-1 (2015-2018) SAR
data were generated and reported in Figs. 6a and 6b, respectively. Fig. 6 shows these maps (colour
scale) superimposed on the DEM (grey scale) of the area, wherein low coherence zones are masked
out. This kind of representation is particularly effective because it provides direct information on
the estimated mean deformation rate. Both maps reveal that the whole city of Ravenna is quite
stable without showing significant velocity rates; only the agricultural zone SE of the study area
310Soil deformation by 3D modelling and DInSAR measurements Boll. Geof. Teor. Appl., 62, 301-318
shows a subsidence pattern with values up to -6/-7 mm/yr (see Fig. 6b). The surrounding zone,
NW of study area, exhibits a poor coherent pixel density (and this is more evident for the ERS/
ENVISAT results with respect to the Sentinel-1 ones, see Fig. 6); this occurs essentially due to
the characteristics of the exploited C-band SAR systems that do not preserve coherence over
time in vegetated/agricultural areas. Moreover, both maps show subsidence patterns involving
the coastal areas, particularly those south of Marina di Ravenna with values up to -13 mm/yr
for the ERS/ENVISAT data and up to -15 mm/yr for the Sentinel-1 ones. In addition, also the
industrial area (between Ravenna and Marina di Ravenna) and the harbour of Ravenna city are
affected by subsidence with velocity rates also exceeding -20 mm/yr (see Fig. 6b). It is worth
noting that the Sentinel-1 vertical velocity map presents a coherent pixel density significantly
improved with respect to that of the ERS/ENVISAT one. This is mostly related to both the
revisit-time reduction and the orbital tube narrowness of the Sentinel-1 sensors with respect to
those of the ERS/ENVISAT sensors [6 days vs. 35/70 days and 200 m vs. 2000 m, respectively,
Manunta et al. (2019)]. Furthermore, it is important to underline that the Sentinel-1 results are
relevant to the ground displacements where the low spatial frequency component, essentially
induced by regional tectonic, was removed; accordingly, they provide information on the high
spatial frequency component related to deformation phenomena. This operation was carried out
by following the lines discussed in Lanari et al. (2020) and by using the continuous GPS position
time series provided by the Nevada Geodetic Laboratory at the University of Nevada, Reno,
USA (UNR-NGL) (Blewitt et al., 2018) in the framework of the “Plug and Play GPS” project.
Such a project takes the raw GPS data from more than 17,000 stations all around the world and
makes publicly available via a web-site (http://geodesy.unr.edu) the related data products for
all the geodetic quality GPS stations. For what concerns the investigated area, we remark that it
represents a very small portion of the entire processed Sentinel-1 frame (that covers an area of
about 300 km × 250 km). Overall, we used the position time series relevant to 52 GPS stations;
they are those returned by a proper selection and screening operation carried out on the 83
stations deployed within the entire frame (Lanari et al., 2020). These GPS measurements were
considered to compute the GPS-derived regional deformation pattern used within the velocity
calibration procedure that finally provides high spatial frequency deformation components
(Lanari et al., 2020).
Fig. 6 - DInSAR analysis results. Mean deformation vertical velocity maps (mm/yr) computed in coherent areas and
superimposed on the DEM of the investigated zone: a) results relevant to the ERS/ENVISAT SAR data for the 1995-
2010 time interval; b) results relevant to the Sentinel-1 SAR data for the 2015-2018 time interval. The blue polygon
identifies the study area in the Ravenna onshore.
311Boll. Geof. Teor. Appl., 62, 301-318 Antoncecchi et al.
Availability of vertical deformation temporal time series (Casu and Manconi, 2016) allowed,
besides, the computation of the vertical cumulative displacements for three selected periods and for
the area of study (previously identified via the blue rectangles in Fig. 6). Figs. 7a, 7b, and 7c show
the vertical displacement cumulative maps (colour scale) for the investigated area, superimposed on
the DEM (grey scale) of the zone, for the 2000, 2010, and 2017 periods, respectively. Note that the
2000 and 2010 maps were obtained from the ERS/ENVISAT SAR data, while the 2017 one from the
Sentinel-1 measurements. Note, also, that these three periods were selected, among those investigated
through the groundwater withdrawal fluid-dynamic modelling (Fig. 5), since they are the ones for
which SAR data were available (i.e. no SAR data was acquired before 1990). These maps were
computed by considering for each coherent pixel the linear regression that best fits the related time
series within the selected periods. Accordingly, the corresponding mean vertical deformation velocities
were obtained and used to retrieve the vertical deformation for the year of interest.
Fig. 7 - DInSAR analysis results for the area of study (see blue polygon in Fig. 6). Vertical cumulative displacement
maps (mm) for three time intervals, computed in coherent areas and superimposed on the DEM of the investigated
zone: a) year 2000 from ERS/ENVISAT SAR data; b) year 2010 from ERS/ENVISAT SAR data; c) year 2017 from
Sentinel-1 SAR data. The black squares identify the 13 wells used for the DInSAR analysis/numerical simulations
comparison.
Starting from these maps, the DInSAR vertical deformation at wells were computed. In particular,
13 of the 106 original wells used in the fluid-dynamic and geomechanical modelling were considered
for both the ERS/ENVISAT and Sentinel-1 DInSAR results. These wells are located in zones that
are coherent in both the ERS/ENVISAT and Sentinel-1 DInSAR displacement maps; moreover, they
are those that present significant displacements as revealed by the fluid-dynamic simulations. For
each year, the DInSAR vertical deformation in correspondence to the coherent pixels located inside
a well-centred box, extending approximately 500×500 m2, was considered. Subsequently, for each
box the vertical deformation of the corresponding coherent pixels was averaged, thus obtaining a
mean deformation value for each considered well. Finally, for each year an overall mean deformation
vertical value was evaluated, by averaging the so-computed vertical displacement values at the 13
selected wells. The results of this analysis are reported in Table 4. Moreover, in order to provide an
estimate of the mean vertical deformation relevant to the whole area of study (and not limited to
the 13 well sites), the mean vertical displacement values for all the ERS/ENVISAT and Sentinel-1
coherent pixels located within this area were computed (thus, significantly increasing the number of
pixels used for this analysis, now considering some/tens of thousands of pixels). Also, these values
are reported in Table 4. The results (Fig. 7 and Table 4) are discussed in the following paragraph,
also by comparing them to those retrieved through the numerical simulations (section 3.2).
312Soil deformation by 3D modelling and DInSAR measurements Boll. Geof. Teor. Appl., 62, 301-318
Table 4 - Averaged vertical displacement values (in mm) measured for the 2000, 2010, and 2017 years retrieved via
DInSAR analysis.
Averaged vertical displacement values retrieved via
DInSAR analysis [mm]
2000 2010 2017
13 wells - 2.1 - 4.4 - 2.6
ERS/ENVISAT coherent pixels - 1.3 - 3.2
Sentinel-1 coherent pixels - 2.3
4. Discussion
On the basis of the results presented in the previous sections, the discussion will be organised
in three main topics:
- vertical displacement around water withdrawal wells retrieved via the SBAS-DInSAR
technique for years 2000, 2010, and 2017;
- comparison and discussion of the results from the two techniques used in this work;
- total subsidence in the study area considering the SAR data processed via the SBAS-
DInSAR technique (1995-2018).
Concerning the first topic, a general total subsidence rate in the study area of up to -13 mm/yr
for the ERS/ENVISAT data (1995-2010) and up to -15 mm/yr for the Sentinel-1 (2015-2018) is
estimated. These values include both natural and anthropogenic causes where the total natural
subsidence rates in the study area is estimated to be around 3 mm/yr by Carminati et al. (2003b).
Furthermore, the DInSAR analysis presented in section 3.3 provided the total subsidence for
the years 2000, 2010, and 2017 and, in particular, around the 13 wells located in the study area and
selected considering those with significant vertical displacement, as suggested by the numerical
simulations. The results of this analysis, reported in Fig. 7 and Table 4, reveal an increase of the
subsidence (in absolute value) from year 2000 to 2010 and a decrease from year 2010 to 2017.
This is evident by analysing the vertical displacement maps of Fig. 7. Moreover, this subsidence
pattern is also evident by computing the averaged vertical deformation values for the three years,
by performing both the analysis based on the DInSAR coherent pixels located at the 13 wells
and the one based on all the coherent DInSAR pixels included in the area of study. Indeed, both
analyses show similar findings, i.e. mean vertical deformation values increase (in absolute value)
passing from 2000 to 2010, and then decrease passing from 2010 to 2017.
Regarding the second topic, by jointly analysing the results derived from the two methods, at
local scale, considering 13 wells of those present in the study area, it is possible to estimate the
contribution of ground water extraction over the total subsidence by comparing Tables 3 and 4.
Considering the values in the two tables, and in particular the results in Table 3 corresponding to
average compressibility value (similar considerations, although characterised with different values,
can be obtained by considering the upper and lower compressibility values), it is visible that the
contribution of ground water extraction in the three years 2000, 2010, and 2017 changes from 79%
in 2000 to 21% in 2010 and to 38% in 2017. This is in line with the information derived by data of
groundwater volume extraction that show a big reduction from 8.48·106 m3/yr in 1975 to 0.77·106
m3/yr in 2017. However, while is mostly true for period 1975 to 2000, it seems to partially differ for
the period from 2010 to 2017 when the performed joint analysis suggests a decrease of subsidence
resulting in a major contribution of groundwater withdrawal, not confirmed by the volume extracted.
313Boll. Geof. Teor. Appl., 62, 301-318 Antoncecchi et al.
Furthermore, in the period 2000-2010, in the study area the presented analysis shows an increase
of subsidence due to water withdrawal and other components. Such a difference could be explained
considering other causes of compaction, such as major loading of buildings/infrastructure especially
in the Ravenna canal/harbour zone as observed through local investigation by Emilia Romagna
Region. The retrieved values of the groundwater withdrawal to the total subsidence highlight that
in the study area the contribution of groundwater withdrawal is larger than the one estimated by
Regione Emilia-Romagna and ARPAE (2010) report that varies from 10 to 30%.
Therefore, it is possible that in the 2000-2010 period there was a delay effect due to decrease in the
extracted groundwater volume, as Teatini et al. (2006) report: “Land subsidence near the coast during
1977-2001, a period when aquifer pore pressure was increasing, results from delayed consolidation
of the aquitards. Moreover, the virgin aquifer compaction ended in 1977 and the subsequent elastic
reaction in unloading conditions accounts for an only partial recovery of the original deformation”.
For the 2010-2017 period, the performed analysis seems to indicate a partial recovery of the
total subsidence with decreasing vertical displacements and a larger contribution of groundwater
withdrawal to the total subsidence, moving from 21% to 38%, despite a stabilisation of the
extracted water volumes, also thanks to good management policies adopted from 2000 onwards.
Finally, concerning the third topic, we remark that the DInSAR analysis has been carried out by
considering two separate time intervals, i.e. 1995-2010 and 2015-2018. For both periods we find that the
whole city of Ravenna is quite stable without showing significant velocity rates and that the agricultural
zone SE of the study area shows a subsidence pattern with values up to -6 to -7 mm/yr. Moreover, the
industrial area (between Ravenna and Marina di Ravenna) and the harbour of Ravenna city result to be
affected by subsidence with velocity rates also exceeding -20 mm/yr within the two time intervals. In
addition, the coastal areas, particularly those south of Marina di Ravenna, are interested by subsidence
with values up to -13 mm/yr for the 1995-2010 period and up to -15 mm/yr for the 2015-2018 one.
This slight difference can be due to several aspects related both to the different characteristics of the
employed SAR data (i.e. for the 2015-2018 the SAR systems allow better monitoring with respect
to the 1995-2010 one the agricultural/coastal areas; accordingly, an increased number of pixels can
be observed) and to natural phenomena and/or man-made activities that may be changed over time
(compaction processes, soil exploitation, etc.). Finally, we outline that the DInSAR results presented in
this work, relevant to the mean vertical deformation velocities in the Ravenna onshore study area, were
computed with different methodologies with respect to other studies from the literature (Regione Emilia-
Romagna and ARPAE, 2007, 2018). The different interferometric analyses are not easily comparable
for several factors. The used SAR data set are referred to different periods (Regione Emilia-Romagna
and ARPAE reports: 1992-2000, 2002-2006, 2011-2016, this study: 1995-2010, 2015-2018) and
influence the estimate of the mean deformation velocity, above all if the ground displacements are not
linear in the whole period of observation. DInSAR data were processed with two different techniques
(PS and SqueeSAR in the Regione Emilia-Romagna and ARPAE reports, SBAS in this study). In the
cited reports, SAR data collected from one single acquisition geometry (ascending or descending)
were used, except for the 2002-2006, when both acquisition geometries were considered. Instead, this
study is totally based on the double geometry. The interferometric analysis for the 2011-2016 (Regione
Emilia-Romagna and ARPAE, 2018) and the 2015-2018 (this study) time intervals have benefitted
from a different use of GPS measurements to calibrate the retrieved DInSAR results in order to detect
the regional signal-related component. The 2011-2016 DInSAR results (Regione Emilia-Romagna
and ARPAE, 2018) provide an image of the general deformation phenomena affecting the whole
region, while the 2015-2018 DInSAR presented in this study provide information on local deformation
phenomena affecting a small portion of the region, obtained by removing the regional signal-related
from DInSAR results. Furthermore, the number and position of GPS measurements exploited by both
interferometric analyses is significantly different. In particular, 16 GPS stations deployed in the whole
314Soil deformation by 3D modelling and DInSAR measurements Boll. Geof. Teor. Appl., 62, 301-318
Emilia-Romagna region for the 2011-2016 report (Regione Emilia-Romagna and ARPAE, 2018) were
used, while for the 2015-2018 study we exploited 52 stations located in an area that only partially
overlaps with that of the 2011-2016 report [for more details see Lanari et al. (2020)]. Finally, the spatial
extension of the investigated area and the SAR reference, just to mention some of the several aspects
involved in the interferometric analysis, can also contribute to the retrieved differences.
5. Conclusions
Subsidence represents the final effect of a regional geodynamic and tectonic and local compaction
processes. Compaction processes can have natural or anthropogenic causes as, for example,
the filling of a sedimentary basin, the withdrawal of groundwater or the oil and gas production.
The CLYPEA programme, within the project “Ground deformation” (Antoncecchi et al., 2018),
proposed the integration of different approaches for the investigation of subsidence in the Emilia-
Romagna Region area located between Comacchio, to the north, and Ravenna, to the south. In
this work, the fluid-dynamic and geomechanical 3D modelling simulated the contribution of the
groundwater production to the total detected deformation due to groundwater withdrawal [within
400 m below the surface by using data of compressibility available from literature, see Regione
Emilia-Romagna and ARPAE (2010) report] for 5 years - 1975, 1990, 2000, 2010, and 2017, when
data of the extracted groundwater volumes were statistically significant. Moreover, SAR data from
ERS/ENVISAT and Sentinel-1 sensors were processed through the SBAS technique and provided
information on the total subsidence affecting the area of study for the 1995-2018 period.
The study highlights the advantages of a multi-disciplinary approach to deeply investigate the
subsidence process occurring in the area of study, and that typically affects the Emilia-Romagna
region. The contribution of groundwater withdrawal in the three considered years 2000, 2010,
and 2017 changes from 79% in 2000, to 21% in 2010, and 38% in 2017. This is generally in line
with groundwater withdrawal data that show a reduction of the extracted water volumes during
the considered temporal interval. Accordingly, this contribution to the total subsidence results
to be larger with respect to the estimates of Regione Emilia-Romagna and ARPAE (2010) that
span from 10% to 30%. Moreover, the joint analysis shows that a delay effect in the subsidence
process, as response to a decrease in the extracted groundwater volumes is detected for the 2000-
2010 period; a partial recovery of this process seems to occur during the 2010-2017 interval when
a stabilisation of the extracted groundwater volumes was imposed.
The presented results bring new evidence about the contribution of groundwater withdrawal
to the total subsidence in the study area. These results need further investigations through future
researches that must benefit of integrated approaches exploiting proper continuous spatial and
temporal data set for satellite, geological, and production data (e.g. water withdrawal volumes).
Acknowledgments. This study is performed under the umbrella of “CLYPEA - Innovation Network for
Future Energy” promoted and financed by the Italian Ministry of Economic Development - DG ISSEG, in
the framework of the project “Subsoil deformations” made in collaboration with Research on Energy Sy-
stem - RSE, National Institute of Geophysics and Volcanology - INGV, University of Bologna, Polytechnic
of Turin, Sapienza University, National Research Council - IGAG and National Research Council - IREA,
and Emilia-Romagna Region. DInSAR data processing is also partially sponsored by the I-AMICA project
(PONa3 00363). We thank the Emilia-Romagna Region for sharing historical data and knowledge about the
study area. Thanks also to the European Space Agency for providing the ERS/ENVISAT ASAR data, and
to the NASA SRTM mission for the DEM of the analysed area. Sentinel-1 data were provided through the
Copernicus Program of the European Union.
315Boll. Geof. Teor. Appl., 62, 301-318 Antoncecchi et al.
REFERENCES
Aagaard B.T., Knepley M.G. and Williams C.A.; 2013: A domain decomposition approach to implementing fault slip in finite
element models of quasi statics and dynamic crustal deformation. J. Geophys. Res.: Solid Earth, 118, 3059-3079, doi:
10.1002/jgrb.50217.
Aagaard B.T., Knepley M.G. and Williams C.A.; 2017: Geodynamics/pylith: PyLith v2.2.1, (Version v2.2.1). Zenodo, doi:
10.5281/zenodo.886600.
Agate G. and Guandalini R.; 2018: Manuale d’uso del software GeoSIAM versione 2.0. RSE 18002366, RSE S.p.A.,
Milano, Italy.
Amadori C., Garcia-Castellanos D., Toscani G., Sternai P., Fantoni R., Ghielmi M. and Di Giulio A.; 2018: Restored
topography of the Po Plain - Northern Adriatic region during the Messinian base-level drop - Implications for the
physiography and compartmentalization of the palaeo-Mediterranean basin. Basin Res., 30, 1247-1263, doi: 10.1111/
bre.12302.
Amorosi A., Colalongo M.L., Pasini G. and Preti D.; 1999: Sedimentary response to Late Quaternary sea level changes in the
Romagna coastal plain (northern Italy). Sedimentology, 46, 99-121.
Antoncecchi I., Rossi G., Ciccone F., Carminati E., Morelli A., Pezzo G., Macini P., Gandolfi S., Lanari R., Manzo M.,
Moia F., Verga F., Perini L., Severi P., Petracchini L., Billi A. and Terlizzese F.; 2018: Studio multidisciplinare per la
valutazione delle deformazioni del suolo connesse alle attività di produzione di idrocarburi in aree dell’offshore emiliano
romagnolo finalizzato allo sviluppo di un modello per il monitoraggio finalizzato. In: Gruppo Nazionale di Geofisica
della Terra Solida, 37° Convegno Nazionale, Riassunti estesi delle comunicazioni, Centro Stampa della Regione Emilia
Romagna, pp. 501-504.
Benetatos C., Codegone G., Deangeli C., Giani G., Gotta A., Marzano F., Rocca V. and Verga F.; 2017: Guidelines for
the study of subsidence triggered by hydrocarbon production. GEAM - Geoingegneria Ambientale e Mineraria,
152, 85-96.
Benetatos C., Codegone G., Ferraro C., Mantegazzi A., Rocca V., Tango G. and Trillo F.; 2020: Multidisciplinary
analysis of ground movements: an underground gas storage case study. Remote Sens., 12, 3487, doi: 10.3390/
rs12213487.
Berardino P., Fornaro F., Lanari R. and Sansosti E.; 2002: A new algorithm for surface deformation monitoring based on
small baseline differential SAR interferograms. IEEE Trans. Geosci. Remote Sens., 40, 2375-2383.
Bertoni W., Brighetti G., Gambolati G., Ricceri G. and Vuillermin F.; 1995: Land subsidence due to gas production in the
on- and off-shore natural gas fields of the Ravenna area, Italy. IAHS Publ., 234, 13-20.
Bissoli R., Bitelli G., Bonsignore F., Rapino A. and Vittuari L.; 2010: Land subsidence in Emilia-Romagna Region, northern
Italy: recent results. IAHS Publ., 339, 307-311.
Blewitt G., Hammond W.C. and Kreemer C.; 2018: Harnessing the GPS data explosion for interdisciplinary science. Eos,
99, doi: 10.1029/2018EO104623.
Calabrese L., Luciani P. and Perini L.; 2021: A review of impact of subsidence induced by gas exploitation on costal
erosion in Emilia-Romagna, Italy. Boll. Geof. Teor. Appl., 62, 279-300, doi: 10.4430/bgta0356.
Carminati E. and Martinelli G.; 2002: Subsidence rates in the Po Plain (northern Italy): the relative impact of natural and
anthropic causation. Eng. Geol., 66, 241-255.
Carminati E., Wortel M.J.R., Spakman W. and Sabadini E.R.; 1998: A new model for the opening of the western central
Mediterranean basins: geological and geophysical constraints for a major role of slab detachment. Earth Planet. Sci.
Lett., 160, 651-665.
Carminati E., Doglioni C. and Scrocca D.; 2003a: Apennines subduction related subsidence of Venice (Italy). Geophys. Res.
Lett., 30, 1717, doi: 10.1029/2003GL017001.
Carminati E., Martinelli G. and Severi P.; 2003b: Influence of glacial cycles and tectonics on natural subsidence in the Po
Plain (northern Italy): insights from 14C ages. Geochem. Geophys. Geosyst., 4, 1082-1096.
Carminati E., Doglioni C. and Scrocca D.; 2005: Magnitude and causes of long-term subsidence of the Po Plain and Venetian
region. In: Fletcher C.A. and Spencer T. (eds), Flooding and environmental challenges for Venice and its lagoon: state of
knowledge, Cambridge University Press, New York, NY, USA, pp. 21-28.
Casu F. and Manconi A.; 2016: Four-dimensional surface evolution of active rifting from spaceborne SAR data. Geosphere,
12, 697-705, doi: 10.1130/GES01225.1.
Casu F., Elefante S., Imperatore P., Zinno I., Manunta M., De Luca C. and Lanari R.; 2014: SBAS-DInSAR parallel processing
for deformation time-series computation. IEEE J. Sel. Top. Appl. Earth Obs. Remote Sens., 7, 3285-3296.
Cenni N., Viti M., Baldi P., Mantovani E., Bacchetti M. and Vannucchi A.; 2013: Present vertical movements in central and
northern Italy from GPS data: possible role of natural and anthropogenic causes. J. Geodyn., 71, 74-85.
Coti C., Rocca V. and Sacchi Q.; 2018: Pseudo-elastic response of gas bearing clastic formations: an Italian case study.
Energies, 11, 2488, doi: 10.3390/en11092488.
316Soil deformation by 3D modelling and DInSAR measurements Boll. Geof. Teor. Appl., 62, 301-318
Di Dio G. (a cura di); 1998: Riserve idriche sotterranee della Regione Emilia - Romagna. Regione Emilia-Romagna,
Ambiente, Geologia, Sismica e Suoli and ENI S.p.A. - AGIP, Bologna, Italy, 120 pp.
Doglioni C.; 1993: Some remarks on the origin of foredeeps. Tectonophys., 228, 1-20.
ENI and ARPAE; 2003: Studio della subsidenza antropica generata dall’estrazione di acqua di falda lungo la costiera
emiliano-romagnola. ENI S.p.A. - AGIP and ARPAE Emilia-Romagna, Rapporto tecnico n. 4, 198 pp., (accessed on 13 June 2016).
Ferretti A., Prati C. and Rocca F.; 2001: Permanent scatterers in SAR interferometry. IEEE Trans. Geosci. Remote
Sens., 39, 8-20.
Fiaschi S., Tessitore S., Bonì R., Di Martire D., Achilli V., Borgstrom S., Ibrahim A., Floris M., Meisina C.,
Ramondini M. and Calcaterra D.; 2017: From ERS-1/2 to Sentinel-1: two decades of subsidence monitored
through A-DInSAR techniques in the Ravenna area (Italy). GISci. and Remote Sens., 54, 305-328, doi:
10.1080/15481603.2016.1269404.
Gabriel A.K., Goldstein R.M. and Zebker H.A.; 1989: Mapping small elevation changes over large areas: differential
interferometry. J. Geophys. Res., 94, 9183-9191.
Gambolati G. (ed); 1998: CENAS: coastal evolution of the upper Adriatic Sea due to sea level rise and natural and
anthropogenic land subsidence. Springer, Berlin, Germany, 359 pp.
Gambolati G. and Teatini P.; 2015: Geomechanics of subsurface water withdrawal and injection. Water Resour. Res., 51,
3922-3955, doi: 10.1002/2014WR016841.
Gambolati G., Ricceri G., Bertoni W., Brighenti G. and Vuillermin E.; 1991: Mathematical simulation of the subsidence of
Ravenna. Water Resour. Res., 27, 2899-2918.
Gambolati G., Teatini P., Tomasi L. and Gonella M.; 1999: Coastline regression of the Romagna region, Italy, due to natural
and anthropogenic land subsidence and sea level rise. Water Resour. Res., 35, 163-184.
Ghielmi M., Minervini M., Nini C., Rogledi S., Rossi M. and Vignolo A.; 2010: Sedimentary and tectonic evolution in the
eastern Po-Plain and northern Adriatic Sea area from Messinian to Middle Pleistocene (Italy). Rend. Lincei Sci. Fis.
Nat., 21, 131-166.
ISPRA; 1988: CARG Project - Geologic and geothematic cartography. .
Lanari R., Bonano M., Casu F., De Luca C.D., Manunta M., Manzo M., Onorato G. and Zinno I.; 2020: Automatic generation
of Sentinel-1 continental scale DInSAR deformation time series through an extended P-SBAS processing pipeline in a
cloud computing environment. Remote Sens., 12, 2961, doi: 10.3390/rs12182961.
Manunta M., De Luca C., Zinno I., Casu F., Manzo M., Bonano M., Fusco A., Pepe A., Onorato G., Berardino P., De Martino
P. and Lanari R.; 2019: The parallel SBAS approach for Sentinel-1 interferometric wide swath deformation time-series
generation: algorithm description and products quality assessment. IEEE Trans. Geosci. Remote Sens., 57, 6259-6281,
doi: 10.1109/TGRS.2019.2904912.
Manzo M., Ricciardi G.P., Casu F., Ventura G., Zeni G., Borgstrom S., Berardino P., Del Gaudio C. and Lanari R.; 2006:
Surface deformation analysis in the Ischia island (Italy) based on spaceborne radar interferometry. J. Volcanol.
Geotherm. Res., 151, 399-416, doi: 10.1016/j.jvolgeores.2005.09.010.
Massonnet D., Rossi M., Carmona C., Ardagna F., Peltzer G., Feigl K. and Rabaute T.; 1993: The displacement field of the
landers earthquake mapped by radar interferometry. Nature, 364, 138-142.
Mei G.; 2014: Summary on several Key techniques in 3D geological modelling. The Sci. World J., ID723832, 11 pp., doi:
10.1155/2014/723832.
Okabe A., Boots B., Sugihara K. and Chiu S.N.; 2000: Spatial tessellations: concepts and applications of Voronoi diagrams,
2nd ed. John Wiley & Sons, Wiley Series in Probability and Statistics, Hoboken, NJ, USA, 696 pp.
Pepe A., Sansosti E., Berardino P. and Lanari R.; 2005: On the generation of ERS/ENVISAT DInSAR time-series via the SBAS
technique. IEEE Geosci. Remote Sens. Lett., 2, 265-269.
Pepe A., Yang Y., Manzo M. and Lanari R.; 2015: Improved EMCF-SBAS processing chain based on advanced
techniques for the noise-filtering and selection of small baseline multi-look DInSAR interferograms. IEEE Trans.
Geosci. Remote Sens., 53, 4394-4417.
Preti D. (a cura di); 2002: Note illustrative della Carta Geologica d’Italia, foglio 223, Ravenna. ISPRA, Servizio Geologico
d’Italia - Regione Emilia Romagna, Roma, Italy, 141 pp.
Pruess K.; 1990: Tough2: a general purpose numerical simulator for multiphase fluid and heat flow. Lawrence Berkeley
Lab., CA, USA, Technical Report LBL-29400, 112 pp., doi: 10.2172/5212064.
Regione Emilia-Romagna and ARPAE; 2007: Rilievo della subsidenza nella pianura emiliano romagnola. Analisi
interferometrica. Regione Emilia-Romagna, Assessorato Ambiente e Sviluppo Sostenibile - Assessorato Sicurezza
Territoriale, Difesa del Suolo e della Costa, Protezione Civile and ARPAE Emilia-Romagna, Agenzia Regionale
Protezione Ambientale Energia, Bologna, Italy, 85 pp.
317Boll. Geof. Teor. Appl., 62, 301-318 Antoncecchi et al.
Regione Emilia-Romagna and ARPAE; 2008: Analisi preliminari degli effetti dei prelievi di acque sotterranee sull’evoluzione
recente del fenomeno della subsidenza in Emilia-Romagna - Relazione Finale. Regione Emilia-Romagna, Assessorato
Ambiente e Sviluppo Sostenibile - Assessorato Sicurezza Territoriale, Difesa del Suolo e della Costa, Protezione Civile
and ARPAE Emilia-Romagna, Agenzia Regionale Protezione Ambientale Energia, Bologna, Italy, 62 pp.
Regione Emilia-Romagna and ARPAE; 2010: Applicazione della modellistica matematica di simulazione. Fase II - Analisi
della subsidenza nelle zone costiere, Relazione finale. Regione Emilia-Romagna, Assessorato Ambiente e Sviluppo
Sostenibile - Assessorato Sicurezza Territoriale, Difesa del Suolo e della Costa, Protezione Civile and ARPAE Emilia-
Romagna, Agenzia Regionale Protezione Ambiente Energia, Bologna, Italy, 91 pp.
Regione Emilia-Romagna and ARPAE; 2018: Rilievo della subsidenza nella pianura emiliano romagnola, Fase II, Relazione
Finale. Regione Emilia-Romagna, Assessorato Difesa del Suolo e Della costa, Protezione Civile e Politiche Ambientali e
della Montagna and ARPAE Emilia-Romagna, Agenzia Regionale Protezione Ambientale Energia, Bologna, Italy, 105 pp.
Ricci Lucchi F., Colalongo M., Cremonini G., Gasperi G., Iaccarino S., Papani G., Raffi I. and Rio D.; 1982: Evoluzione
sedimentaria e paleogeografica del margine appenninico. In: Cremonini G. and Ricci Lucchi F. (eds), Guida alla geologia
del margine appenninico-padano, Guide Geologiche Regionali, Soc. Geol. Ital., pp. 17-46.
Robertson P.K.; 2009: Interpretation of Cone penetration tests - a unified approach. Canad. Geotech. J., 46, 1337-1355.
Robertson P.K. and Cabal K.L.; 2014: Guide to Cone penetration testing for geotechnical engineering, 6th ed. Gregg Drilling
& Testing Inc., Signal Hill, CA, USA, 133 pp.
Rosen P.A., Hensley S., Joughin I.R., Li F.K., Madsen S.N., Rodriguez E. and Goldstein R.; 2000: Synthetic aperture radar
interferometry. IEEE Proc., 88, 333-382.
Scardia G., De Franco R., Muttoni G., Rogledi S., Caielli G., Carcano C., Sciunnach D. and Piccin A.; 2012:
Stratigraphic evidence of a Middle Pleistocene climate-driven flexural uplift in the Alps. Tectonics, 31, TC6004, doi:
10.1029/2012TC003108.
Schlumberger Ltd; 2016: Petrel: the platform for E&P decision making. .
Severi P.; 2021: Soil uplift in the Emilia-Romagna plain (Italy) by satellite radar interferometry. Boll. Geof. Teor.
Appl., 62, doi: 10.4430/bgta0349, in print.
Severi P., Mazzoni R. and Martelli L.; 2021: Oil and gas activities in Emilia-Romagna Region (Italy): land deformation
and territory protection. Boll. Geof. Teor. Appl., 62, 269-278, doi: 10.4430/bgta0327.
Teatini P., Gambolati G., Tomasi L. and Putti M.; 1998: Nonlinear simulation of land subsidence over the Angela-Angelina
gas field at Ravenna, Italy. IGEA, 11, 41-48.
Teatini P., Ferronato M., Gambolati G., Bertoni W. and Gonella M.; 2005: A century of land subsidence in Ravenna, Italy.
Environ. Geol., 47, 831-846.
Teatini P., Ferronato M. and Gambolati G.; 2006: Groundwater pumping and land subsidence in the Emilia-Romagna coastland,
Italy: modeling the past occurrence and the future trend. Water Resour. Res., 42, W01406, doi: 10.1029/2005wr004242.
Vittori E. and Ventura G.; 1995: Grain size of fluvial deposits and late Quaternary climate: a case study in the Po River valley
(Italy). Geol., 23, 735-738.
Voronoi M.; 1908: Nouvelles applications des parametres continus a la Theorie des Formes Quadratiques. J. Reine
Angewandte Math., 134, 198-287, doi: 10.1515/crll.1908.133.97.
Zebker H.A. and Villasenor J.; 1992: Decorrelation in interferometric radar echoes. IEEE Trans. Geosci. Remote Sens., 30,
950-959.
Corresponding author: Ilaria Antoncecchi
Ministero dello Sviluppo Economico, Direzione Generale per le Infrastrutture e la Sicurezza dei Sistemi
Energetici e Geominerari (ex-DGS-UNMIG)
Via A. Bosio 13b, Roma, Italy
Phone: +39 06 470522038; e-mail: ilaria.antoncecchi.ext@mise.gov.it
318You can also read