Correlation between the relative blob fraction and plasma parameters in NSTX
←
→
Page content transcription
If your browser does not render page correctly, please read the page content below
Correlation between the relative blob
fraction and plasma parameters in NSTX
Cite as: Phys. Plasmas 29, 012505 (2022); https://doi.org/10.1063/5.0074261
Submitted: 07 October 2021 • Accepted: 22 December 2021 • Published Online: 18 January 2022

  S. J. Zweben,     S. Banerjee,   N. Bisai, et al.

Phys. Plasmas 29, 012505 (2022); https://doi.org/10.1063/5.0074261                            29, 012505

© 2022 Author(s).
Physics of Plasmas                                                                                     ARTICLE            scitation.org/journal/php

    Correlation between the relative blob fraction
    and plasma parameters in NSTX
    Cite as: Phys. Plasmas 29, 012505 (2022); doi: 10.1063/5.0074261
    Submitted: 7 October 2021 . Accepted: 22 December 2021 .
    Published Online: 18 January 2022

    S. J. Zweben,1,a)   S. Banerjee,1                    N. Bisai,2,3   A. Diallo,1   M. Lampert,1        B. LeBlanc,1 J. R. Myra,4
                      4
    and D. A. Russell

    AFFILIATIONS
    1
        Princeton Plasma Physics Laboratory, Princeton, New Jersey 08540, USA
    2
        Institute for Plasma Research, Bhat, Gandhinagar 382428, India
    3
        Homi Bhabha National Institute (HBNI), Anushakti Nagar, Mumbai, Maharashtra 400094, India
    4
        Lodestar Research Corporation, Boulder, Colorado 80301, USA

    a)
         Author to whom correspondence should be addressed: stewart.zweben@gmail.com

    ABSTRACT
    This paper presents a simple analysis of the fraction of blobs observed in the scrape-off layer of NSTX and calculates the correlation between
    this blob fraction and various plasma parameters. The measurements were made using the gas puff imaging (GPI) diagnostic on a database
    of 103 shots from 2010 with neutral beam power PNBI ¼ 0–6 MW. The blob fraction ranged from fb ¼ 0.1% to 4.8%, where fb is defined as
    the fraction of time the GPI signal was larger than three times its average value within 0–7.5 cm outside the separatrix. The blob fraction gen-
    erally decreased with increasing neutral beam injection power and was lower on average in H-mode plasmas than Ohmic and L-mode plas-
    mas. The blob fraction had its highest correlation with the measured poloidal turbulence velocity and its radial gradient just inside the
    separatrix. This is in part consistent with a model in which the blob generation rate increases with the poloidal velocity shear.
    Published under an exclusive license by AIP Publishing. https://doi.org/10.1063/5.0074261

    I. INTRODUCTION                                                                   relationship between the blob size and the SOL density e-folding
          Blobs are turbulent filamentary structures in the scrape-off layer           length.7 The radial and poloidal motion of blobs in the SOL of HL-2A
    (SOL) of tokamaks and other magnetized plasmas. Blobs are impor-                  was well correlated with the floating potential gradients determining
                                                                                      the E  B velocity.8 Extensive analysis of blobs in NSTX was done
    tant since they carry heat and particles radially across the SOL, and so,
                                                                                      using gas puff imaging (GPI) data,9,10 as described further below, and
    at least in part, determine the SOL width and local erosion of the walls
                                                                                      blob dynamics has also been studied in detail in non-tokamak devices
    or divertor plates. Although the basic mechanism of radial blob                   such as TORPEX.11
    motion was discovered in 20011 and a theoretical criterion for blob                     There has also been significant progress in the theory and simula-
    formation was presented in 2005,2 by 2010 there was still only a partial          tion of blobs in tokamaks, even in just the past two years. For example,
    connection between theory and experiment.3 A list of experimental                 agreement between analytic and numerical results on blob velocity scal-
    and theoretical references prior to 2011 can be found in Ref. 3.                  ing in diverted tokamaks was found using the GBS fluid code.12
          Since 2011, there has been good progress in the experimental                Simulations using the BOUTþþ code showed that blobs are generated
    study of blobs in tokamaks. For example, the 3D structure of these B-             near the peak pedestal pressure gradient region inside the separatrix and
    field aligned blob filaments has been clarified using wide-angle high-               contribute to the transport of the particle and heat in the SOL region.13
    speed imaging in MAST4 and analyses of these images show that the                 Blobs have been identified in gyrokinetic simulations of DIII-D and C-
    blob filaments are randomly emitted from the core in a toroidally uni-             Mod using the XGC-1 code.14 Blob–blob interactions were studied in
    form way along the separatrix in the midplane region without a clear              2D SOL simulations15 and in 3D simulations including divertor geome-
    modal structure.5 The role of blobs in linking the divertor collisionality        try.16 A universal analytic criterion for blob birth was proposed17 and
    with perpendicular SOL transport was established in ASDEX and                     recently extended to finite electron temperature effects.18
    JET,6 and probe measurements in ASDEX Upgrade and TCV                                   Despite this recent progress in blob physics, it is still not clear
    (Tokamak a Configuration Variable) in the L-mode have shown a                      what determines the frequency or number of blobs in the SOL for a

Phys. Plasmas 29, 012505 (2022); doi: 10.1063/5.0074261                                                                                              29, 012505-1
Published under an exclusive license by AIP Publishing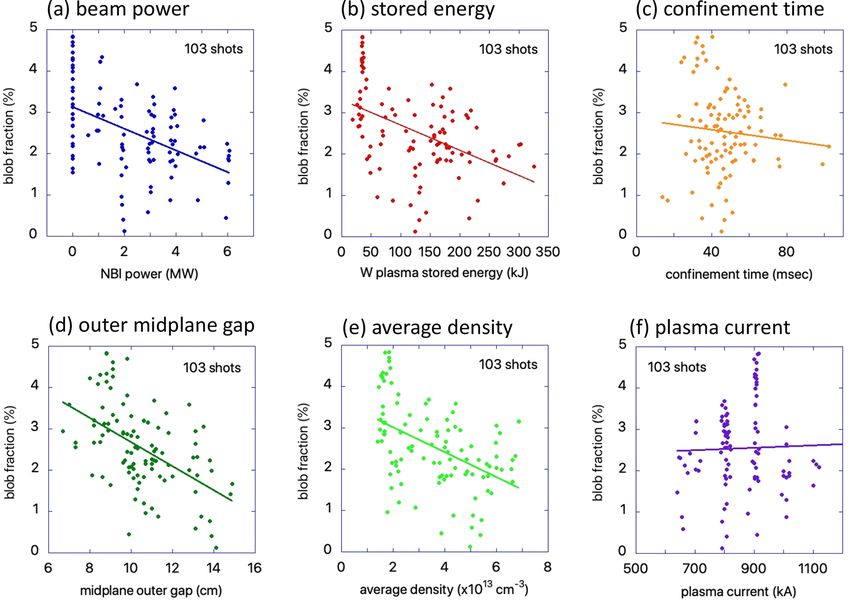
Physics of Plasmas                                                                                  ARTICLE            scitation.org/journal/php

    particular type of tokamak discharge condition. Which plasma param-            deuterium emission line during the steady-state part of the discharge.
    eters correlate best with the population of blobs?                             This neutral gas cloud increases the Da emission within the camera
          Some experimental results on this topic can be found in the exist-       line of sight by a factor of at least 10 over a distance of about 12 cm
    ing literature. For example, an early paper using Langmuir probes in           along the B field line, which localizes this line emission to the region
    DIII-D showed larger amplitude blobs in L-mode than in H-mode                  near the gas puffer. The camera viewing angle is as near as possible
    plasmas,19 and an early study of the “packing fraction” and linear den-        aligned along the local magnetic field, which is tilted at an angle of
    sity of blobs using GPI in NSTX showed more blobs just outside the             about 36 with respect to the toroidal direction in NSTX, resulting in
    separatrix in the L-mode than in the H-mode.20 However, the statisti-          images of the local Da light emission from the cloud that are approxi-
    cal properties of edge turbulence were the same in both L-mode and             mately radial (i.e., perpendicular to the local separatrix) vs poloidal or
    H-mode as measured by probes at the bottom of USN (upper single                “binormal” (i.e., along the local separatrix). The camera images all
    null) discharges in ASDEX-Upgrade.21 An increase in the generation             have 64  80 pixels at 400 000 frames/s (2.5 ls/frame).
    rate of blobs was seen during edge biasing in the CASTOR tokamak                     This GPI camera views an area about 24 cm radially and 30 cm
    and was attributed to increased poloidal velocity shear,22 while the           poloidally, i.e., normal and binormal to the local magnetic field and
    blob generation rate was measured in ASDEX-Upgrade and explained               centered just above the outer midplane. Most of the GPI light emission
    by a model based on the edge density and temperature profiles.23 Blob           occurs within 65 cm of the separatrix where the electron temperature
    size and lifetime were observed to increase with line-averaged density         is high enough to excite the Da line but low enough so that the neu-
    in L-mode discharges in ASDEX-Upgrade,6 but the statistical proper-            trals are not completely ionized (roughly Te  10–200 eV). The single
    ties of blobs as measured by GPI in the SOL of Alcator C-Mod were              GPI gas puff per shot produces usable Da signal over 50 ms, but for
    the same in high and low density Ohmic discharges and in H-mode                this paper only a 10 ms period centered at the time of the peak of the
    plasmas.24 The blob size in MAST as measured with passive imaging              total GPI signal is analyzed.
    showed a slight increase with plasma current,25 while the blob size and              The Da light emission seen in GPI can fluctuate due to the local
    radial velocity as measured with probes in Ohmic L-mode plasmas in             electron density and temperature variations, including both turbulent
    TCV showed a wide variation as a function of edge collisional fre-             and coherent fluctuations. For the present blob fraction measurements
    quency.26 In summary, it is not yet clear from previous experimental           in the SOL of NSTX where (almost always) ne < 1  1013 cm3 and
    results which plasma parameters correlate best with the relative popu-         Te < 100 eV, the GPI signal is nearly linear with the local electron den-
    lation of blobs in tokamaks.                                                   sity and nearly independent of the electron temperature.28 Thus, these
          The goal of the present paper is to characterize and understand          GPI fluctuations in the SOL of NSTX can be assumed to be propor-
    the relative blob fraction in a wide database of NSTX discharges using         tional to the local electron density, at least to a first approximation.
    GPI measurements in the SOL. This paper is an extension of a previ-                  The present analysis is done using the Da light emission itself
    ous paper on blob statistics in NSTX,9 which used GPI data from                with no attempt to unfold the underlying electron density, tempera-
    many of the same discharges. Although that paper contained a multi-            ture, or possible neutral density fluctuations. Various issues and
    variable analysis of blobs over a wide database, the results were com-         assumptions in the analysis and interpretation of these GPI images
    plicated and difficult to interpret. The present paper uses a simplified         were discussed in a GPI diagnostic review paper.28 For example, slight
    blob definition and a more carefully chosen database to provide a sin-          misalignments of the camera view with respect to the local B field line
    gle blob fraction estimate for each shot. The present paper also               are not taken into account here, and neutral density fluctuations are
    includes a wider radial range of analysis of the Thomson scattering            unlikely due to the low density and temperature in the SOL. The GPI
    and GPI turbulence velocity, and the results are interpreted using             data cannot be used to determine the turbulent transport, so there is
    newly applied theory and simulations.                                          no discussion of the heat or particle SOL widths. However, the GPI
          The GPI diagnostic, database, and blob analysis methods are              diagnostic is well suited for the identification and analysis of blobs in
    described in Sec. II. Section III describes the new results, including the     the SOL, which is the topic of the present paper.
    correlation of relative blob fractions with global and local plasma
    parameters. Section IV discusses these results and tries to put them           B. Database
    into a theoretical framework, and Sec. V summarizes the conclusions.                The database of 103 NSTX discharges used for the present paper
    II. GPI DIAGNOSTIC, DATABASE, AND DATA ANALYSIS                                was selected from the full 300-shot database of 2010 GPI data using
                                                                                   the following criteria. First, a consistent time period of interest of 65
         This section gives an overview of the GPI diagnostic in Sec. II A
                                                                                   ms around the peak time of the GPI signal was chosen to provide the
    and then describes the GPI database selection process for the present
                                                                                   largest possible signal levels (see Sec. II A). Then, any H-mode shot
    paper in Sec. II B. The two blob analysis methods used here are
                                                                                   with one or more clear ELM event during this time period was elimi-
    described in Sec. II C, with the results described in Secs. III A and III B.
                                                                                   nated (97 shots). Shots with low frequency MHD-induced modulation
    Three videos of the raw GPI camera data are shown in the supplemen-
                                                                                   in the GPI signal were then eliminated (38 shots), including the seven
    tary material, and more examples can be found online in Ref. 27.
                                                                                   H-mode shots previously used in an Ohmic vs H-mode comparison9
                                                                                   that were recently identified as having a blob–MHD correlation.29
    A. GPI diagnostic                                                              Shots with RF heating were excluded (23 shots), since RF heating has a
         The GPI diagnostic of NSTX has been described in previous                 complex and largely unknown effect on the edge plasma. Also
    papers;9,10 so, only a brief summary is presented here. In GPI, a fast         removed were shots with transient events such as L–H transitions or
    camera (Vision Research Phantom 710) views a deuterium neutral gas             changes in applied power or plasma edge radius (24 shots), shots with
    cloud puffed into the edge plasma, using a Da filter to image a neutral         a small (7.5 cm) outer gap between the local separatrix and the RF

Phys. Plasmas 29, 012505 (2022); doi: 10.1063/5.0074261                                                                                           29, 012505-2
Published under an exclusive license by AIP Publishing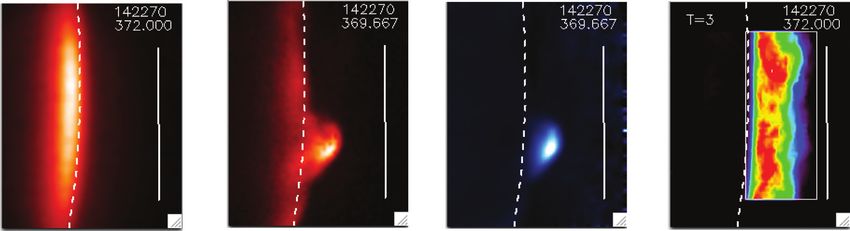
Physics of Plasmas                                                                               ARTICLE            scitation.org/journal/php

    antenna limiter (six shots), and shots with inadequate EFIT results         example, blobs in 2D simulations were defined using image processing
    (nine shots).                                                               and blob tracking,15 while single-point probe measurements often use
          This database covers the full range of NSTX parameters, as            a threshold of 2.5 times the standard deviation.19 Every definition is
    shown in Table I, with toroidal field B ¼ 3.4–5.4 kG, plasma current         somewhat arbitrary since there is no sharp dividing line between the
    I ¼ 0.6–1.2 MA, line-averaged density n ¼ 1.4–7.2  1013 cm3,              blobs and background turbulence, and since blobs evolve over time
    plasma stored energy W ¼ 18–325 kJ, neutral beam injection (NBI)            with variable size and shape and with different relative perturbations
    injected power P ¼ 0–6.1 MW, and plasma energy confinement                   in density, potential, and temperature. Therefore, the blob analysis
    time sE ¼ 14–103 ms. All shots were fueled with deuterium. Thirty           results in this paper (and elsewhere) provide only a relative measure of
    shots had only Ohmic heating, 15 were in the L-mode with low                the blobs calculated using a specific definition.
    NBI power, and 58 were in the H-mode with high NBI power. The                     The present blob analysis starts by normalizing (i.e., dividing)
    plasma shape was normally lower single null divertor with a vertical        each GPI frame by the time-average of all GPI frames over the 10 ms
    elongation of j ¼ 1.9–2.6 and an outer midplane separatrix radius of        time of interest for that shot. This allows the identification of blobs as
    Rsep ¼ 142.6–150.8 cm. Within the GPI field of view, there was a vari-       space/time regions with a much higher-than-average GPI signal, and
    able outer gap of 7–15 cm between the local separatrix and the RF          removes spatial variations due the Da emission profile, the pixel-to-
    antenna shadow, the innermost edge of which was located at                  pixel camera sensitivity, and optical vignetting. Slow variations
    R ¼ 157.5 cm at the outer midplane. Over this 8 cm range in the separa-     (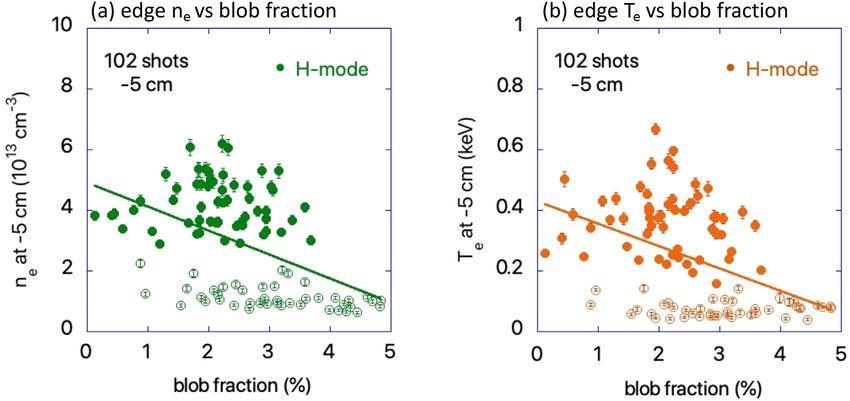
Physics of Plasmas                                                                                                   ARTICLE               scitation.org/journal/php

    Note that this blob analysis region moves radially with the local sepa-                           The second blob fraction method using contours was used only
    ratrix in the GPI field of view and retains a radial width of 7.5 cm for                     as a check of the first blob fraction method done using the T ¼ 3
    all shots. The analysis region extends radially out to the edge of the RF                   threshold. These two methods agreed well with each other, as
    antenna limiter shadow for some shots, but not radially beyond the RF                       described in Sec. III B, but the first method was used for the majority
    limiter shadow.                                                                             of the data analysis since it was simpler and easier to apply to the theo-
           The blob fraction as defined in Eq. (1) can also be interpreted as                    retical models for the comparisons with experimental data, as dis-
    the probability of finding a large amplitude fluctuation (blob) at some                       cussed in Sec. IV.
    point in the region of interest. It is proportional to the blob generation
                                                                                                III. BLOB ANALYSIS RESULTS
    rate and to the duration of time the blob spends in the SOL, but it is
    much more easily and accurately calculated than either of these two                               This section presents the results for the relative blob fractions in
    quantities separately. The threshold of T ¼ 3 corresponds to 2.5 the                       this NSTX GPI database, including trends with respect to global and
    standard deviation when the standard deviation divided by the mean                          local plasma parameters. Section III A describes results from the sim-
    is 0.80. Note that the chosen threshold of T ¼ 3 counts only relatively                     plest measure of blob fraction based on a threshold in the normalized
    large blob fluctuations; for example, if the GPI signal always stays                         GPI signal levels, including trends in the blob fraction with respect to
    below three times its time-averaged value, then the blob fraction is fb                     global plasma parameters. Section III B describes the alternative analy-
    ¼ 0. Examples of the calculation of blob fraction for specific shots in                      sis using contour mapping and compares the results with the threshold
    NSTX are discussed in Sec. III A.                                                           analysis. Section III C analyzes trends in the blob fraction with respect
           The blob fraction as defined here is simply a convenient and robust                   to edge parameters from Thomson scattering, and Sec. III D analyzes
    measurement of the relative blob population among different types of                        trends in the blob fraction with respect to the edge poloidal turbulence
    discharges as measured using GPI in NSTX. The same blob fraction cal-                       velocity derived from GPI data. Further discussion of these results is
    culation could be done on other machines and/or with other diagnos-                         presented in Sec. IV.
    tics; however, the absolute values of fb for a given plasma will depend on
    the diagnostic sensitivities. The main utility of these blob fraction mea-                  A. Blob fraction from PDF threshold
    surements at present is to assist in the validation of theoretical models                         Figure 1(a) shows the time-average of the raw GPI camera
    for blob formation in tokamaks, as discussed in Sec. IV.                                    images over 65 ms around the peak of the GPI signal (372 ms) for a
           Blobs were also identified in a second (and secondary) way as                         typical L-mode shot (#142 270), where the separatrix is shown by a
    individual 2D regions within which the GPI signal level exceeded the                        dashed white line, and the GPI gas manifold is shown as a solid white
    normalized signal threshold of T ¼ 3. The minimum contiguous area                           line. The plasma parameters for this shot are listed in Table I. The GPI
    required for a blob to be identified was 10 pixels in area or 1.4 cm2.                       images in Fig. 1(a) cover over 24 cm in the radial (horizontal) direction
    These contiguous regions were found using the “contour” function in                         and 30 cm in the poloidal or binormal direction (vertical), and this
    IDL operating on a re-binned GPI image of 10 its original pixel                            same region is viewed for all shots.
    numbers, i.e., 640  800. Only closed contours, which did not overlap                             The GPI Da signal in Fig. 1(a) peaks about 1 cm inside the sepa-
    the edge of the frame, with centers in the region defined above were                         ratrix for this shot, where the red temperature color scale ranges from
    counted as blobs. More than one non-overlapping blob can be identi-                         0 to 460 in units of camera output. Figure 1(b) shows a single 2.5 ls
    fied in each frame; however, most frames have only 0 or 1 blob (see                          frame taken during this time in which a blob is found a few centi-
    Sec. III B). The blob center was calculated from the horizontal and ver-                    meters outside the separatrix. Figure 1(c) shows the same frame as
    tical mean of the circumferential contours, and the blob area was cal-                      in Fig. 1(b) but in a normalized image with a blue color scale from
    culated using the “shoelace formula.”31                                                     0 (black) to 10 (white), which highlights the blob. A movie of the raw

     FIG. 1. (a) Image showing the time-averaged GPI signal level for shot #142 270 along with the local separatrix (dashed white line), and the GPI gas manifold (solid white line).
     The signal level peaks about 1 cm inside the separatrix. (b) Single frame with a blob in the same color scale and figure (c) this same frame in a normalized image with a blue
     color scale of 0 (black) to 10 (white). (d) Relative number of frames having a normalized signal level  3 (red ¼ 6%), along with a white box showing the blob analysis region
     used for this paper.

Phys. Plasmas 29, 012505 (2022); doi: 10.1063/5.0074261                                                                                                                   29, 012505-4
Published under an exclusive license by AIP Publishing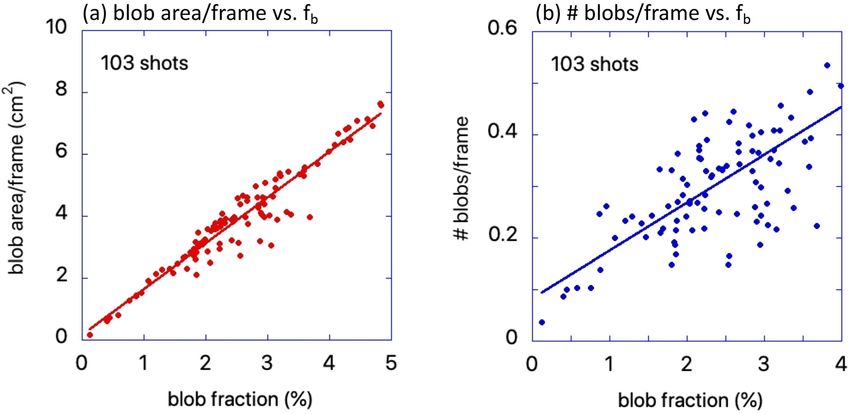
Physics of Plasmas                                                                                                  ARTICLE               scitation.org/journal/php

    camera data vs time for 2 ms in this shot can be found in the supple-                             Figure 3 shows the time dependence of typical normalized GPI
    mentary material.                                                                           signals for a single pixel at 3 cm outside the separatrix at the vertical
          Figure 1(d) shows a map of the same GPI region with a color                           middle of the image (40th row). Figure 3(a) is for an Ohmic shot
    code showing the relative fraction of pixels during the 10 ms of interest                   with a relatively large number of excursions above the blob thresh-
    having a normalized signal level of 3, where the threshold level                           old level of T ¼ 3 (#138 121), and Fig. 3(b) is for an H-mode shot
    T ¼ 3 is used to define a blob (see Sec. II B). The color scale here                         with relatively few such excursions (#141 324). Recall from Sec. II C
    ranges from 0% (black) to 6% (red), as evaluated for each pixel sepa-                       just above Eq. (1) that, for this paper the blob fraction is defined as
    rately. The blob analysis region within the white box extends 7.5 cm                        the fraction of time that the normalized GPI signal is above a
    (20 pixels) radially and 611.25 cm (rows #10–69) poloidally from the                        threshold level of T ¼ 3, averaged over the spatial region of interest
    vertical center of the GPI image at the separatrix. Blobs defined this                       in the SOL. The blob fractions for these shots as defined in Eq. (1)
    way are fairly uniformly distributed in the poloidal direction, with the                    were fb ¼ 4.7% for the Ohmic shot #138 121 and fb ¼ 0.6% for the
    blob fraction peaking a few cm radially outside the separatrix (red col-                    H-mode shot #141 324 (see Table I), so that this Ohmic shot had a
    ored areas).                                                                                blob fraction of about 8 that for the H-mode shot, averaged over
          Figure 2 shows more clearly the radial profile of the time-                            the blob analysis region. This Ohmic shot had the third from the
    averaged GPI signal of Fig. 1(a), averaged over rows #10–69 in the                          highest blob fraction in the 103-shot database (the highest shot
    image data and divided by 100 (red curve). This horizontal axis is                          having fb ¼ 4.8%), while this H-mode shot had the fourth from
    the distance from the separatrix at the vertical middle of the image.                       the lowest blob fraction in this database (the lowest shot having fb
    The raw GPI signal peaks about 1 cm inside the separatrix in this shot,                     ¼ 0.1%). The L-mode shot of Figs. 1 and 2 had an intermediate
    and the region of blob analysis from 0 to 7.5 cm outside the separatrix                     blob fraction of fb ¼ 3.2%. Videos of raw GPI data from these shots
    is labeled the “blob zone.” The blue curve in Fig. 2 shows the radial                       are shown in the supplementary material.
    profile of the relative number of pixels with a normalized signal level                            Figure 4 shows the PDF of the normalized GPI signals for the
    of  3 within the vertical range of rows #10–69 (on a relative scale).                      two shots used in Fig. 3, along with the averaged PDF for the whole
    The maximum of this blue curve occurs at 2–4 cm outside the separa-                         103-shot database. Each pixel in the blob analysis zone of Fig. 1(d) for
    trix for this shot, and the total blob fraction for this shot (averaged                     each frame within the time of interest is counted for these distribu-
    over the blob zone) is fb ¼ 3.2%. For reference, the green curve shows                      tions, except for pixels with very low signal levels, as discussed above.
    the relative GPI signal fluctuation level (standard deviation over                           The Ohmic shot #138 121 clearly has relatively more pixels above the
    mean), also averaged over these rows and time of interest. The relative                     blob threshold of T ¼ 3 than the H-mode shot #141 324. These two
    fluctuation level is 100% at 3–5 cm outside the separatrix, which is                       shots are near the extremes of high and low blob fraction, as men-
    typical of a positively skewed and blob-dominated SOL (see below).                          tioned above, while the PDF for the 103-shot average is in-between the
    The low signal level threshold level of ten camera units at which the                       two. All three of these PDFs show clear positive skewness characteris-
    normalized pixels are excluded is 0.1 on this scale, which occurs only                      tic of blobs in the SOL, which is qualitatively similar to that in MAST,4
    outside a radius of 10 cm in this shot.                                                     DIII-D,19 and other tokamaks.

     FIG. 2. Radial profiles of the GPI signal level (red), the blobs (blue), and the relative   FIG. 3. Time dependence of the normalized GPI signal levels for two shots for a
     GPI signal fluctuation level (green), all averaged over the poloidal region in the          single pixel at 3 cm outside the separatrix at the vertical middle of the image (40th
     white box of Fig. 1(d) for shot #142 270. The average GPI signal peaks 1 cm               row). (a) Ohmic shot with a relatively large number of events above the blob thresh-
     inside the separatrix, while the relative number of blobs—i.e., the relative number of     old level of T ¼ 3 (#138 121). (b) H-mode shot with relatively few events above
     pixels with normalized signal level  3—peaks at 2–4 cm outside the separatrix,           T ¼ 3 (#141 324). The Ohmic shot had about 8 the number of such frames above
     where the GPI fluctuation level (std/mean) is also the highest. The blob fraction           T ¼ 3 than the H-mode shot, i.e., an 8 larger blob fraction, averaged over the
     averaged over the blob zone is fb ¼ 3.2% for this shot.                                    blob analysis region.

Phys. Plasmas 29, 012505 (2022); doi: 10.1063/5.0074261                                                                                                                  29, 012505-5
Published under an exclusive license by AIP Publishing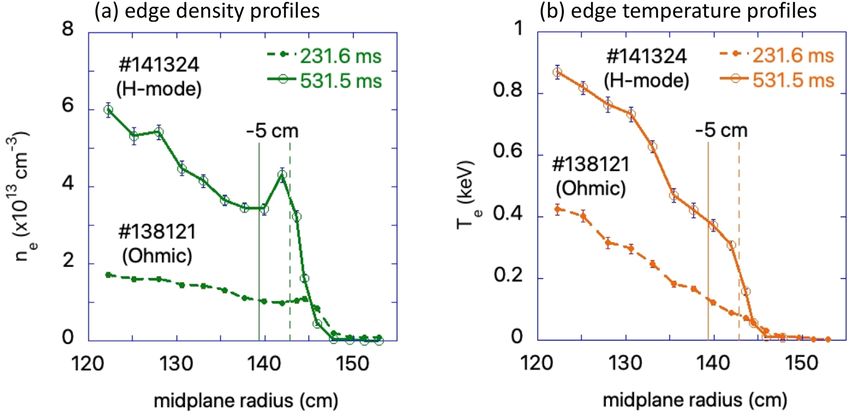
Physics of Plasmas ARTICLE scitation.org/journal/php
The fraction of pixels above T ¼ 2 is about twice that for T ¼ 3,
and the fraction for T ¼ 4 is about half that for T ¼ 3. The cross corre-
lation coefficients between the T ¼ 3 data and the T ¼ 2 and T ¼ 4
data are 0.96 and 0.98, respectively, showing that these three measures
have nearly the same relative ordering of the blob fractions for these
shots.
The fraction of normalized GPI pixels above the chosen blob
threshold level of T ¼ 3 (see Sec. II C) and within the blob analysis
zone and time of interest was evaluated for each of the 103 shots in
this database. In the following, we call this the blob fraction fb, which
is a single number evaluated for each shot, as defined in Eq. (1). Of
course, this blob fraction depends on the definition of a blob, and so is
best viewed as providing a relative measure of the blob fraction for
each NSTX shot in this database. These blob fractions in this database
ranged over fb ¼ 0.12%–4.84%, with an average of 2.5%. Estimates of
the uncertainties and sensitivities of these blob fractions are discussed
in Appendix A. The best uncertainty estimate was made using sub-
groups of six or more shots on the same run day with similar (but not
FIG. 4. The PDF of the normalized GPI signals for the same two shots as in Fig. 3, identical) plasma parameters. The standard deviation of the blob frac-
along with the shot-averaged PDF for the entire 103-shot database. Each pixel in tion within a given subgroup ranged from 0.3% to 0.7% (see Table III
the blob in the blob analysis region for each frame during the time of interest is in Appendix A), so a rough estimate of the uncertainty in these blob
counted for these distributions, except for noisy pixels with very low signal levels as
fractions is 60.5%.
discussed above. The Ohmic shot has relatively more pixels above T ¼ 3 than the
H-mode shot, with the average over all shots being somewhere in between. The correlation of these blob fractions with various plasma
parameters was made using the standard normalized correlation coef-
ficient between two sets of n parameters xn and yn as follows:
Given the smoothly varying shapes of the PDFs in Fig. 4, there is X .
no unique choice for the threshold level “T” to define a blob in these Cðxn ; yn Þ ¼ ðxn hxn iÞ yn hyn i
data (see Sec. I). Thus, for simplicity and definitiveness, a threshold sffiffiffiffiffiffiffiffiffiffiffiffiffiffiffiffiffiffiffiffiffiffiffiffiffiffiffiffiffiffiffiffiffiffiffiffiffiffiffiffiffiffiffiffiffiffiffiffiffiffiffiffiffiffiffiffiffiffiffiffiffiffiffiffiffiffiffiffiffiffiffiffiffiffiffi
X
X
criterion of T ¼ 3 for the normalized GPI signals will be used to esti- ðxn hxn iÞ2 ðyn hyn iÞ2 ; (2)
mate the blob fractions in this paper, as discussed in Sec. II C. The
qualitative results are not very sensitive to this choice, as can be seen in
where hxni and hyni are averages over the set of n shots. This correla-
Fig. 5, where the average fraction of pixels above T ¼ 2 and T ¼ 4 is
tion coefficient is near 1.0 if the two sets of data go above and below
plotted vs the T ¼ 3 fraction for all 103 shots in the database.
their averages together, near 1.0 if one variable goes up when the
other goes down, and near 0 if these parameters are uncorrelated (see
below).
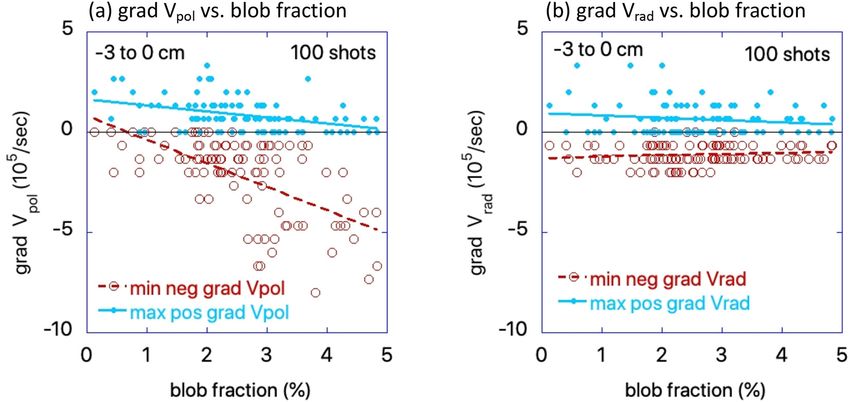
Figure 6 shows the blob fractions for all 103 shots in this database
as a function of their global plasma parameters. Figures 6(a) and 6(b)
show the dependence of fb on the NBI power PNBI and plasma stored
energy W, along with linear fits to these data (straight lines). There is a
significant negative correlation between the blob fractions and these
two parameters, with a cross correlation coefficient averaged over all
shots of 0.48 and 0.47, respectively, as shown in Table II. A nega-
tive correlation coefficient here means that the blob fraction decreases
with increasing PNBI and W. This trend of decreasing relative blob
fraction with increasing NBI power and stored energy was also seen in
the Ohmic and H-mode examples of Figs. 3 and 4, although some H-
mode shots have fb above those for Ohmic plasmas and vice versa (see
Sec. III C).
Figure 6(d) shows a similar correlation of 0.51 between the
blob fraction and the outer midplane gap, which is related to the outer
midplane separatrix radius by outer gap ¼ 157.5 cm-Rsep (the outer
midplane separatrix). A larger blob fraction is generally observed with
decreasing distance of the outer plasma edge to the midplane limiter.
Note that the blob analysis region moves radially with the local separa-
FIG. 5. The average fraction of pixels above T ¼ 2 and T ¼ 4 in the blob zone is
plotted vs the T ¼ 3 fraction for all 103 shots in the database. The fraction of pixels trix in the GPI field of view and, so, retains a radial width of 7.5 cm for
above T ¼ 2 is about twice that for T ¼ 3, and the fraction for T ¼ 4 is about half all shots. There is also a significant 0.48 correlation of the blob frac-
that for T ¼ 3. tion with the line-averaged density, as shown in Fig. 6(e). The other
Phys. Plasmas 29, 012505 (2022); doi: 10.1063/5.0074261 29, 012505-6
Published under an exclusive license by AIP Publishing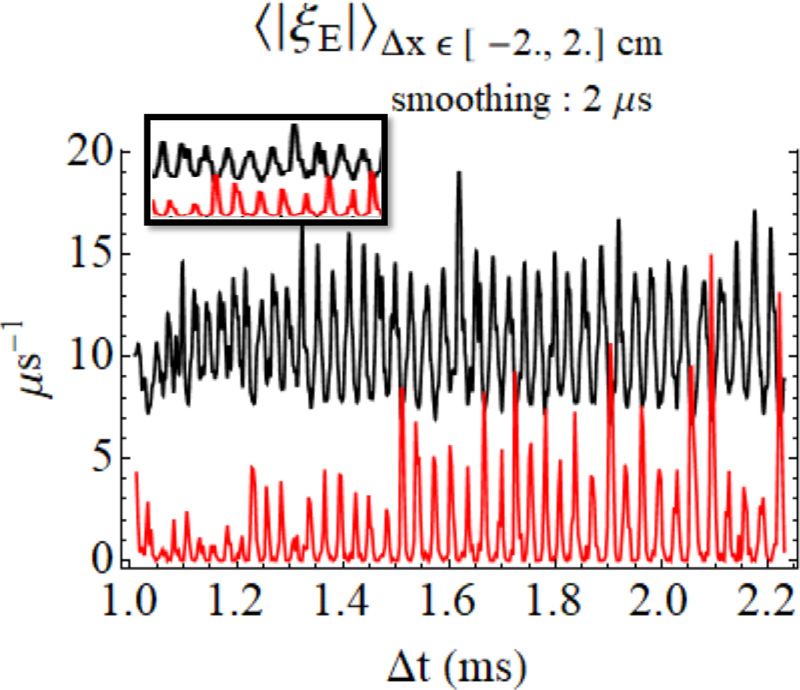
Physics of Plasmas                                                                                                ARTICLE              scitation.org/journal/php

     FIG. 6. Dependence of the blob fraction fb (i.e., the percentage of normalized GPI pixels above T ¼ 3) for six global discharge parameters for each of the 103 shots in this
     database, along with linear fits (straight lines). The blob fraction dependences are shown as a function of (a) the neutral beam power, (b) the plasma stored energy, (c) the
     plasma confinement time, (d) the outer midplane gap, (e) the line-averaged plasma density, and (f) the plasma current. There is a moderately high correlation magnitude of
     0.47–0.51 between the blob fraction and the density, beam power, stored energy, and midplane outer gap parameters, as shown in Table II.

    TABLE II. Blob fraction correlations with plasma parameters.                              dependences in Fig. 6 are relatively weak: 0.09 with energy confine-
                                                                                              ment time in (c), and 0.03 with plasma current in (f). There is also a
                       Parameter                          fb correlation                      low correlation of fb with the toroidal field B of 0.21 (not shown).
                                                                                              The dependence of fb on Ohmic vs H-mode edge conditions will be
                     NBI power                                0.48                           discussed in Sec. III C.
                    Stored energy                             0.47                                 The statistical significance of the correlations of Table II can be
                  Confinement time                             0.09                           judged by a numerical experiment that correlated 10 000 sets of 100
                      Outer gap                               0.51                           random pairs of numbers, corresponding to a 100-shot database.
                   Average density                            0.48                           The mean of the absolute value of these paired correlations was 0.08,
                   Plasma current                              0.03                           with 32% of the runs having a correlation  0.1, 4% having a
                    Toroidal field                             0.21                           correlation  0.2, and only 0.2% having a correlation  0.3. Thus, the
                     Te at 5 cm                              0.45                           four highest correlation coefficients  0.48 mentioned above are highly
                                                                                              unlikely to have occurred at random.
                     ne at 5 cm                              0.43
                                                                                                    Although there is a statistically significant correlation of blob
                    Vpol at 3 cm                              0.61
                                                                                              fractions with the NBI power, stored energy, the outer midplane gap,
                    Vrad at 3 cm                              0.02                           and the average density, the results of Fig. 6 and Table II do not iden-
                   Grad Vpol (neg)                            0.61                           tify a single dominant correlate for the large variation in relative fb
                   Grad Vpol (pos)                            0.39                           among the shots in this database, which ranges from about fb ¼ 0.1%
                      sauto (ls)                               0.03                           to 5%. This motivates a check of these results using alternative blob
                       Lrad/Lpol                              0.33                           definitions in Sec. III B, and a search for additional correlations using
                   Eq. (6) criterion                           0.43                           the local parameters from Thomson scattering and GPI velocimetry in
                                                                                              Secs. III C and III D.

Phys. Plasmas 29, 012505 (2022); doi: 10.1063/5.0074261                                                                                                               29, 012505-7
Published under an exclusive license by AIP Publishing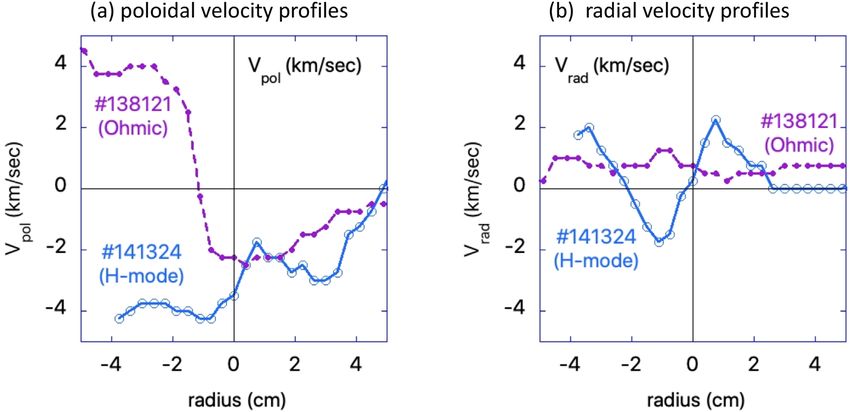
Physics of Plasmas                                                                                                ARTICLE              scitation.org/journal/php

    B. Blobs from contour mapping                                                                   Figure 8 shows a comparison between the blob analyses done
          The analysis in Sec. III A measured the blob fraction in each                       using blob contour mapping and the PDF threshold method of Sec.
    shot as the number of pixels above a threshold of T ¼ 3 in the nor-                       III A for all 103 shots in the database. Figure 8(a) shows the average
    malized GPI signal. In this section, we describe an alternate analy-                      blob area/frame for blobs with centers inside the red zone of Fig. 7 vs
    sis in which individual blobs are identified by contour mapping in                         the blob fraction. These two blob measures have a high (96%) cross
    the image plane, as described in Sec. II C. Only closed contours                          correlation and produce very similar blob area results, since a blob
    were counted as blobs when their centers lay within the blob zone                         fraction of 5% within the analysis zone corresponds to an area of 7.5
    shown in Fig. 1(d) and when they had a contiguous area of                                  22.5 cm2  0.05 ¼ 8.4 cm2, which is close to the extrapolated value
    1.4 cm2 above a normalized signal level of T ¼ 3. This way, the                          of 7.5 cm2 at 5% blob fraction of the data in Fig. 8(a). The small differ-
    number of individual blobs in each frame of each shot can be                              ences between these two blob measures are due to blob contours with
    added up and the total number cross-correlated with the plasma                            area  1.4 cm2 (which are counted in the PDF measurement), and to
    parameters.                                                                               blobs with centers inside the blob zone extending outside that zone
          Note that there is no attempt here to track the motion or lifetime                  (which are counted in the area measurement). The correlations
    of blobs from frame-to-frame, just as there was no such blob tracking                     between the blob area/frame and the plasma parameters are similar to
    used in the first (T ¼ 3 PDF threshold) method of Sec. III A. The blob                     those for the blob fractions shown in Table II; for example, the correla-
    fraction of Sec. III A and the blob contour mapping method in this                        tions of blob area with the NBI power and stored energy are 0.50
    section average over all blob locations and provide a measure of the                      and 0.54, compared with 0.48 for the blob fraction for both.
    relative probability of blobs within a consistent region of space and                           Figure 8(b) shows the average number of blobs/frames inside the
    time for each shot.                                                                       red zone of Fig. 7 vs the blob fraction for all 103 shots in the database.
          Figure 7 shows the locations of all of the blob centers in all frames               These two measures of blobs have a somewhat lower cross correlation
    of the GPI image plane for the two sample shots of Fig. 3 over the 10                     (0.79), perhaps because of a varying area/blob for these shots, which
    ms time of interest. In figure (a) is the Ohmic shot #138 121 with rela-                   ranges from 5 to 21 cm2 with a shot-average area/blob of 12.3 cm2. The
    tively many blobs, and in figure (b) the H-mode shot #141 324 with                         correlations between the average number of blobs/frames and the plasma
    relatively few blobs, as described in Table I. In the Ohmic shot in figure                 parameters are similar to those for the blob fractions shown in Table II;
    (a), there were a total of 2244 blobs, 2085 of which had centers inside                   for example, the correlations of blob area with the NBI power and stored
    the blob analysis zone shown by the red box, while in the H-mode                          energy are 0.52 and 0.60, compared with 0.48 for the blob fraction.
    shot there were 444 blobs, 416 of which had centers inside the red                              The conclusion from this section is that the blob analysis done
    blob zone. For the Ohmic shot, 35% of the 4000 frames had no                             using 2D contours produces similar (although not identical) results as
    blobs, 54% had one blob, 10% had two blobs, and 1% had three blobs.                       the PDF threshold method of blob fractions of Sec. III A. Thus, for the
    The corresponding fractions for the H-mode shot were 89%, 10%, 1%,                        rest of this section, only the results from the PDF threshold method
    and 0% for 0, 1, 2, and 3 blobs/frame, respectively.                                      will be used.

     FIG. 7. Location of all the blob centers in all frames of the GPI image plane based on contour mapping for the two sample shots of Fig. 3 and Table I over the 10 ms time of
     interest. (a) Ohmic shot #138 121 and (b) H-mode shot #141 324. Almost all of the blob centers are within the zone from 0 to 7.5 cm outside the separatrix, as defined by the
     red box [same as in Fig. 1(d)]. There were 2085 blobs in the red blob zone in shot (a) and 416 in shot (b) over these 4000 frames.

Phys. Plasmas 29, 012505 (2022); doi: 10.1063/5.0074261                                                                                                               29, 012505-8
Published under an exclusive license by AIP Publishing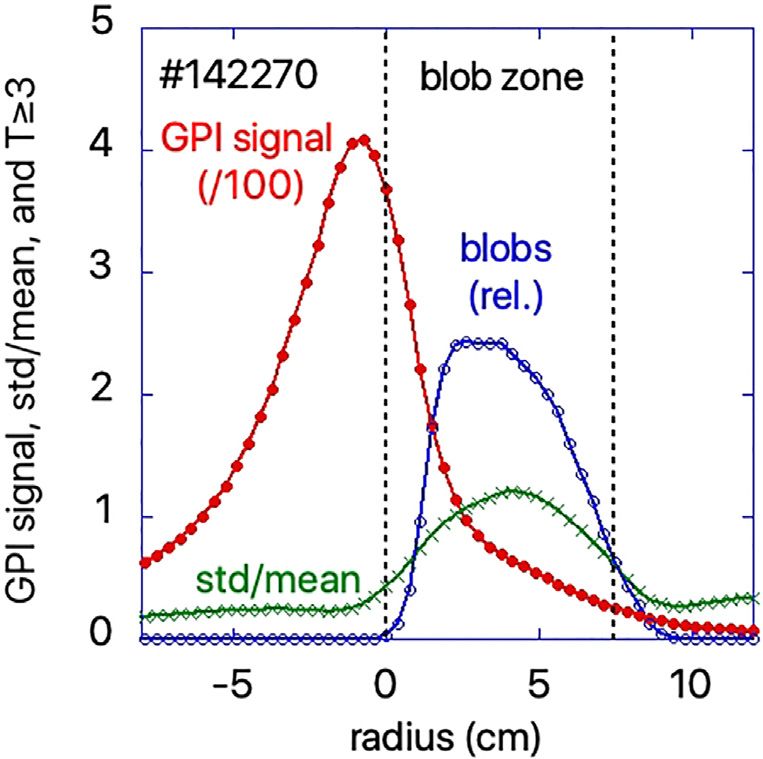
Physics of Plasmas                                                                                                  ARTICLE               scitation.org/journal/php

     FIG. 8. Comparison between blob analysis done using contour mapping and the PDF threshold for all 103 shots in the database. Only closed contours were counted as blobs
     when they had a contiguous area of 1.4 cm2 above the normalized threshold level of T ¼ 3. (a) Average blob area/frame vs the fraction of pixels above T ¼ 3, which shows
     a high 0.96 correlation. (b) Number of blobs vs the fraction of pixels above T ¼ 3, which shows a moderate 0.79 correlation.

    C. Blob fraction vs edge parameters                                                        database. Examples of the Thomson scattering profiles for the two
          Since there was only a moderately high correlation of about 0.5                      sample shots of Fig. 3 at the times nearest the peak GPI signal are
    between the blob fractions and the global plasma parameters as                             shown in Fig. 9, with the electron density in Fig. 9(a) and the electron
    shown in Fig. 6 and Table I, it is interesting to see if the local edge                    temperature in Fig. 9(b). As usual, the Ohmic #138 121 shot has a rela-
    parameters correlate better with fb. It would also be more physically                      tively low edge density and temperature and the H-mode shot
    meaningful to relate SOL blobs with edge rather than global parame-                        #141 324 has a higher edge density and temperature with an edge ped-
    ters; for example, blob formation has previously been linked in the-                       estal. These profiles were spline fit to interpolate between the measured
    ory to the region of velocity shear17,18 or to the maximum pressure                        points, and a database of the values at 5 cm inside the separatrix was
    gradient.32                                                                                created. This location is shown by the dashed (for Ohmic) and solid
          The edge electron temperature and density were measured with                         (for H-mode) vertical lines in Fig. 9. This is at the top of the edge den-
    Thomson scattering at the outer midplane on 102/103 shots in this                          sity pedestal for the H-mode case.

     FIG. 9. Thomson scattering edge profiles for the two sample shots at the times nearest the peak GPI signal, with the electron density in figure (a) and the electron temperature
     in figure (b). The Ohmic #138 121 shot (dashed line) has a relatively low density and temperature and the H-mode shot #141 324 (solid line) has a higher density and temperature
     with a high edge density pedestal. The radial locations at 5 cm inside the separatrix are shown by dashed and solid vertical lines for Ohmic and H-mode cases, respectively.

Phys. Plasmas 29, 012505 (2022); doi: 10.1063/5.0074261                                                                                                                  29, 012505-9
Published under an exclusive license by AIP Publishing
Physics of Plasmas ARTICLE scitation.org/journal/php
Figure 10 shows the relationship between the blob fraction and most highly correlated of the global parameters such as the NBI power
the electron density and temperature at 5 cm inside the separatrix for and density. It is also somewhat surprising that for blob fractions in
102/103 shots in this database. The points with n 2.7 1013 cm3 the range 1.5%–3.5% in Fig. 10 (which constitute most of the data),
and Te 0.15 keV are H-mode shots, identified by their large edge there was a mixture of both Ohmic and H-mode shots. Evidently,
density and density gradient, and indicated by the filled symbols shots with H-mode edges do not always have lower blob fractions
(58 shots). Almost all (56/58) of the H-mode shots have NBI power than Ohmic shots, although there is an overall statistical trend in this
1.8 MW. The shots with the lowest blob fractions fb < 1.5% direction.
were almost all H-mode and the shots with the highest blob fractions
fb > 3.5% were almost all Ohmic; but, for intermediate blob fractions D. Blob fraction vs edge turbulence velocity
fb ¼ 1.5%–3.5% there were both H-mode and Ohmic shots. This mix-
ture resulted in the moderate correlation of 0.43 to 0.45 between The measured blob fraction in NSTX might be related to the pro-
these densities and temperatures and the blob fraction, as shown in cess of blob formation by the velocity shear of edge turbulence, as
Table II, with an average blob fraction of fb ¼ 2.1 6 0.8% for the described, for example, in Refs. 17 and 33. This mechanism presum-
H-mode shots and fb ¼ 3.1 6 1.0% for the Ohmic/L-mode shots. Note ably applies to the turbulence inside the separatrix where blobs are cre-
that within either the H-mode or Ohmic shots taken separately, there ated, which then propagate into the SOL.
appears to be little variation in fb over this whole range. The poloidal and radial edge turbulence velocities were evaluated
Other potential relationships between the Thomson data and the using a 2D cross correlation technique similar to that described
blob fractions were also examined but not shown in Table II. The cor- recently.34 The full 10 ms time series from a single pixel in the normal-
relation of the electron pressure (density times temperature) at 5 cm ized image data was cross-correlated with time-delayed time series
with the blob fraction was 0.44, and the correlation of fb with elec- from all neighboring pixels using a delay time of two frames (5 ls).
tron collisionality (neTe1.5) at 5 cm was 0.27. The correlations of The location of the maximum of the time-delayed cross correlation
the blob fraction and the ne and Te measured at 3 cm inside the sepa- coefficients was used to determine the movement of the turbulence in
ratrix (instead of 5 cm) were 0.42 and 0.43, respectively. The cor- the GPI image plane, i.e., the 2D turbulence velocity was evaluated
relations with ne and Te measured 16 ms before the time nearest the from the displacement of the maximum of this time-delayed correla-
peak GPI signal used in Fig. 10 were 0.44 and 0.43, respectively. tion. This analysis was done separately for every radial image column
The correlations of the electron density and temperature gradients within 65 cm of the separatrix starting from the middle row of the
averaged over 5 to 0 cm inside the separatrix were in the same range, image (#40), and these results were averaged with results from rows
since the density and temperature at the separatrix were much smaller #30 and #50 in the 80 row images. Note that this analysis did not
than at 5 cm (see Fig. 9). Finally, the small edge density peak (“ear”) attempt to identify individual blob structures but uses only the nor-
that occurred in 16/58 shots with the H-mode, such as the one shown malized GPI time series. Further details are described in Appendix B.
in Fig. 9(a), was not significantly correlated with the blob fraction. Figure 11 shows the results of this turbulence velocity analysis for
The conclusion of this section is that the edge electron parame- the two sample shots used above: one an Ohmic shot (#138 121) and
ters were not much better correlated with the blob fractions than the one an H-mode shot (#141 324). Interestingly, the Ohmic shot has a
FIG. 10. Relationship between the blob fraction and the edge electron density and electron temperature at 5 cm inside the separatrix for 102/103 shots in the database. (a)
Electron density and (b) electron temperature. Shots with H-mode edges are shown by solid symbols. There is a moderately high correlation between the blob fraction and the
edge density and temperature, although for a blob fraction of fb ¼ 1.5%–3.5% there is a wide variation of electron density and temperature. Most of the error bars are smaller
than the symbol size. The straight lines are a linear fit through all of the data.
Phys. Plasmas 29, 012505 (2022); doi: 10.1063/5.0074261 29, 012505-10
Published under an exclusive license by AIP PublishingPhysics of Plasmas ARTICLE scitation.org/journal/php
FIG. 11. Sample radial profiles of the turbulence velocity as evaluated using GPI image data. The Vpol profiles in figure (a) for the Ohmic shot (#138 121) have more radial
shear inside the separatrix than the Vpol profiles for the H-mode shot (#141 324). Negative poloidal velocities correspond to rotation in the ion diamagnetic direction. The Vrad
profiles in figure (b) are radially outward (positive) in the SOL for both shots and nearly flat vs radius for the Ohmic shot.
larger poloidal velocity gradient inside the separatrix than the H-mode velocity Vpol as shown in Fig. 12(b) was almost always outward at this
shot. The reversal in poloidal turbulence velocity direction from the location, and there was a very low 0.02 correlation between the blob
electron diamagnetic direction inside (positive in this plot) to the ion fraction and Vrad.
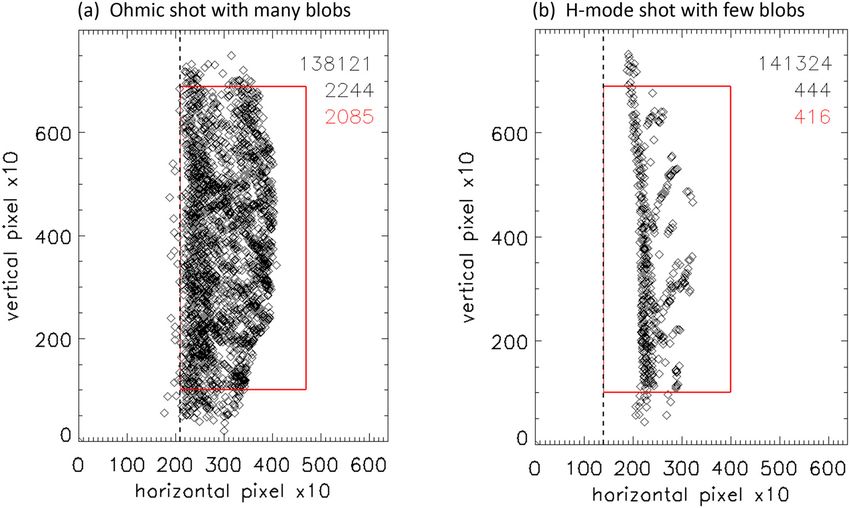
diamagnetic direction outside the separatrix has been seen before in Figure 13 shows the blob fractions vs the maximum and mini-
Ohmic plasmas in NSTX9 and other tokamaks. The velocity profile in mum of the radial gradients of the turbulence velocities within the
the H-mode case is relatively flat inside the separatrix, even in the region region 3 to 0 cm inside the separatrix. In Fig. 13(a) are the minimum
of the pedestal gradient just inside the separatrix shown in Fig. 10. negative (red) and maximum positive gradients (blue) in Vpol, and in
This measured poloidal velocity of the turbulence in Fig. 11 may Fig. 13(b) are the same quantities for Vrad (a negative gradient means
be influenced by both the background E B and diamagnetic velocities. more negative with increasing radius). The largest minimum negative
In previous SOLT simulations of an Alactor C-Mod discharge,35 various Vpol gradients are for Ohmic plasmas like #138 121, such as shown in
measures of the poloidal blob velocity were compared with the E B, Fig. 11(a). The correlation of 0.61 between the blob fraction and the
diamagnetic, phase, and group velocities showing a complex relation- minimum negative gradient of Vpol is relatively high, as shown in
ship in detail, but nonetheless with common trends. These profiles may Table II, while the correlation of 0.39 with the maximum positive
also be affected by NBI-induced toroidal rotation, which creates an gradient of Vpol is lower. Figure 13(b) shows that the blob fractions do
apparent poloidal turbulence velocity in the negative (ion diamagnetic) not vary significantly with the positive or negative gradients in Vrad,
direction in the GPI field of view. The radial turbulence velocity in with both correlations below 0.15 (not shown in Table II).
Fig. 11(b) is outward (positive) in the SOL, as seen previously in NSTX9 In addition, when the minimum negative and maximum positive
and many other tokamaks, but it is inward just inside the separatrix for gradients in Vpol and Vrad were evaluated over the radial range of 0 to
this H-mode shot, as also seen in TCV.26 We presently have no good þ3 cm in the SOL (instead of 3 to 0 cm as above), the correlations
theoretical explanation for this inward turbulence propagation. with the blob fraction were all below 0.2 (not shown in Table II).
Figure 12(a) shows the poloidal turbulence velocities Vpol for In conclusion, a significant correlation of 0.61 was found between
100/103 shots evaluated at 3 cm inside the separatrix vs the blob the blob fraction and the turbulence poloidal velocity inside the sepa-
fraction as defined in Sec. III A (three shots had the separatrix too near ratrix, as shown in Fig. 12(a), and a similarly high correlation of 0.61
the inner edge of the GPI image to evaluate this velocity). Among the was found between the blob fraction and the maximum negative gra-
shots with the lowest blob fractions fb < 1.5%, almost all had a nega- dient of the turbulence poloidal velocity inside the separatrix, as shown
tive Vpol corresponding to H-mode plasmas (like #141 324), while in Fig. 13(a). In other words, shots that have a large positive Vpol inside
almost all shots with the highest blob fractions fb > 3.5% had a posi- the separatrix or have a large negative Vpol gradient inside the separa-
tive Vpol corresponding to Ohmic plasmas (like #138 121). However, trix have a lower blob fraction. A possible cause for this correlation is
for blob fractions of fb ¼ 1%–3.5%, which comprise most of the data, discussed further in Sec. IV C.
the Vpol could be in either direction. The correlation of the blob frac-
tion with Vpol over all 100 shots was 0.61, which is the highest correla- IV. DISCUSSION
tion coefficient in Table II. Note that the sign of the Vpol values do not This section discusses the results and their possible theoretical
directly affect this correlation, just the relative values of Vpol with interpretations. Section IV A gives a summary of the blob fraction cor-
respect to the average of Vpol [see Eq. (2)]. The radial turbulence relations, Sec. IV B discusses how blob fractions might be understood
Phys. Plasmas 29, 012505 (2022); doi: 10.1063/5.0074261 29, 012505-11
Published under an exclusive license by AIP PublishingPhysics of Plasmas ARTICLE scitation.org/journal/php
FIG. 12. Turbulence velocities for 100/103 shots evaluated at 3 cm inside the separatrix vs the blob fraction. The poloidal velocity Vpol is shown in figure (a) and the radial
velocity Vrad is shown in figure (b). The shots with low blob fractions have a large negative Vpol corresponding to H-mode shots like #141 324, while the shots with high blob
fractions have a large positive Vpol corresponding to Ohmic shots like #138 121. The correlation of the blob fraction with Vpol was a relatively high, 0.61, but the correlation of
the blob fraction with Vrad was a low, 0.02 (see Table II). The straight lines are linear fits through the data.
theoretically, Sec. IV C compares the measured blob fractions with a parameters were best correlated with this blob fraction. The correla-
blob birth model, and Sec. IV D discusses the relationship of the blob tion results are summarized in Table II, which lists seven global plasma
fraction to the intermittency parameter of statistical theories. Sections parameters, six local edge parameters, along with three parameters
IV E and IV F present results of the blob fraction in reduced model related to the blob birth model to be described in Sec. IV C.
computer turbulence simulations for the NSTX and Aditya-U devices, The plasma parameters with the highest correlation with blob
and Sec. IV G discusses ways in which the theory–experiment connec- fraction over this database were the NBI power and total stored energy
tion might be improved. (0.47 to 0.48), the outer midplane gap (0.51), the line-averaged
density (0.48), the turbulence Vpol at 3 cm (0.61), and the maxi-
A. Summary of blob fraction correlations mum turbulence Vpol gradient over the range of 3 to 0 cm (0.61).
The goal of this paper was to estimate the relative blob fraction Plots of these correlations were shown in Figs. 6, 12, and 13. The
for a large database of NSTX shots and to find which plasma parameters in Table II with the lowest correlations were the plasma
FIG. 13. Radial gradients of the turbulence velocities within 3 to 0 cm inside the separatrix vs the blob fractions. (a) Minimum negative gradients of Vpol (red) and maximum
positive gradients in Vpol (blue) and (b) the same quantities for Vrad. The largest gradients are negative for Ohmic plasmas like #138 121, such as shown in Fig. 11(a).
Phys. Plasmas 29, 012505 (2022); doi: 10.1063/5.0074261 29, 012505-12
Published under an exclusive license by AIP PublishingPhysics of Plasmas ARTICLE scitation.org/journal/php
current (0.03), the turbulence Vrad at 3 cm (0.02), the confinement quantitative comparison of theory and experiment, the actual NSTX
time (0.09), and turbulence autocorrelation time (0.03). profiles and resulting GPI emission should be used in the simulations,
The clearest simplifying pattern in these correlations is that shots but this is beyond the scope of the present paper.
with the lowest blob fraction tended to be H-mode plasmas with rela-
tively high edge density, large negative Vpol, and low Vpol gradients C. Blob fraction vs analytic blob birth criterion
inside the separatrix, whereas shots with the highest blob fraction tend
From earlier calculations17 using a Taylor expansion of vErn
to be Ohmic shots with relatively low edge density, large positive Vpol,
and retaining the leading radial derivatives of the flow, it can be shown
and high negative Vpol gradients inside the separatrix, as shown in
in normalized variables that
Figs. 11–13. However, in the middle range of blob fractions (fb
¼ 1.5%–3.5%) there were both H-mode and Ohmic plasmas, so that 1 @n dx ð1=BÞ@Ex @Ey
the overall correlation is only 60%. Thus, there seems to be some ¼ þ ð1=BÞ ; (3)
n @t dy @x @x
hidden variable that determines the blob fraction in this intermediate
range. A somewhat surprising result is the decrease in blob fraction where x and y are the radial and poloidal variables, respectively, and dx
with increased outer midplane gap, as shown in Fig. 6(d); however, ¼ drad and dy ¼ dpol are the radial and poloidal width of the blob,
this gap in this database is fairly well correlated with the NBI power. respectively. Here, the blob velocities are given by the E B drifts and
Of course, the NBI power is well correlated with the stored energy, (1/B)@Ex/@x and (1/B)@Ey/@x are proportional to the radial derivatives
0 0
average density, and the edge parameters due to the dominant effect of of the E B fluid velocities Vpol and Vrad . Parallel losses of blob den-
NBI heating in high-powered discharges. sity are neglected on the short timescale under consideration.
It should be noted that the exact value of these correlations The above equation in terms of the blob formation implies that
depends on the distribution of shot types, which was not explicitly !
controlled in this database. For example, if nearly all of the shots in the Dnb dx ð1=BÞ@Ex @Ey
¼ cDtb þ ð1=BÞ : (4)
database were Ohmic, then the correlation of blob fraction with NBI n dy c@x c@x
would not be strong. Thus, the numerical results of Table II should be
considered to be estimates of the blob fraction trends in this NSTX Here, c is the linear growth rate of the plasma interchange turbulence,
dataset, and not as precise physical correlations. which is the underlying instability in this model and Dtb indicates the
typical blob formation time from the shearing of a radially elongated
B. Theory of the blob fraction streamer. This time should be smaller than the inverse of growth rate
c; Dtb < 1/c since for blob formation the shearing rate is much faster
The blob fraction defined in this paper, which is also related to than the interchange growth rate evaluated at the location where the
the “packing fraction,”3 is proportional to the blob generation rate and blobs form. Therefore, the parameter cDtb can be smaller than unity,
to the duration of time the blob spends in the SOL region under con- cDtb < 1. The parameter Dnb can be related to a density excursion
sideration. More precisely, instead of the blob generation rate we that is greater than some threshold. Using a time-averaged notation,
should speak of the blob detection rate, since the latter folds in the Eq. (4) can be written as
somewhat arbitrary criterion of what defines a blob at the location of
the detection point. The experimental data suggest that the blob radial Dnb dx ð1=BÞ@Ex @Ey
velocity, if proxied by Vrad, is not well correlated with the blob fraction ¼ cDtb þ ð1=BÞ : (5)
n dy c@x c@x
(see Table II and the discussion of Fig. 12). This focuses consideration
on how the rate at which blobs are produced and detected is affected The LHS is related to the blob fraction and RHS is associated with the
by one of the main correlations, velocity shear. blob formation criterion.
In Sec. IV C, we compare an analytic theory for blob formation The analytical criterion for blob birth in Ref. 17 related to the
by velocity shear with the experimental results on blob fraction. In Sec. RHS of Eq. (5) can be rewritten in terms of NSTX GPI parameters as
IV D, we review an analytic statistical theory of blobs and derive its follows:
implications for the blob fraction. In Secs. IV E and IV F, we consider 0
ðVpol 0
=cÞ ðdrad =dpol Þ þ Vrad =c > 1: (6)
some specific simulation results shedding light on the various roles
that velocity shear can play in the formation and release of blobs into Recently, an initial attempt was made to validate this model using spa-
the SOL. Mechanisms related to velocity shear include the creation of tially localized and time-resolved GPI analysis for two shots in
blobs by the local shearing of streamers, the suppression of turbulence NSTX.33 Here, Vpol 0
is the magnitude (absolute value) of the local
0
and blob propagation by (zonal or mean flow) shear layers, and the poloidal velocity gradient, Vrad is the magnitude (absolute value) of
possibility of velocity shear-induced instabilities. the local radial velocity gradient, c is the linear interchange growth
Note that the theoretical blob fractions in this section will be eval- rate, and drad and dpol are the radial and poloidal turbulence correla-
uated using electron density fluctuations as a proxy for the GPI signal tion lengths, respectively.
fluctuations, which is a fairly good approximation in the edge and A rough estimate of the blob birth criterion in Eq. (6) for the pre-
SOL of NSTX as mentioned in Sec. II A. Note also that for the simula- sent database can be made using the time-averaged velocity analysis
tion results in Secs. IV E and IV F, the definition of blob fraction differs from Sec. III D and comparing the results with the blob fractions of
from that in Eq. (1) in order to allow better statistics. Although the Sec. III A. For each shot, the minimum negative poloidal velocity gradi-
connections with experiment in this section are qualitative at best, ent and minimum negative radial velocity gradient from Fig. 13 were
0 0
these theoretical results are included to help further the long-term goal used as proxies for Vpol and Vrad in Eq. (6), since these negative gra-
of understanding the trends in the data of Sec. III. For a more dients (red in Fig. 13) are larger (on average) than the maximum
Phys. Plasmas 29, 012505 (2022); doi: 10.1063/5.0074261 29, 012505-13
Published under an exclusive license by AIP PublishingYou can also read