Correlating Dose Variables with Local Tumor Control in Stereotactic Body Radiation Therapy for Early-Stage Non-Small Cell Lung Cancer: A Modeling ...
←
→
Page content transcription
If your browser does not render page correctly, please read the page content below
www.redjournal.org

Physics Contribution

Correlating Dose Variables with Local Tumor
Control in Stereotactic Body Radiation Therapy
for Early-Stage Non-Small Cell Lung Cancer: A
Modeling Study on 1500 Individual Treatments
Rainer J. Klement, PhD,* Jan-Jakob Sonke, PhD,y
Michael Allgäuer, MD,z Nicolaus Andratschke, MD,x
Steffen Appold, MD,k José Belderbos, MD, PhD,y Claus Belka, MD,{
Oliver Blanck, PhD,# Karin Dieckmann, MD,** Hans T. Eich, MD,yy
Frederick Mantel, MD,zz Michael Eble, MD,xx Andrew Hope, MD,kk
Anca L. Grosu, MD,{{ Meinhard Nevinny-Stickel, MD,##
Sabine Semrau, MD,*** Reinhart A. Sweeney, MD,*
Juliane Hörner-Rieber, MD,yyy Maria Werner-Wasik, MD,xxx
Rita Engenhart-Cabillic, MD,kkk Hong Ye, PhD,{{{ Inga Grills, MD,{{{
and Matthias Guckenberger, MDx
*Department of Radiotherapy and Radiation Oncology, Leopoldina Hospital Schweinfurt,
Schweinfurt, Germany; yDepartment of Radiation Oncology, Netherlands Cancer Institute,
Amsterdam, Netherlands; zDepartment of Radiotherapy, Barmherzige Brüder Regensburg,
Regensburg, Germany; xDepartment of Radiation Oncology, University Hospital Zurich, Zurich,
Switzerland; kDepartment of Radiation Oncology, Technische Universität Dresden, Dresden,
Germany; {Department of Radiation Oncology, University Hospital of Ludwig-Maximilians-University
Munich, Munich, Germany; #Department of Radiation Oncology, Universitätsklinikum Schleswig-
Holstein, Kiel, Germany; **Department of Radiotherapy, Medical University of Vienna, Vienna,
Austria; yyDepartment of Radiotherapy, University Hospital Münster, Münster, Germany;
zz
  Department of Radiotherapy and Radiation Oncology, University Hospital Wuerzburg, Wuerzberg,
Germany; xxDepartment of Radiation Oncology, RWTH Aachen University, Aachen, Germany;
kk
   Department of Radiation Oncology, University of Toronto and Princess Margaret Cancer Center,
Toronto, Canada; {{Department of Radiation Oncology, University Hospital Freiburg, Freiburg,
Germany; ##Department of Radiation Oncology, Medical University Innsbruck, Innsbruck, Austria;
***Department of Radiation Oncology, Friedrich-Alexander University Erlangen-Nuremberg,

    Corresponding author: Rainer J. Klement, PhD; E-mail: rainer_                Disclosures: I.G. reports grants from Elekta during the conduct of the
klement@gmx.de                                                               study. A.H. reports grants and nonfinancial support from Elekta during the
    Inga Grills and Matthias Guckenberger made equal contributions to        conduct of the study. J.-J.S. has received research grants and royalties from
this study.                                                                  Elekta Oncology, Ltd, and holds patents with royalties paid to Elekta.
    This research was partially supported through an Elekta research grant       Data sharing statement: Research data are not available at this time.
with 5 institutions being members of the Elekta Lung Research Group.             Supplementary material for this article can be found at https://doi.org/
                                                                             10.1016/j.ijrobp.2020.03.005.

Int J Radiation Oncol Biol Phys, Vol. 107, No. 3, pp. 579e586, 2020
0360-3016/$ - see front matter  2020 Elsevier Inc. All rights reserved.
https://doi.org/10.1016/j.ijrobp.2020.03.005
580   Klement et al.                                               International Journal of Radiation Oncology  Biology  Physics

Erlangen, Germany; yyyDepartment of Radiation Oncology, University Hospital Heidelberg,
Heidelberg, Germany; xxxDepartment of Radiation Oncology, Thomas Jefferson University Hospital,
Philadelphia, Pennsylvania; kkkDepartment of Radiotherapy and Radiation Oncology, Phillips-
University Marburg, Marburg, Germany; and {{{Department of Radiation Oncology, William
Beaumont Hospital, Royal Oak, Michigan

Received Nov 26, 2019. Accepted for publication Mar 2, 2020.

Background: Large variation regarding prescription and dose inhomogeneity exists in stereotactic body radiation therapy
(SBRT) for early-stage non-small cell lung cancer. The aim of this modeling study was to identify which dose metric cor-
relates best with local tumor control probability to make recommendations regarding SBRT prescription.
Methods and Materials: We combined 2 retrospective databases of patients with non-small cell lung cancer, yielding 1500
SBRT treatments for analysis. Three dose parameters were converted to biologically effective doses (BEDs): (1) the (near-
minimum) dose prescribed to the planning target volume (PTV) periphery (yielding BEDmin); (2) the (near-maximum) dose
absorbed by 1% of the PTV (yielding BEDmax); and (3) the average between near-minimum and near-maximum doses
(yielding BEDave). These BED parameters were then correlated to the risk of local recurrence through Cox regression.
Furthermore, BED-based prediction of local recurrence was attempted by logistic regression and fast and frugal trees. Models
were compared using the Akaike information criterion.
Results: There were 1500 treatments in 1434 patients; 117 tumors recurred locally. Actuarial local control rates at 12 and 36
months were 96.8% (95% confidence interval, 95.8%-97.8%) and 89.0% (87.0%-91.1%), respectively. In univariable Cox
regression, BEDave was the best predictor of risk of local recurrence, and a model based on BEDmin had substantially less
evidential support. In univariable logistic regression, the model based on BEDave also performed best. Multivariable classi-
fication using fast and frugal trees revealed BEDmax to be the most important predictor, followed by BEDave.
Conclusions: BEDave was generally better correlated with tumor control probability than either BEDmax or BEDmin. Because
the average between near-minimum and near-maximum doses was highly correlated to the mean gross tumor volume dose,
the latter may be used as a prescription target. More emphasis could be placed on achieving sufficiently high mean doses
within the gross tumor volume rather than the PTV covering dose, a concept needing further validation.  2020 Elsevier
Inc. All rights reserved.

Introduction                                                       review of ICRU report 91, “[t]his comes as no surprise as
                                                                   there is a lack of consensus on the most relevant dosimetric
                                                                   parameters influencing local tumor control.”15
Stereotactic body radiation therapy (SBRT) is defined as a
method of external beam radiation therapy in which a clearly          Many previous studies have either correlated the
                                                                   isocenter/near-maximum dose or the dose prescribed to the
defined extracranial target volume is treated with high pre-
                                                                   PTV periphery with tumor control probability (TCP).16-20
cision and accuracy with a high radiation dose in a single or a
                                                                   However, these single dose-volume histogram parameters
few fractions with locally curative intent.1 SBRT is increas-
                                                                   do not comprehensively describe the dose distribution within
ingly used for the treatment of primary non-small cell lung
                                                                   the PTV and are therefore insufficient in particular for
cancer (NSCLC),1 prostate cancer,2 hepatic cancers,3 and
                                                                   reproducible inverse treatment planning. The aim of this
other primary malignancies as well as extracranial oligo-
                                                                   paper is to identify whether a combination of both dose pa-
metastases.4-6 The technological, quality, and dosimetry re-
quirements for performing SBRT have been summarized in             rameters would be better associated with local tumor control,
                                                                   which would allow better standardization of SBRT practice.
multiple national and international guidelines1,7-9 and
                                                                   This study is based on 2 large, retrospective patient databases
recently in detail in report 91 of the International Commis-
                                                                   that contain sufficiently large variation in SBRT practice to
sion on Radiation Units and Measurements (ICRU), pub-
                                                                   identify optimal SBRT planning characteristics.
lished in 2017.10 According to the ICRU report 91, doses in
SBRT should be prescribed to the planning target volume
(PTV) covering the isodose surface. However, current SBRT
practice frequently uses inhomogeneous dose distributions          Methods and Materials
within the target volume, and large interinstitutional and
intrainstitutional variation in the degree of dose in-             Patients and treatments
homogeneity has been reported in planning studies11 and in
clinical routine12-14; this important issue of dose prescription   This modeling study is based on 2 large retrospective da-
remains unspecified in ICRU report 91. According to a recent        tabases of patients with early-stage NSCLC treated with
Volume 107 Number 3 2020 Correlating dose variables with TCP 581
SBRT (1-10 fractions, median 3 fractions). One is the Differences in AICc measure the strength of evidence for
Elekta Collaborative Lung Research Group (ECLRG) one model over another, and models differing by more than
database16,21; the other is the database of the working group 8 from the model with the lowest AICc were considered to
“Stereotactic Radiotherapy and Radiosurgery” of the have substantially less evidential support from the data.24
German Society for Radiation Oncology (DEGRO).13,17 In a second analysis, we treated the prediction of local
Except for 59 treatments performed with a robotic linear tumor control as a classification task that presupposes that
accelerator (CyberKnife), all SBRT was delivered using 6 there are 2 classes of tumors: one that remains locally
to 18 MV photons delivered by standard clinical linear controlled and one that will regrow. Toward this aim, we
accelerators; for details on treatment planning, patient decided to assume tumors as controlled if they remained
immobilization, and image guidance, see the references controlled after at least 4 years of follow-up; only 7 out of
given above. Only patients with stage I disease according to 117 local recurrences (6%) were recorded after 4 years.
the seventh lung cancer TNM classification and staging Patients lost to follow-up (censored) before 4 years were
system22 with complete information on prescribed PTV therefore not considered for this analysis, yielding a sample
dose and number of fractions and not lost to follow-up of 386 patients with 401 treated tumors, of which 117 had
within 1 month were considered for this analysis. Follow- recurred. The resulting data set was thus more balanced
up was defined as the time interval between the start of with respect to the binary endpoint of local control and
SBRT and local failure or censoring, respectively. This local failure than the full data set.
resulted in 875 patients treated for 940 lesions from the The main classification method was logistic regression
ECLRG database and 559 patients treated for 560 lesions (LR), which estimates for each treated tumor a TCP by
from the DEGRO database. Regular computed tomography fitting
scans were performed during follow-up, and local recur-
exp b0 þ xTi b
rence was defined as radiologic disease progression in the yi Z ð2Þ
1 þ exp ðb0 þ xTi bÞ
treated lung parenchyma.
Three PTV dose-volume histogram parameters per where yi Z 1 if the tumor was controlled for patient i or
SBRT were considered in this study: (1) dose prescribed to p
yi Z 0 otherwise, and xTi bZ
P
the PTV periphery (the near-minimum dose Dmin); (2) the xij bj denotes the scalar
jZ1
dose absorbed by 1% of the PTV (PTV D1% or near-
product between the dose vector for patient i (consisting of
maximum dose Dmax); and (3) the average between Dmin
p dose parameters, p˛f1; 2; 3g) and the corresponding
and Dmax (Dave) as a proxy for the mean dose received by
vector of regression coefficients bZðb1 ; .; bp Þ: Note that
the tumor. For 483 patients lacking PTV D1%, this dose
for univariable analysis xij Zxi1 Z BEDi ; and the regression
parameter was estimated from the isocenter doses based on
a linear regression equation derived from 147 treatments for coefficients can be related to the well-known TCP model
which both PTV D1% and isocenter doses were available parameters introduced by Okunieff et al25 through
(Appendix EA.1, available online at https://doi.org/10. b0
TCD50 Z ð3Þ
1016/j.ijrobp.2020.03.005). b1
and
Statistical analysis 1
kZ ð4Þ
b1
For every patient i; Dmin, Dmax, and their average, Dave,
were converted to biologically effective doses (BEDs) ac- As in Cox regression, the various LR classification
cording to models were also compared using the AICc24 and by their
Di
(balanced) prediction accuracy (the average between
BEDi Z ni Di 1 þ ð1Þ sensitivity and specificity). Sensitivity denotes the proba-
a =b
bility of classifying a tumor as locally controlled given that
where ni denotes the number of fractions, Di the dose per it remains locally controlled, and specificity denotes the
fraction, and a/b is set to 10 Gy. probability of classifying a tumor as recurrent given that it
Collinearity among the 3 dose parameters (BEDmin, will regrow.
BEDmax, BEDave) was assessed using variance inflation In a third analysis, we performed variable selection
factors (VIFs) and hierarchical clustering with Spearman’s using 2 further classification algorithms: (1) LR with the
rank correlation coefficients (r) as the similarity measure.23 least absolute shrinkage and selection operator (LASSO)
In the first analysis, the 3 BED parameters were then method, which shrinks regression coefficients of unimpor-
correlated to the risk of local recurrence through Cox tant variables to 026; and (2) fast and frugal trees (FFTs).
regression using the full sample of 1500 treatments. A FFTs are decision trees with exactly 2 branches extending
separate Cox model was fitted to each dose parameter and from each node, and either one or both branches are an exit
each possible combination of dose parameters. The best- branch leading to a classification decision.27 This makes
fitting model was determined based on the Akaike infor- them easily interpretable and potentially attractive for
mation criterion with second-order bias correction (AICc). clinical decision-making.582 Klement et al. International Journal of Radiation Oncology Biology Physics
For all classification models, the test performance was sample and the subset of treatments used for classification
estimated by randomly splitting the data set into 2 equal- are given in Table 1.
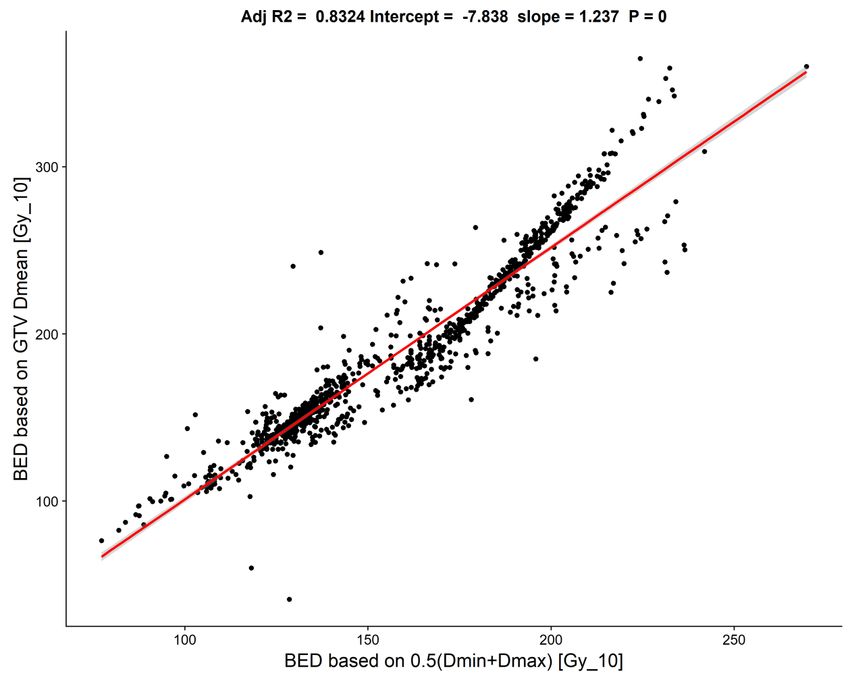
sized parts, of which one was used for training the classifier Plotting Dave against the planned gross tumor volume (GTV)
and the other was used as a test set. This was repeated 100 mean dose (GTV Dmean, Appendix EA.2, available online at
times. Using LASSO and FFTs, the relative “importance” https://doi.org/10.1016/j.ijrobp.2020.03.005) for the subset of
of the 3 dose parameters was estimated as the frequency our data for which the latter was known, we could show that
with which each dose parameter was selected into a trained both were highly correlated according to GTV Dmean Z 0.207
model and used for classification. þ 1.096 Dave. Using correlation coefficients, the GTV
All analyses were performed in R version 3.5.0 with the Dmean was closely correlated with Dave (r Z 0.931) and Dmax
glmnet package for building LASSO models and the (r Z 0.927), but not with Dmin (r Z 0.714). There was also a
FFTrees package for building FFTs. The latter were con- strong correlation between the BED based on the GTV Dmean
structed by maximizing the weighted accuracy given by and BEDave (r Z 0.962; Appendix EA.3, available online at
w sensitivity þ ð1 wÞ specificity https://doi.org/10.1016/j.ijrobp.2020.03.005), and their relation
could be described by the formula BEDGTV_Dmean Z 7.838 þ
with w Z 0.4 at each feature selection level because in 1.237 BEDave, showing that the BED based on the average
practice specificity (correct classification of local failure) between Dmin and Dmax tended to systematically overestimate
could be judged as more important than sensitivity. The the BED based on the GTV Dmean by z8 Gy10.
“ifan” algorithm, which assumes independence among the
features, was used for feature selection because it resulted
in more intuitively interpretable trees than the “dfan” al-
gorithm, which assumes dependencies among the features. Cox regression modeling results
The final tree was selected from a fan of 4 trees as the one
having the highest weighted accuracy. The correlation between BEDmin and BEDmax in the com-
Statistical significance was defined as P valuesVolume 107 Number 3 2020 Correlating dose variables with TCP 583
model based on BEDmin, which had AICc Z 1516.04, compared with 90% results in a much higher rate of correctly
rendering it substantially worse than all other models. classified tumors that were locally controlled (sensitivity) and
higher overall accuracy. At the 70% classification threshold, the
Logistic regression and FFT classification results model based on Dmin had a significantly lower classification
accuracy than that based on Dmax (P Z 6.722 10e8) or Dave (P
In the data set of 401 treatments used for classification, the < 2.2 10e16). At the 90% threshold, however, the difference
Spearman’s rank correlation coefficients among the 3 BED in model accuracy among the 3 univariable dose parameter
parameters and their VIFs in the LR models were compa- models was not significant (LR model based on Dmin vs Dmax: P
rable to those reported for Cox regression on the complete Z .375; Dmin vs Dave: P Z .039). The FFTs achieved compa-
data set. Accordingly, in the LR model containing BEDmin rable accuracy to the LR models, although they had a signifi-
and BEDmax, both variables were significantly associated cantly lower area under the curve.
with TCP, but if BEDmin or BEDmax were included in a The majority of LASSO models (93%) included 2 dose
model in addition to BEDave, their regression coefficient parameters, with the importance of predictors being BEDave
standard errors became inflated and P values became (selected into 92% of models) before BEDmin (85%) and
correspondingly large. The multivariable LR models yiel- BEDmax (18%). For FFTs, the importance of predictors was
ded AICc values of 421.1 to 421.3 (2 dose parameters) and BEDmax (selected into 100% of the trees) before BEDave
423.0 (3 dose parameters). Characteristics of the uni- (99%) and BEDmin (66%).
variable LR classification model fits are given in Table 2,
and their predicted TCP curves as a function of BED are Discussion
plotted in Figure 1. The AICc values show that the model
based on the average dose (BEDave) was preferred over all
the other models, with substantially more evidence in its In SBRT, there can be substantial heterogeneity in the PTV
favor compared with the model based on BEDmax. The dose prescription and distribution, with dose differences
classification performance measures in Table 2 assume that between the isocenter and PTV periphery of up to 50%. It is
a tumor will be controlled if its TCP is 70%. The 70% therefore not possible to know a priori which reported
threshold was chosen as a compromise in achieving both dosimetric parameter will best describe the doseeeffect
high sensitivity and specificity (ie, it was close to the relationship. In this work, we investigated the importance
threshold maximizing accuracy of the individual LR clas- of the 3 most relevant dosimetric parameters within the
sifiers). Given this threshold, the model based on BEDave context of SBRT: (1) the dose prescribed to the isodose
also achieved the highest classification accuracy. For an surface encompassing the PTV or near-minimum dose
alternative threshold of TCP 90%, the models predicted (Dmin), which is recommended by ICRU report 9110; (2) the
that BEDave >196 Gy10 and BEDmax >255 Gy10 would PTV D1% or near-maximum dose (Dmax); and (3) the
have to be prescribed to the PTV. average between Dmin and Dmax (Dave).
The FFT maximizing weighted accuracy with a sensi- Previous meta-analyses based on LR modeling and
tivity weight of 0.4 is depicted in Figure 2. This tree used including both conventionally and hypofractionated treatments
all dose parameters for classification and implied that of early-stage NSCLC have established doseeresponse re-
BEDmax was the best predictor of local failure. The sensi- lationships for both Dmin19,29 and Dmax19,30,31 after conversion
tivity, specificity, and accuracy achieved on the training into BEDs, as well as Dave after conversion into equivalent doses
data were 51.8%, 86.3%, and 69.0%, respectively. in 2-Gy fractions.32 In this work, we correlated these dose pa-
Table 3 shows the estimated test performance of all models rameters after conversion into BEDs with the risk of local
that was obtained after splitting the data set into a training and recurrence using Cox regression and to TCP using logistic
test set 100 times and averaging the results. The test perfor- regression and FFTs. We thereby found that most generally
mance was evaluated for 2 sensible TCP thresholds separately BEDave was the best predictor of tumor response. In Cox
(70% and 90%) to show the effects on sensitivity and specificity. regression, there was also evidence that the model based on
The results show that selecting a lower TCP threshold of 70% BEDmin resulted in a substantially worse fit to the data than
Table 2 Characteristics of the univariable logistic dose-response models*
Model parameter TCD50 , Gy k, Gy AICc Sensitivityy, % Specificityy, % Accuracyy, % BED for 70% TCP, Gy10
BEDmin 50.9 29.7 423.7 79.4 61.0 70.2 77
BEDmax 59.2 55.2 428.9 74.9 64.0 69.4 106
BEDave 62.6 38.0 420.0 75.3 68.0 71.6 95
Abbreviations: AICc Z Akaike information criterion with second-order bias correction; BED Z biologically effective dose; TCP Z tumor control
probability.
* TCD50 and k are the TCP model parameters that can be computed from the logistic regression coefficients b0 and b1 (Equations 3 and 4).
y
The classification performance is based on a probability threshold of 70% for classifying a tumor as locally controlled.584 Klement et al. International Journal of Radiation Oncology Biology Physics
1.0
1.0
1.0
0.8
0.8
0.8
Tumor control probability
0.6
0.6
0.6
0.4
0.4
0.4
0.2
0.2
0.2
0.0
0.0
0.0
0 50 100 150 0 50 100 150 200 250 300 350 0 50 100 150 200 250
BEDmin [Gy] BEDmax [Gy] BEDmean [Gy]
Fig. 1. Visualization of the logistic TCP models given in Table 2. There is 1 TCP point for each of 6 equally spaced bins
along the biologically effective dose axis, and each TCP point was calculated by dividing the number of locally controlled
tumors by the total number of tumors treated with a biologically effective dose falling within a given bin. Vertical bars
represent Bayesian binomial 95% confidence intervals estimated according to Cameron.43 Abbreviation: TCP Z tumor
control probability.
models based on the other dose parameters or combinations select 1 representative variable from each cluster.34 It follows
thereof. BEDmin was also the least important predictor in the that aside from BEDmin, either BEDave or BEDmax could be
FFT model (Fig. 2). In the LR model, however, the worst fit was chosen as the second variable for making predictions of TCP.
not obtained for BEDmin but for BEDmax. One explanation for This is what the LASSO method has effectively done.
this result could follow from the collinearity among the 3 dose The estimated LR test performance (ie, the performance
parameters. Hierarchical cluster analysis and VIFs revealed that expected when applied to a new data set) depended on the
although BEDmin and BEDmax were only moderately corre- choice of the TCP threshold used for classification. The
lated, there was high collinearity among all other BED com- optimal threshold at which the maximum accuracy was
binations. Collinearity explains why adding more dose achieved varied among the different dose parameters.
parameters to BEDave did not improve model performance and However, in practice one does not know the optimal
why performance was not clearly superior for one parameter threshold and has to decide on a certain probability cutoff.
over the others. One possible way to deal with collinearity is to Our choices of 70% and 90% represent 2 possible choices
combine the correlated variables into a single parameter,33 for assuming a tumor is locally controlled. The 70%
which is what we effectively did when creating Dave as the threshold was close to the TCP threshold at which the LR
average between Dmin and Dmax. This could explain why models achieved the highest accuracy when trained and
models based on BEDave had a higher maximum likelihood and applied to the complete data set. In both cases, BEDave
hence smaller AICc values than those based on either BEDmin or yielded the highest accuracy.
BEDmax. Another possibility is to build clusters of variables and Our results somewhat contradict a previous analysis on a
subset of the ECLRG database in which a better correlation
between local relapse and BEDmin compared with BEDave
BEDmax or BEDmax was observed in receiver operating character-
istics analysis.35 However, this previous analysis onlyVolume 107 Number 3 2020 Correlating dose variables with TCP 585
Table 3 Estimated test performance of the different classifiers
Sensitivity at Specificity at Accuracy at Sensitivity at Specificity at Accuracy at
Model AUC 90% TCP 90% TCP 90% TCP 70% TCP 70% TCP 70% TCP
LR: BEDmin 0.737 0.027 20.9 21.6 92.0 8.8 56.4 6.5 55.4 6.6 72.8 5.9 64.1 2.6
LR: BEDmax 0.735 0.028 18.5 8.7 93.1 3.7 55.8 3.0 63.9 5.1 68.6 7.6 66.3 2.9
LR: BEDave 0.740 0.027 24.2 11.0 91.8 4.6 58.0 3.6 59.6 5.9 75.0 6.7 67.3 2.2
LR: BEDmin 0.737 0.028 26.4 14.7 90.8 5.9 58.6 4.8 58.6 6.6 73.5 7.4 66.1 3.0
þ BEDmax
LR: LASSO 0.738 0.028 18.7 14.3 93.4 6.0 56.1 4.5 58.4 7.4 73.8 7.6 66.1 3.0
FFTs* 0.677 0.027 55.3 7.5 80.1 10.0 67.7 2.9 55.3 7.5 80.1 10.0 67.7 2.9
Abbreviations: AUC Z area under the curve; BED Z biologically effective dose; FFT Z fast and frugal tree; LASSO Z least absolute shrinkage and
selection operator; LR Z logistic regression; TCP Z tumor control probability.
* Note that the FFTs produce a discrete output (probability either 0 or 1).
distribution within the GTV, the variability of safety mar- tumors tended to receive a larger number of fractions (r Z
gins and GTV sizes, and tumor movement, as well as un- 0.048, P Z .091). When we restricted the analysis to tu-
certainties concerning the actual delivered dose owing to mors with known sizes and adjusted for maximum tumor
limitations of the adopted dose calculation algorithms used diameter, the results did not change qualitatively.
for treatment planning.17 Along these lines, Bibault et al Another limitation is that this study is only based on
showed that PTV D95% doses calculated by a type A al- planned doses, not taking their uncertainties into account.
gorithm correlated only weakly with GTV Dmean calcu- Furthermore, converting doses to BED comes with a
lated by a Monte Carlo algorithm, in particular for small scaling effect that makes small dose differences in deliv-
GTVs ( .25), because larger at least 150 Gy10 to achieve a TCP exceeding 90%.586 Klement et al. International Journal of Radiation Oncology Biology Physics
References reviewed clinical NSCLC treatment outcome data? Radiat Oncol
2016;11:67.
20. Liu F, Tai A, Lee P, et al. Tumor control probability modeling for
1. Guckenberger M, Andratschke N, Alheit H, et al. Definition of stereotactic body radiation therapy of early-stage lung cancer using
stereotactic body radiotherapy: Principles and practice for the treatment multiple bio-physical models. Radiother Oncol 2016;122:286-294.
of stage I non-small cell lung cancer. Strahlenther Onkol 2014;190:26- 21. Grills I, Hope A, Guckenberger M, et al. A Collaborative analysis of
33. stereotactic lung radiotherapy outcomes for early-stage nonesmall-
2. Alayed Y, Cheung P, Vesprini D, et al. SABR in high-risk prostate cancer: cell lung cancer using daily online cone-beam computed tomography
Outcomes from 2 prospective clinical trials with and without elective nodal image-guided radiotherapy. J Thorac Oncol 2012;7:542-551.
irradiation. Int J Radiat Oncol Biol Phys 2019;104:36-41. 22. Mirsadraee S, Oswal D, Alizadeh Y, et al. The 7th lung cancer TNM
3. Brunner TB, Blanck O, Lewitzki V, et al. Stereotactic body radio- classification and staging system: Review of the changes and impli-
therapy dose and its impact on local control and overall survival of cations. World J Radiol 2012;4:128-134.
patients for locally advanced intrahepatic and extrahepatic chol- 23. Harrell FE Jr. Regression Modeling Strategies. 2nd ed. New York:
angiocarcinoma. Radiother Oncol 2019;132:42-47. Springer; 2015.
4. Tree AC, Khoo VS, Eeles R, et al. Stereotactic body radiotherapy for 24. Burnham KP, Anderson DR. Multimodel inference: Understanding AIC
oligometastases. Lancet Oncol 2013;14:e28-e37. and BIC in model selection. Sociol Methods Res 2004;33:261-304.
5. Lewis SL, Porceddu S, Nakamura N, et al. Definitive stereotactic body 25. Okunieff P, Morgan D, Niemierko A, et al. Radiation dose-response of
radiotherapy (SBRT) for extracranial oligometastases. Am J Clin human tumors. Int J Radiat Oncol Biol Phys 1995;32:1227-1237.
Oncol 2017;40:418-422. 26. Friedman J, Hastie T, Tibshirani R. Regularization paths for generalized
6. Klement RJ, Abbasi-Senger N, Adebahr S, et al. The impact of local linear models via coordinate descent. J Stat Softw 2010;33:1-22.
control on overall survival after stereotactic body radiotherapy for 27. Phillips ND, Neth H, Woike JK, et al. FFTrees: A toolbox to create,
liver and lung metastases from colorectal cancer: A combined analysis visualize, and evaluate fast-and-frugal decision trees. Judgm Decis
of 388 patients with 500 metastases. BMC Cancer 2019;19:173. Mak 2017;12:344-368.
7. Videtic GMM, Donington J, Giuliani M, et al. Stereotactic body ra- 28. Benjamin DJ, Berger JO, Johannesson M, et al. Redefine statistical
diation therapy for early-stage non-small cell lung cancer: Eexecutive significance. Nat Hum Behav 2018;2:6-10.
summary of an ASTRO evidence-based guideline. Pract Radiat Oncol 29. Stuschke M, Pöttgen C. Altered fractionation schemes in radiotherapy.
2017;7:295-301. Front Radiat Ther Oncol 2010;42:150-156.
8. Guckenberger M, Andratschke N, Dieckmann K, et al. ESTRO 30. Mehta N, King CR, Agazaryan N, et al. Stereotactic body radiation
ACROP consensus guideline on implementation and practice of ste- therapy and 3-dimensional conformal radiotherapy for stage I non-
reotactic body radiotherapy for peripherally located early stage non- small cell lung cancer: A pooled analysis of biological equivalent
small cell lung cancer. Radiother Oncol 2017;124:11-17. dose and local control. Pract Radiat Oncol 2012;2:288-295.
9. Schneider BJ, Daly ME, Kennedy EB, et al. Stereotactic body radio- 31. Shuryak I, Carlson DJ, Brown JM, et al. High-dose and fractionation
therapy for early-stage non-small-cell lung cancer: American Society effects in stereotactic radiation therapy: Analysis of tumor control data
of Clinical Oncology endorsement of the American Society for Ra- from 2965 patients. Radiother Oncol 2015;115:327-334.
diation Oncology evidence-based guideline. J Clin Oncol 2018;36: 32. Jeong J, Oh JH, Sonke J-J, et al. Modeling the cellular response of
710-719. lung cancer to radiation therapy for a broad range of fractionation
10. Seuntjens J, Lartigau EF, Cora S, et al. ICRU report no. 91: Pre- schedules. Clin Cancer Res 2017;23:5469-5479.
scribing, recording, and reporting of stereotactic treatments with small 33. Midi H, Sarkar SK, Rana S. Collinearity diagnostics of binary logistic
photon beams. J ICRU 2014;14. regression model. J Interdiscip Math 2010;13:253-267.
11. Moustakis C, Blanck O, Ebrahimi Tazehmahalleh F, et al. Planning 34. Sanche R, Lonergan K. Variable reduction for predictive modeling with
benchmark study for SBRT of early stage NSCLC: Results of the clustering. Casualty Actuarial Society Forum, Winter 2006;89-100.
DEGRO working group Stereotactic Radiotherapy. Strahlenther Onkol 35. Kestin L, Inga G, Guckenberger M, et al. Dose-response relationship with
2017;193:780-790. clinical outcome for lung stereotactic body radiotherapy (SBRT) delivered
12. Daly ME, Perks JR, Chen AM. Patterns-of-care for thoracic stereo- via online image guidance. Radiother Oncol 2014;110:499-504.
tactic body radiotherapy among practicing radiation oncologists in the 36. van Baardwijk A, Tomé WA, van Elmpt W, et al. Is high-dose ste-
United States. J Thorac Oncol 2013;8:202-207. reotactic body radiotherapy (SBRT) for stage I non-small cell lung
13. Guckenberger M, Allgäuer M, Appold S, et al. Safety and efficacy of cancer (NSCLC) overkill? A systematic review. Radiother Oncol
stereotactic body radiotherapy for stage I Non-small-cell lung cancer 2012;105:145-149.
in routine clinical practice: a patterns-of-care and outcome analysis. J 37. Bibault JE, Mirabel X, Lacornerie T, et al. Adapted prescription dose
Thorac Oncol 2013;8:1050-1058. for Monte Carlo algorithm in lung SBRT: Clinical outcome on 205
14. Corso CD, Park HS, Moreno AC, et al. Stage I lung SBRT clinical patients. PLoS One 2015;10:1-10.
practice patterns. Am J Clin Oncol 2017;40:358-361. 38. Diamant A, Chatterjee A, Faria S, et al. Can dose outside the PTV
15. Wilke L, Andratschke N, Blanck O, et al. ICRU report 91 on pre- influence the risk of distant metastases in stage I lung cancer patients
scribing, recording, and reporting of stereotactic treatments with small treated with stereotactic body radiotherapy (SBRT)? Radiother Oncol
photon beams. Strahlenther Onkol 2019;195:193-198. 2018;128:513-519.
16. Ohri N, Werner-Wasik M, Grills IS, et al. Modeling local control after 39. Niemierko A. Reporting and analyzing dose distributions: A concept
hypofractionated stereotactic body radiation therapy for stage I non- of equivalent uniform dose. Med Phys 1997;24:103-110.
small cell lung cancer: a report from the Elekta collaborative lung 40. Shibamoto Y, Miyakawa A, Otsuka S, et al. Radiobiology of hypo-
research group. Int J Radiat Oncol Biol Phys 2012;84:e379-e384. fractionated stereotactic radiotherapy: What are the optimal fraction-
17. Guckenberger M, Klement RJ, Allgäuer M, et al. Applicability of the ation schedules? J Radiat Res 2016;57:i76-i82.
linear-quadratic formalism for modeling local tumor control proba- 41. Brown JM. The biology of SBRT: LQ or something new? Int J Radiat
bility in high dose per fraction stereotactic body radiotherapy for early Oncol Biol Phys 2018;101:964.
stage non-small cell lung cancer. Radiother Oncol 2013;109:13-20. 42. Klement RJ, Sonke JJ, Allgäuer M, et al. Estimation of the a/b ratio of
18. Tai A, Liu F, Gore E, et al. An analysis of tumor control probability of non-small cell lung cancer treated with stereotactic body radiotherapy.
stereotactic body radiation therapy for lung cancer with a regrowth Radiother Oncol 2020;142:210-216.
model. Phys Med Biol 2016;61:3903-3913. 43. Cameron E. On the estimation of confidence intervals for binomial
19. Santiago A, Barczyk S, Jelen U, et al. Challenges in radiobiological population proportions in astronomy: The simplicity and superiority of
modeling: Can we decide between LQ and LQ-L models based on the Bayesian approach. Publ Astron Soc Aust 2011;28:128-139.Appendix A A.1 Estimation of PTV D1% from isocenter dose All SBRT treatments from the xxx database had isocenter doses available, but PTV D1% was only available for a subset of 79 SBRT treatments from two institutions (Schweinfurt and Güstow). In contrast, the DVH parameters PTV D1% and GTV mean dose were available for all treatments within the ECLRG database. We therefore used the 79 treatments from the DEGRO database and 68 treatments from the ECLRG database from the University hospital of Würzburg for which both PTV D1% and isocenter doses were available in order to derive a linear regression equation which was used to estimate PTV D1% doses for all DEGRO treatments lacking DVH parameters (Figure A1). Figure A1: Calibration line for transforming Dmax in the DEGRO database to a D1% PTV parameter. The transformation is based on 68 treatments from the University Hospital of Würzburg (Germany) which are shared by both databases, 20 treatments from the Leopoldina Hospital in Schweinfurt (Germany)
and 59 treatments from the Cyberknife center in Güstrow (Germany) for which both variables were

available.

A.2 Estimation of GTV mean dose from isocenter and prescribed dose

Figure A2: Correlation between Dmean and the GTV mean dose based on 940 treatments from the
ECLRG database, 59 patients from the Cyberknife center in Güstrow (Germany) and 18 treatments
from the Leopoldina Hospital Schweinfurt (Germany) for which GTV mean dose, PTV 1% and the
prescribed dose to the PTV periphery were known.
A.3 Estimation of BED based on GTV mean dose from BEDave

Figure A3: Correlation between BEDave and the BED based on the GTV mean dose adopting an α/β
ratio of 10 Gy. The figure is based on the same subset of the data as Figure A2.
A.4 Analysis restricted to physical doses delivered in three fractions

We performed a re-analysis on the subgroup of patients having received three fractions, so that

physical doses instead of BEDs could be used for modelling. In total, 727 SBRTs were performed with

three fractions; median prescription doses (Dmin) and PTV D1% (Dmax) were 54 Gy (range 12−60 Gy)

and 68.6 Gy (32.9−92.4 Gy), respectively., resulting in a median Dave of 59.0 Gy (28.6−76.2 Gy).

Building a multivariable Cox model from all three dose parameters with the LASSO method resulted

in Dmax and Dave being selected into the model, but not Dmin. While the univariable Cox model based

on Dmax showed the best fit according to the AICc (378.3), it performed almost equal to the model

based on Dave (AICc=378.6), and both models had somewhat more evidential support than the model

based on Dmin (AICc=381.7). There was no substantially better support for multivariable models

compared to the univariable models. Building logistic regression models for classifying 33 local

recurrences and 159 tumors that remained locally controlled over at least 4 years, Dave (AICc=164.7)

was a better predictor than either Dmax (AICc=167.0) or Dmin (AICc=167.4). The LASSO method

selected only Dave into a potentially multivariable logistic regression model. Finally, a fast and frugal

tree built on all three dose parameters used only Dmax and Dave for deciding between local control and

recurrence (Figure A4).

                                                          Figure A4: Fast and frugal tree fitted to a

                                                          subset of tumors which had been treated with

                                                          three fractions and had either locally recurred

                                                          (N=33) or stayed controlled for at least four

                                                          years of follow-up (N=159).
You can also read