Coronavirus (COVID-19): Analysis
←
→
Page content transcription
If your browser does not render page correctly, please read the page content below
Coronavirus (COVID-19): Analysis

    Coronavirus (COVID-19): modelling the epidemic in Scotland
    (Issue No. 82)

    Background

    This is a report on the Scottish Government modelling of the spread and
    level of Covid-19 in Scotland. This updates the previous publication on
    modelling of Covid-19 in Scotland published on 10th December 2021.
    The estimates in this document help the Scottish Government, the
    health service and the wider public sector plan and put into place what is
    needed to keep us safe and treat people who have the virus.

    This edition of the research findings focuses on the epidemic as a whole,
    looking at estimates of R, growth rate and incidence as well as local
    measures of change in the epidemic. It looks at both the impact of the
    Delta and Omicron variants. We will update on a weekly basis as we
    know more about the Omicron variant.

    Key Points

    Based on at point when the Delta variant made up the majority of
    cases
    • The reproduction rate R in Scotland is currently estimated as being
      between 0.9 and 1.1, as of 30th November. This is unchanged since
      last week.
    • The number of new daily infections for Scotland is estimated as being
      between 96 and 128 as at 30th November, per 100,000 people.
    • The growth rate for Scotland is currently estimated as between -2%
      and 2% as at 30th November. The lower and upper limits have
      increased since last week.
    • This report normally contains three elements: UKSHA consensus,
      Scottish Government projections and SPI-M projections. Due to
      uncertainty surrounding the Omicron variant and its increasing
      prevalence across the UK, SPI-M has been unable to produce
      consensus medium-term projections for hospital admissions and
      deaths this week.
                                                                             1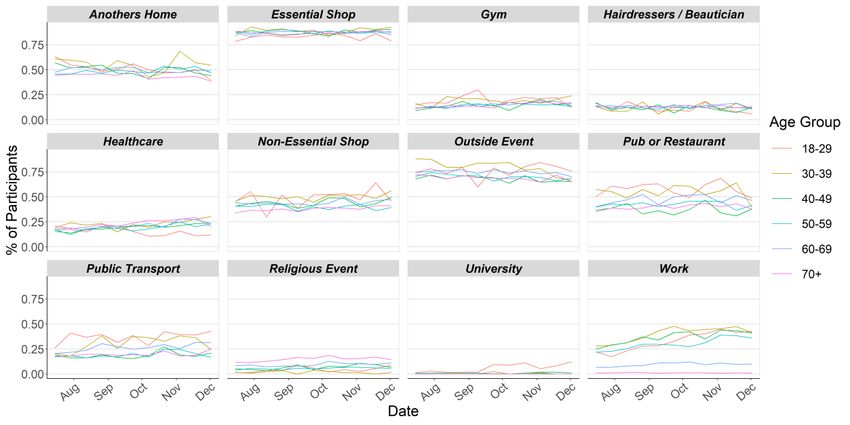
• Modelled rates of positive tests per 100K using data to
  13th December indicate that, for the week commencing
  26th December 2021, 29 of the 32 local authorities are expected to
  exceed 50 cases per 100K with at least 75% probability. The
  exceptions are Na h-Eileanan Siar, Orkney Islands and Shetland
  Islands. These 29 local authorities are also expected to exceed 100
  cases per 100K with at least 75% probability. Twelve local authorities
  are expected to exceed 300 cases per 100K with at least 75%
  probability. Only one local authority, East Ayrshire, is expected to
  exceed 500 cases per 100K with at least 75% probability. These
  models are based on a projection where the Delta variant makes up
  the majority of cases. Therefore it is likely that due to the Omicron
  variant, these are likely to be an underestimate.
• Modelling of long Covid estimates that on 2nd January 2022 between
  1.5% and 3.2% of the population are projected to self-classify with
  long Covid for 12 weeks or more after their first suspected Covid
  infection in Scotland. The upper limit of the estimate of the proportion
  of the population with long Covid is higher than last week.
• Nationwide, wastewater Covid-19 RNA levels have shown a decrease
  of around 21% from the elevated levels seen in the last two weeks.
  The week ending 14th December saw levels of around 58 million
  gene copies per person per day (Mgc/p/d), down from around 74
  Mgc/p/d in the previous week. It should be noted that this decrease is
  in the context of decreasing Delta variant and increasing Omicron
  variant.

Based on the Omicron variant

• Infections are rising and the number of infections are expected to
  continue to rise in the coming weeks as Omicron becomes more
  dominant. In three weeks’ time we estimate that daily infections may
  be between 15,000 and 130,000.
• Using data to 14th December, we can estimate a doubling time for
  Scotland of between 2.36 – 2.48 days using S-gene target failure as a
  proxy for Omicron cases.
• Given this doubling time, it is likely that only a small percentage of
  infections will be of the Delta variant by January 2022.

                                                                         2
Other modelling

• Average contacts from the most recent Panel B cohort of the Scottish
  Contact Survey (week ending 8th December) indicate an average of
  4.8 contacts.
• Mean contacts within the other setting (contacts outside home, school
  and work) have increased by 14% whereas work contacts have
  decreased by 12% in the last two weeks. Contacts within the home
  have remained at a similar level over the same period.
• Those aged 60 and over have increased their contacts within the last
  week with the majority of their contacts taking place within the other
  setting (contacts outside home, school and work). All remaining
  groups have reduced or have maintained a similar level of contacts
  over the same period.
• The highest interactions are reported between those 70 and over with
  each other. The biggest decrease in interactions is between the those
  under 18 with individuals within the 18-29 age group in the last two
  weeks.
• Visits to another’s home decreased from approximately 49% to 45%
  and attending an outside event decreased from 71% to 68% in the
  last two weeks.
• Approximately 63% of individuals have taken at least one lateral flow
  test within the last 7 days for the survey pertaining to the 2nd – 8th
  December.
• The youngest and oldest age groups (18-29 and 70+) have reported
  the lowest proportions of individuals who have taken one or more
  lateral flows, with at most 54% taken at least one. In contrast, those
  aged between 30-59 report the highest proportion of individuals
  taking at least one lateral flow test within the last 7 days, with at least
  70% taken at least one.

Recent cases

Figure 1 shows the number of Covid-19 cases reported in Scotland
between November and December 2021. The vertical dashed lines
indicate the cut off points for each of the modelling inputs; after these
dates, the number of cases is not incorporated into the outputs.

                                                                            3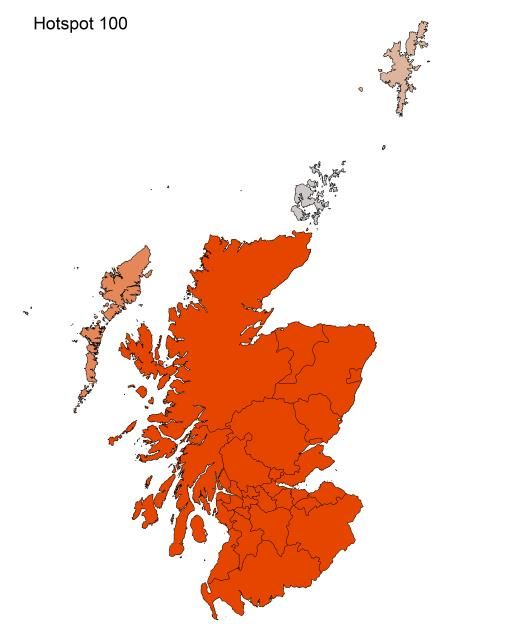
Figure 1: Cases reported in Scotland to 16th December 2021

R, growth rate and incidence are as of 30th November (dashed line 1).
The Scottish Contact Survey uses data to 8th December (dashed line 2).
The Scottish Government modelling of infections, hospitalisations and
ICU beds, the long Covid analysis, and the modelled rates of positive
tests per 100K use data to 13th December (dashed line 3). Wastewater
analysis used data to 14th December (dashed line 4).

Figure 2 shows the number of confirmed Omicron cases and those
cases that are under investigation. Note that data for 9th -12th
December is lagged due to specimen processing times and these will be
undercounted.

                                                                     4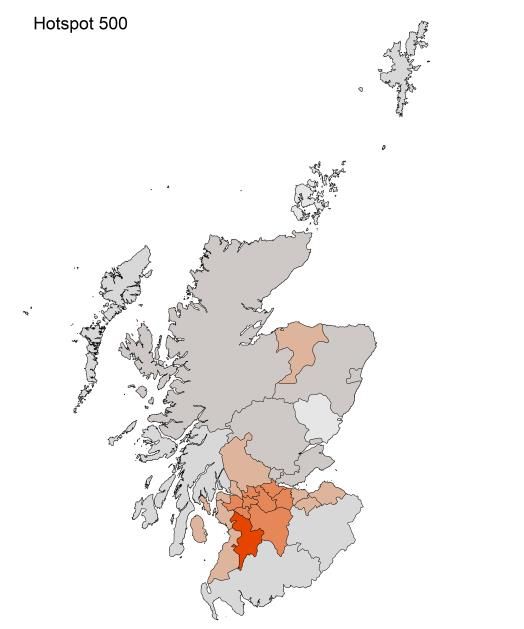
Figure 2: Confirmed Omicron variants and cases under investigation in
Scotland, data to 12th December by specimen date1

Source: Public Health Scotland COVID-19 & Winter Statistical Report

Overview of Scottish Government Modelling

Modelling outputs are provided here on the current epidemic in Scotland
as a whole, based on a range of methods. Because it takes a little over
three weeks on average for a person who catches Covid-19 to show
symptoms, become sick, and either die or recover, there is a time lag in
what our model can tell us about any change in the epidemic, e.g. any
impact of the Omicron variant. Therefore a new section has been
included covering what we know of this variant.

The first section of this report covers a range of modelling from a point
when the Delta variant made up the majority of cases:
  • The UK Health Security Agency (UKHSA) consensus is shown,
      which uses a range of data in its estimates of R and the growth
      rate.

1
 The modelling in this report uses S-gene test data to 13th December only for medium term
projections, and to 14th December for Omicron doubling times.

                                                                                            5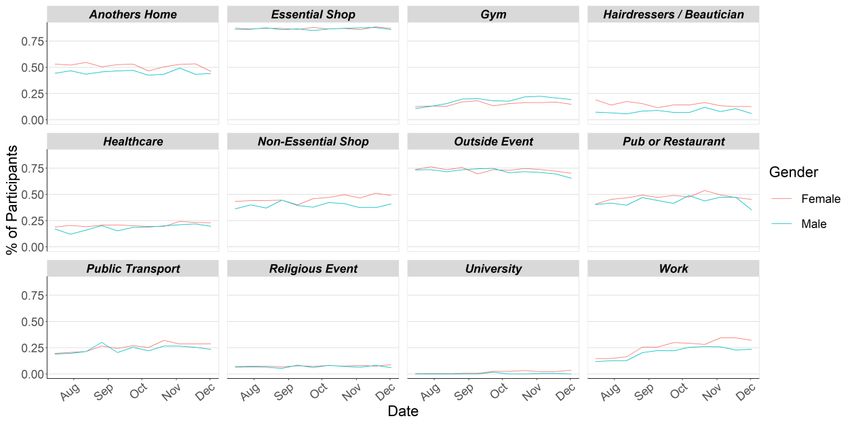
The second section of this report covers Omicron:
  • Looking at estimates of the doubling time of this variant, using the
     data available for Scotland.
  • It also projects this forward into the future to estimate the
     proportion of Omicron cases in the coming weeks.
  • The logistical model has been updated to incorporate both Delta
     and Omicron. The results are split down by age group, and the
     model is used to give a projection of the number of people that will
     be infected.

We also include in this report other modelling:
  • The Scottish Contact Survey (SCS) is used to inform a modelling
     technique based on the number of contacts between people. Over
     time, a greater proportion of the population will be vaccinated. This
     is likely to impact contact patterns and will become a greater part
     of the analysis going forwards.
  • We also report on levels of Covid-19 RNA in wastewater around
     Scotland and compare it to the 7-day average daily new cases.

What the modelling tells us about the epidemic at a point in time
when Delta made up the majority of cases

The R value and growth rates are estimated by several independent
modelling groups based in universities and the UKHSA. Estimates are
considered, discussed and combined at the Epidemiology Modelling
Review Group (EMRG), which sits within the UKHSA. These are based
on data to 13th December.

UKHSA’s consensus view across these methods, was that the value of
R as at 30th November2 in Scotland was between 0.9 and 1.1 (see
Figure 3)3.

R is an indicator that lags by two to three weeks and therefore should
not be expected to reflect recent fluctuations.

2
 Using data to 13th December 2021.
3
 Particular care should be taken when interpreting this estimate as it is based on low numbers of
cases, hospitalisations, or deaths and / or dominated by clustered outbreaks. It should not be treated
as robust enough to inform policy decisions alone.

                                                                                                     6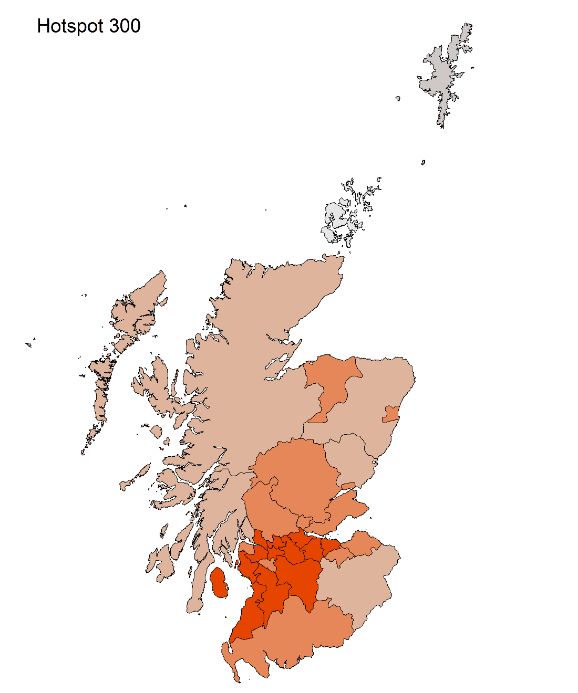
This week the Scottish Government presented two outputs to EMRG.
The first uses confirmed cases, as published by Public Health Scotland
(PHS), and deaths from National Records Scotland (NRS). The second
uses instead wastewater data to estimate the number of cases, and
deaths from NRS. Both outputs are shown in Figures 3 and 4.

Figure 3. Estimates of Rt for Scotland, as of 30th November, including
90% confidence intervals, produced by EMRG4.

Source: EMRG

The various groups which report to the EMRG use different sources of
data in their models to produce estimates of incidence (Figure 4).
UKHSA’s consensus view across these methods, as at 30th November,
was that the incidence of new daily infections in Scotland was between
96 and 128 new infections per 100,000. This equates to between 5,200
and 7,000 people becoming infected each day in Scotland.

4
  The cyan bars use Covid-19 test data and purple bars use multiple sources of data. The estimates
produced by the Scottish Government are the two on the left. (Yellow uses confirmed cases from PHS
and deaths from NRS; green uses wastewater data).The UKHSA consensus range is the right-most
(red). Data to 13th December. R, incidence and growth rate as of 30th November.

                                                                                                7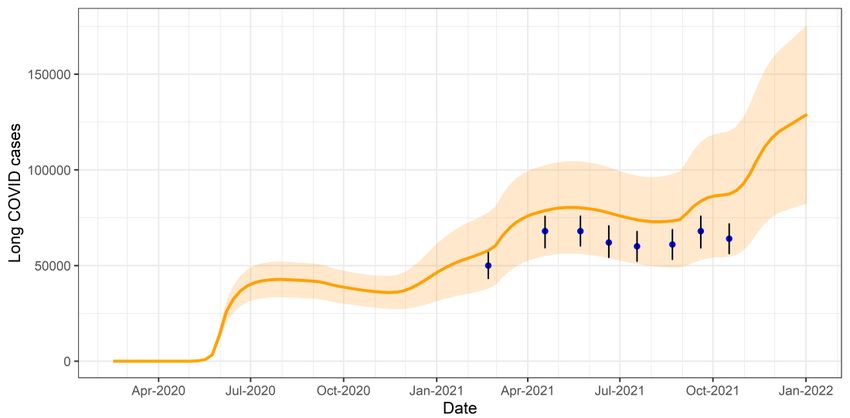
Figure 4. Estimates of incidence for Scotland, as at 30th November,
including 90% confidence intervals, produced by EMRG4.

Source: EMRG

The consensus from UKHSA for this week is that the growth rate in
Scotland is between -2% and 2% per day as at 30th November. The
lower and upper limits have increased since last week.

What we know about which local authorities are likely to experience
high levels of Covid-19 in two weeks’ time

We continue to use modelling based on Covid-19 cases and deaths
using data to 13th December from several academic groups to give us
an indication of whether a local authority is likely to experience high
levels of Covid-19 in the future. This has been compiled via UKHSA into
a consensus. In this an area is defined as a hotspot if the two week
prediction of cases (positive tests) per 100K population is predicted to
exceed a threshold, e.g. 500 cases.

There is uncertainty in regions with smaller populations, and hence
lower test counts, in particular in regions such as Na h-Eileanan Siar,
Orkney Islands and Shetland Islands. Models have varying degrees of
responsiveness to sudden changes in case trends, therefore there is an

                                                                          8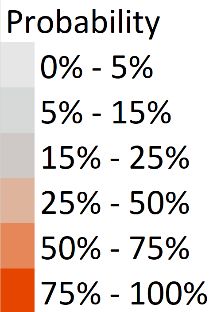
increased level of uncertainty in local authorities in which there have
been recent sharp increases in case numbers.

Modelled rates of positive tests per 100K using data to 13th December
(Figure 5) indicate that, for the week commencing 26th December 2021,
29 of the 32 local authorities are expected to exceed 50 cases per 100K
with at least 75% probability. The exceptions are Na h-Eileanan Siar,
Orkney Islands and Shetland Islands.

These 29 local authorities are also expected to exceed 100 cases per
100K with at least 75% probability.

Twelve local authorities are expected to exceed 300 cases per 100K
with at least 75% probability. These are Edinburgh, East Ayrshire, East
Dunbartonshire, Falkirk, Glasgow, North Ayrshire, North Lanarkshire,
Renfrewshire, South Ayrshire, South Lanarkshire, West Dunbartonshire
and West Lothian.

Only one local authority, East Ayrshire, is expected to exceed 500 cases
per 100K with at least 75% probability5.

These models are based on a projection where the Delta variant
makes up the majority of cases. Therefore it is likely that due to the
Omicron variant, these are likely to be an underestimate.

5
    Values are included in Table 1 in the Technical Annex.

                                                                          9
Figure 5. Probability of local authority areas exceeding thresholds of
cases per 100K (26th December 2021 to 1st January 2022), data to
13th December.
What the modelling tells us about projections of hospitalisations
and deaths in the medium term
Due to uncertainty surrounding the Omicron variant and its increasing
prevalence across the UK, SPI-M-O has been unable to produce
consensus medium-term projections for hospital admissions and deaths
this week. The delay between infection, developing symptoms, the need
for hospital care and death means the epidemiological data cannot fully
reflect the recent rapid increase of the Omicron variant. SPI-M-O hopes
10to produce medium-term projections again in the near future when the
impact of Omicron is better reflected in the epidemiological data.
What estimates do we have of the number of people experiencing
long Covid symptoms?
The Scottish Government is modelling the number of people likely to
experience long Covid symptoms. This gives a projection of estimated
self-reported long Covid rates in the future, based on Scottish
Government medium term projection modelling, as set out in Figure 9.
This modelling estimates that at 2nd January 2022 between 82,000
(1.5% of the population) and 176,000 (3.2%) people are projected to
self-classify with long Covid for 12 weeks or more after their first
suspected Covid infection in Scotland. The upper limit of the estimate of
the proportion of the population with long Covid is higher than last week.
These are preliminary results, further data on rates of long Covid and
associated syndromes as research emerges are required.
Figure 6. Estimates of self-classified long Covid prevalence at 12 weeks
from 16th February 2020 to 2nd January 2022 (showing 90% confidence
interval). ONS estimates of self-reported long Covid with range also
shown.
See the Technical Annex in issue 73 for information about the
methodology.
11What we know about the Omicron variant
As of 12th December 2021, a total of 4,252 cases have been reported,
of which 186 (4.4%) were confirmed, 56 (1.3%) were highly probable
and 4,010 (94.3%) were possible. Total cases are more than ten-fold
higher than on 5th December, when there were 3896.
Based on data to 14th December, we can estimate a doubling time for
Scotland of between 2.36 – 2.48 days using S-gene target failure as a
proxy for Omicron cases. We will continue to monitor the doubling times
which may fluctuate or change over future days.
Figure 7: Estimated proportion of Omicron cases in Scotland based on
S-gene target failure, data to 14th December
This curve is projected to estimate the proportion of Omicron cases in
future weeks in Scotland.
6
Public Health Scotland COVID-19 & Winter Statistical Report
12Figure 8: Estimate of the proportion of Omicron cases in Scotland in the
coming weeks
See the Technical Annex for information about the methodology.
What the modelling tells us about estimated infections
The Scottish Government assesses the impact of Covid-19 on the NHS
in the next few weeks, in this research findings we focus on estimating
the number of infections. Figures 9-11 show three projections over the
three weeks to 2nd January, broken down by possible Omicron
infections, Delta infections, and combined infections. We hope to be able
to provide hospitalisation and ICU in future weeks which account for the
Omicron variant as well as Delta.
These projections include the effect of the new interventions announced
on 14th December. ‘Central’ assumes a continuation of the current trend
for Delta, and that Omicron is around three times more transmissible.
‘Worse’ assumes a higher transmissibility for both Delta and Omicron.
‘Better’ assumes a lower transmissibility for both variants. All projections
also assume a lower vaccine effectiveness 7 for Omicron than for Delta8.
7
See Figure 6
https://assets.publishing.service.gov.uk/government/uploads/system/uploads/attachment_data/file/10
41593/Vaccine-surveillance-report-week-50.pdf
8
All projections are based on current vaccine roll-out plans and efficacy assumptions. Data to 13th
December.
13Delta infections are likely to fall over time, but those still being infected
and already infected will still contribute to the numbers of people in
hospital and ICU. Meanwhile the increase which we see in Omicron
infections will continue. At the present time, due to the lag between
infections and hospitalisations, only infections figures are provided in
Figures 9-11. We hope to be able to provide hospital occupancy and
ICU in future weeks.
Figure 9. Medium term projections of modelled total new combined daily
infections in Scotland, adjusting positive tests9 to account for
asymptomatic and undetected infections, from Scottish Government
modelling, based on positive test data reported up to 13th December
9
The actual positive tests are adjusted to coincide with the estimated day of infection.
14Figure 10. Medium term projections of modelled total new Delta daily
infections in Scotland, adjusting positive tests to account for
asymptomatic and undetected infections, from Scottish Government
modelling, based on S-gene positive data reported up to 13th December
Figure 11. Medium term projections of modelled total new Omicron daily
infections in Scotland, adjusting positive tests to account for
asymptomatic and undetected infections, from Scottish Government
modelling, based on S-gene negative data reported up to 13th
December
15The methodology for estimating projections is included in the Technical
Annex.
Other modelling
This section covers some modelling outputs for which the methodology
is not affected by which variant is dominant.
What we know about how people’s contact patterns have changed
Average contacts from the most recent Panel B cohort of the Scottish
Contact Survey (week ending 8th December) indicate an average of
4.8 contacts. This has decreased by 8% compared to the previous
Panel B of the survey (week ending 24th November), as seen in
Figure 12.
Mean contacts within the other setting (contacts outside home, school
and work) have increased by 14% whereas work contacts have
decreased by 12% in the last two weeks. Contacts within the home have
remained at a similar level over the same period.
Figure 12: Mean Adult Contacts (truncated at 100) from SCS.
16Figure 13 shows how contacts change across age group and setting.
Those aged 60 and over have increased their contacts within the last
week with the majority of their contacts taking place within the other
setting (contacts outside home, school and work). All remaining groups
have reduced or have maintained a similar level of contacts over the
same period.
Figure 13: Average (mean) contacts for each panel per day by setting for
adults in Scotland, truncated to 100 contacts per participant (from SCS).
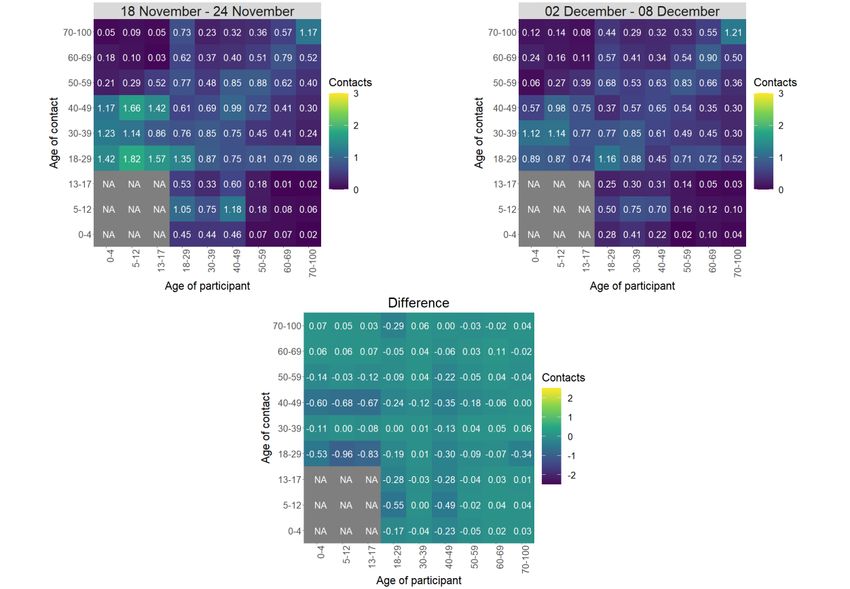
The heatmaps in Figure 14 show the mean overall contacts between
age groups for the weeks relating to 18th November - 24th November
and 2nd December - 8th December and the difference between these
periods. The highest interactions are reported between those 70 and
over with each other. In the last two weeks, the biggest decrease in
interactions is between those under 18 with individuals within the 18-29
age group.
17Figure 14: Overall mean contacts by age group before for the weeks
relating to 18th November - 24th November and 2nd December -
8th December.
As shown in Figure 15, the biggest changes in the proportion of
participants visiting different locations, though slight, is seen in those
visiting another’s home and attending an event outside. Visits to
another’s home decreased from approximately 49% to 45% and
attending an outside event decreased from 71% to 68% in the last two
weeks. A breakdown of this by age and gender is given in the Technical
Annex.
18Figure 15: Locations visited by participants at least once for panel A and
B (from SCS).
Approximately 63% of individuals have taken at least one lateral flow
test within the last 7 days for the survey pertaining to the 2nd – 8th
December as shown in Figure 16. The youngest and oldest age groups
(18-29 and 70+) have reported the lowest proportions of individuals who
have taken one or more lateral flows, with at most 54% taken at least
one. In contrast, those aged between 30-59 report the highest proportion
of individuals taking at least one lateral flow test within the last 7 days,
with at least 70% taken at least one.
19Figure 16: Number of days participants taken a lateral flow in last 7 days
Figure 17: Number of days participants taken a lateral flow in last 7 days
by age group
20What can analysis of wastewater samples tell us about local
outbreaks of Covid-19 infection?
Levels of Covid-19 RNA in wastewater (WW) collected at a number of
sites around Scotland are adjusted for population and local changes in
intake flow rate (or ammonia levels where flow is not available) and
compared to 7-day average daily new case rates derived from Local
Authority and Neighbourhood (Intermediate Zone) level aggregate data.
See Technical Annex in Issue 34 of these Research Findings for the
methodology.
Nationwide, wastewater Covid-19 levels have shown a decrease from
the elevated levels seen in the last two weeks. The week ending on 14th
December saw levels of around 58 million gene copies per person per
day (Mgc/p/d), down from around 74 Mgc/p/d in the previous week
(week ending 7th December), a decrease of 21%. It should be noted that
this decrease is in the context of decreasing Delta variant and increasing
Omicron variant. The Office of National Statistics’ Coronavirus Infection
Survey (CIS) has shown a similar recent drop, although data are only
available up until 1st December. Case rates have continued their
increase from last week.
Figure 18 shows the national running average trend (over a 7-day
period) for the full set of sampled sites, with a small number of
unrealistically large outliers excluded. WW Covid-19 levels have
dropped slightly while an increase in case rates can be observed across
almost all sites. This national trend is not representative for all sites
21though: Figure 19 shows Dalmuir (covered pop: 428k) in Glasgow,
where increases in both wastewater viral levels and case rates are seen.
Figure 18. National running average trends in wastewater Covid-19 and
daily new case rates (7-day moving average) up until 10th December10.
Figure 19. Wastewater Covid-19 and daily case rate (7 day moving
average) for Dalmuir (covered pop: 428k) in Glasgow11.
22What next?
Modelling will be provided for both the Delta and Omicron variants where
possible. As more information on Omicron becomes available this will be
incorporated in the different models as and when it is appropriate to do
so.
10
Anomalously high values, one in Seafield (Edinburgh) in mid-February (see Issue 40), one
in Dunblane in mid-June, and two in Daldowie in January, were removed. For this graph, a
wastewater RNA average using the last 7-days of data is computed at every sampling date.
Positivity estimates from the CIS are overlaid, with a scale chosen to approximately match
the displayed peak of the survey percentage to the recent peaks in the rate of new cases.
11
The black line and red shaded area provide a smoothed curve and confidence interval for
WW Covid-19 that is estimated from a generalised additive model based on a Tweedie
distribution.
23Technical Annex
Epidemiology is the study of how diseases spread within populations.
One way we do this is using our best understanding of the way the
infection is passed on and how it affects people who catch it to create
mathematical simulations. Because people who catch Covid-19 have a
relatively long period in which they can pass it on to others before they
begin to have symptoms, and the majority of people infected with the
virus will experience mild symptoms, this “epidemiological modelling”
provides insights into the epidemic that cannot easily be measured
through testing e.g. of those with symptoms, as it estimates the total
number of new daily infections and infectious people, including those
who are asymptomatic or have mild symptoms.
Modelling also allows us to make short-term forecasts of what may
happen with a degree of uncertainty. These can be used in health care
and other planning. The modelling in this research findings is undertaken
using different types of data which going forward aims to both model the
progress of the epidemic in Scotland and provide early indications of
where any changes are taking place.
The delivery of the vaccination programme will offer protection against
severe disease and death. The modelling includes assumptions about
compliance with restrictions and vaccine take-up. Work is still ongoing to
understand how many vaccinated people might still spread the virus if
infected. As Covid-19 is a new disease there remain uncertainties
associated with vaccine effectiveness. Furthermore, there is a risk that
new variants emerge for which immunisation is less effective.
How the modelling compares to the real data as it emerges
The method of producing the medium term projections (Figures 9 - 11)
uses the published actual numbers of infections, rather than modelling
them from the beginning of the epidemic. This means the projections
begin from the point the published data ends.
There is no prediction interval around the actual infections in Figure 5 - 7
because there is no longer any uncertainty from simulating infections
during this period. There is still uncertainty in the ascertainment rate,
which is represented by the whiskers around the actual infections.
24How do the locations visited by individuals vary between age and
gender?
Figures 20 & 21 illustrate the proportion of individuals attending different
locations by gender and age for Panel B.
Differences between the number of females and males visiting different
locations are small where they occur. These show a higher proportion of
females visiting another’s home, a hairdresser/beautician, non-essential
shop and work than males and a slightly higher proportion of males
visiting the gym compared to females. The remaining locations are
similar in proportions.
Figure 20: Locations visited by participants at least once for panel B by
gender (from SCS).
In terms of age, the biggest difference is seen in attendance to a work
setting. At most, 12% of participants 60 and over attend the workplace
while a minimum of 17%, rising up to 48%, of the 18-59s attend the
workplace during the same period.
25Figure 21: Locations visited by participants at least once for panel B by
age (from SCS).
How is the doubling time for the Omicron variant calculated?
In a recent WHO report12 it was confirmed that in PCR tests one of the
three target genes of the SARS-CoV-2 virus is not detected (called
S-gene target failure, SGTF). This test can therefore be used as an
indicator for the Omicron variant.
The number of total S-gene tests and the proportion which test positive
for SGTF in Scotland are provided daily by PHS. Based on a
methodology developed by academics at the University of Manchester, a
statistical model is based on some underlying parameters of the
Omicron variant. This is fitted against the actual number of S-gene test
and the proportion of these which are positive for SGTF using maximum
likelihood. This allows for a best estimate of the underlying parameters,
including the relative growth advantage of the Omicron variant, which
leads to an estimate of the doubling time of the variant.
The axis on the graph in Figure 8 is a proportion i.e. 0 = 0%, 1 = 100%.
Therefore, the graph is showing an estimated proportion of Omicron
cases, starting at 0% of cases in early November. The proportion is
calculated as S-gene target failure cases as a proportion of all cases
tested for the S-gene.
12
Classification of Omicron (B.1.1.529): SARS-CoV-2 Variant of Concern (who.int)
26To reflect the uncertainty the modelling has a random sampling element
to the methodology. The red band represents the variance between
these samples.
We have more information on Omicron but need more to confirm its
characteristics, particularly around severity. As this becomes available
we will refine the modelling.
27Which local authorities are likely to experience high levels of
Covid-19 in two weeks’ time
Table 1. Probability of local authority areas exceeding thresholds of
cases per 100K (26th December 2021 to 1st January 2022).
Data to 13th December.
This is based on the Delta variant being the majority of cases.
Probability of exceeding (cases per 100K)
Local Authority (LA) 50 100 300 500
Aberdeen City 75-100% 75-100% 50-75% 15-25%
Aberdeenshire 75-100% 75-100% 25-50% 15-25%
Angus 75-100% 75-100% 25-50% 0-5%
Argyll and Bute 75-100% 75-100% 25-50% 5-15%
City of Edinburgh 75-100% 75-100% 75-100% 25-50%
Clackmannanshire 75-100% 75-100% 50-75% 15-25%
Dumfries & Galloway 75-100% 75-100% 50-75% 5-15%
Dundee City 75-100% 75-100% 50-75% 15-25%
East Ayrshire 75-100% 75-100% 75-100% 75-100%
East Dunbartonshire 75-100% 75-100% 75-100% 50-75%
East Lothian 75-100% 75-100% 50-75% 25-50%
East Renfrewshire 75-100% 75-100% 50-75% 50-75%
Falkirk 75-100% 75-100% 75-100% 50-75%
Fife 75-100% 75-100% 50-75% 15-25%
Glasgow City 75-100% 75-100% 75-100% 50-75%
Highland 75-100% 75-100% 25-50% 15-25%
Inverclyde 75-100% 75-100% 50-75% 25-50%
Midlothian 75-100% 75-100% 50-75% 25-50%
Moray 75-100% 75-100% 50-75% 25-50%
Na h-Eileanan Siar 50-75% 50-75% 25-50% 5-15%
North Ayrshire 75-100% 75-100% 75-100% 25-50%
North Lanarkshire 75-100% 75-100% 75-100% 50-75%
Orkney Islands 50-75% 15-25% 0-5% 0-5%
Perth and Kinross 75-100% 75-100% 50-75% 15-25%
Renfrewshire 75-100% 75-100% 75-100% 50-75%
Scottish Borders 75-100% 75-100% 25-50% 5-15%
Shetland Islands 25-50% 25-50% 15-25% 5-15%
South Ayrshire 75-100% 75-100% 75-100% 25-50%
South Lanarkshire 75-100% 75-100% 75-100% 50-75%
Stirling 75-100% 75-100% 50-75% 25-50%
West Dunbartonshire 75-100% 75-100% 75-100% 25-50%
West Lothian 75-100% 75-100% 75-100% 50-75%
28What levels of Covid-19 are indicated by wastewater data?
Table 2 provides population weighted daily averages for normalised WW
Covid-19 levels in the weeks beginning 1st and 8th December 2021,
with no estimate for error. This is given in Million gene copies per
person, which approximately corresponds to new cases per 100,000 per
day. Coverage is given as percentage of LA inhabitants covered by a
wastewater Covid-19 sampling site delivering data during this period13.
Table 2. Average daily cases per 100k as given by WW data14.
w/b 1st w/b 8th
Local authority (LA) Coverage
December December
Aberdeen City 49 37 99%
Aberdeenshire 37 32 34%
Angus 64 39 55%
Argyll and Bute 44 18 12%
City of Edinburgh 56 54 98%
Clackmannanshire 49 74 81%
Dumfries & Galloway 16 41 35%
Dundee City 78 39 100%
East Ayrshire 91 42 57%
East Dunbartonshire 102 117 99%
East Lothian 63 50 74%
East Renfrewshire 42 62 89%
Falkirk 120 84 79%
Fife 114 52 84%
Glasgow City 72 89 71%
Highland 68 13 36%
Inverclyde 62 51 98%
Midlothian 55 55 73%
Moray 52 27 28%
Na h-Eileanan Siar – – 0%
North Ayrshire 81 37 84%
North Lanarkshire 105 92 30%
Orkney Islands 18 8 34%
Perth and Kinross 77 24 38%
Renfrewshire 59 69 97%
Scottish Borders 42 27 58%
Shetland Islands – – 0%
South Ayrshire 94 45 84%
South Lanarkshire 60 82 57%
Stirling 33 10 53%
West Dunbartonshire 80 62 98%
West Lothian 128 41 76%
13
Advancements in detection and interpretation practices allow us to identify when outlying results
are anomalous rather than indicators of spikes in Covid-19 levels. Table 2 provides population
weighted daily averages for normalised WW Covid-19 levels with the outliers removed. See Technical
Annex in Issue 60 of these Research Findings for further details.
14
Coverage as for week beginning 8th December 2021.
29This publication will be available in accessible HTML on the gov.scot website © Crown copyright 2021 You may re-use this information (excluding logos and images) free of charge in any format or medium, under the terms of the Open Government Licence. To view this licence, visit http://www.nationalarchives.gov.uk/doc/open- government-licence/ or e-mail: psi@nationalarchives.gsi.gov.uk. Where we have identified any third party copyright information you will need to obtain permission from the copyright holders concerned. The views expressed in this report are those of the researcher and do not necessarily represent those of the Scottish Government or Scottish Ministers. This document is also available from our website at www.gov.scot. ISBN: 978-1-80201-860-8 The Scottish Government St Andrew’s House Edinburgh EH1 3DG Produced for the Scottish Government by APS Group Scotland PPDAS998118 (12/21) Published by the Scottish Government, December 2021 ISBN 978-1-80201-860-8 Web Publication PPDAS998118 (12/21)
You can also read