Compliance Testing for Locomotive LED Headlights and Auxiliary Lights, Phase IV - DOT/FRA/ORD-21/16
←
→
Page content transcription
If your browser does not render page correctly, please read the page content below
Compliance Testing for Locomotive LED Headlights
           and Auxiliary Lights, Phase IV

DOT/FRA/ORD-21/16                       Final Report | April 2021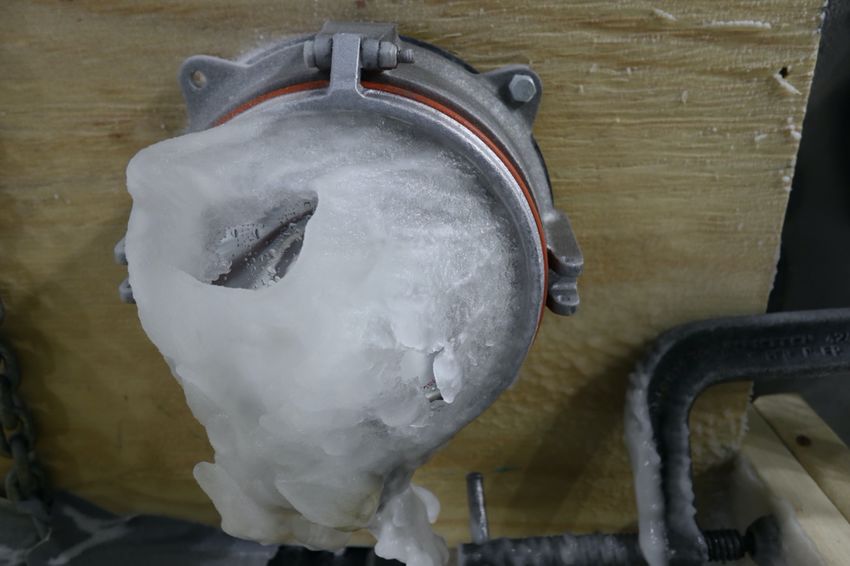
i
REPORT DOCUMENTATION PAGE                                                                                 Form Approved
                                                                                                                       OMB No. 0704-0188
Public reporting burden for this collection of information is estimated to average 1 hour per response, including the time for reviewing instructions, searching
existing data sources, gathering and maintaining the data needed, and completing and reviewing the collection of information. Send comments regarding this
burden estimate or any other aspect of this collection of information, including suggestions for reducing this burden, to Washington Headquarters Services,
Directorate for Information Operations and Reports, 1215 Jefferson Davis Highway, Suite 1204, Arlington, VA 22202-4302, and to the Office of Management and
Budget, Paperwork Reduction Project (0704-0188), Washington, DC 20503.

1. AGENCY USE ONLY (Leave blank)                      2. REPORT DATE                                         3. REPORT TYPE AND DATES
                                                                                                             COVERED
                                                                        April 2021
                                                                                                                  Technical Report, July 2020
4. TITLE AND SUBTITLE                                                                                                  5. FUNDING NUMBERS

Compliance Testing for Locomotive LED Headlights and Auxiliary Lights,
Phase IV                                                                                                               DTFRXX-XX-F-00XXX
6. AUTHOR(S)
Manuel Meza-Arroyo, Ph.D., AHFP,                           Peggy A. Shibata, P.E.,
James K. Sprague Ph.D., P.E.,                              Sean Woods
7. PERFORMING ORGANIZATION NAME(S) AND ADDRESS(ES)                                                                     8. PERFORMING
ENSCO, Inc.                                Engineering Systems, Inc.                                                   ORGANIZATION REPORT
5400 Port Royal Road                       1174 Oak Valley Dr.                                                         NUMBER
Springfield, VA 22151                      Ann Arbor, MI 48108                                                         ENSCO SERV-REPT-0002613

9. SPONSORING/MONITORING AGENCY NAME(S) AND ADDRESS(ES)                                                                10.
U.S. Department of Transportation                                                                                      SPONSORING/MONITORING
Federal Railroad Administration                                                                                         AGENCY REPORT NUMBER
Office of Railroad Policy and Development
Office of Research, Development, and Technology                                                                                DOT/FRA/ORD-21/16
Washington, DC 20590
11. SUPPLEMENTARY NOTES800
COR: Tarek Omar, Ph.D.
12a. DISTRIBUTION/AVAILABILITY STATEMENT                                                                               12b. DISTRIBUTION CODE
This document is available to the public through the FRA website.

13. ABSTRACT (Maximum 200 words)
This report describes the work performed during Phase IV compliance testing of light-emitting diode (LED) fixtures used as
locomotive headlights and auxiliary lights. The purpose was to study the performance of the lamps under severe cold weather
conditions. Researchers sought to determine whether LED lamps could melt a 1/4-inch-thick layer of ice from a lens surface and
whether the lamps would accumulate a coating of snow and ice when operated in the presence of very cold, windblown snow.
Throughout the testing, halogen lamps, currently standard equipment on freight locomotives, were used as a performance
benchmark.
14. SUBJECT TERMS                                                                                  15. NUMBER OF PAGES
Locomotive headlights, auxiliary lights, LED, halogen, Phase IV compliance                                                                 94
testing, cold weather performance, environmental testing, Code of Federal                                                  16. PRICE CODE
Regulations §229.125

17. SECURITY                             18. SECURITY                              19. SECURITY                            20. LIMITATION OF
                                                                                                                           ABSTRACT
CLASSIFICATION                           CLASSIFICATION                            CLASSIFICATION
 OF REPORT                                OF THIS PAGE                              OF ABSTRACT
           Unclassified                           Unclassified                             Unclassified

                                                                               i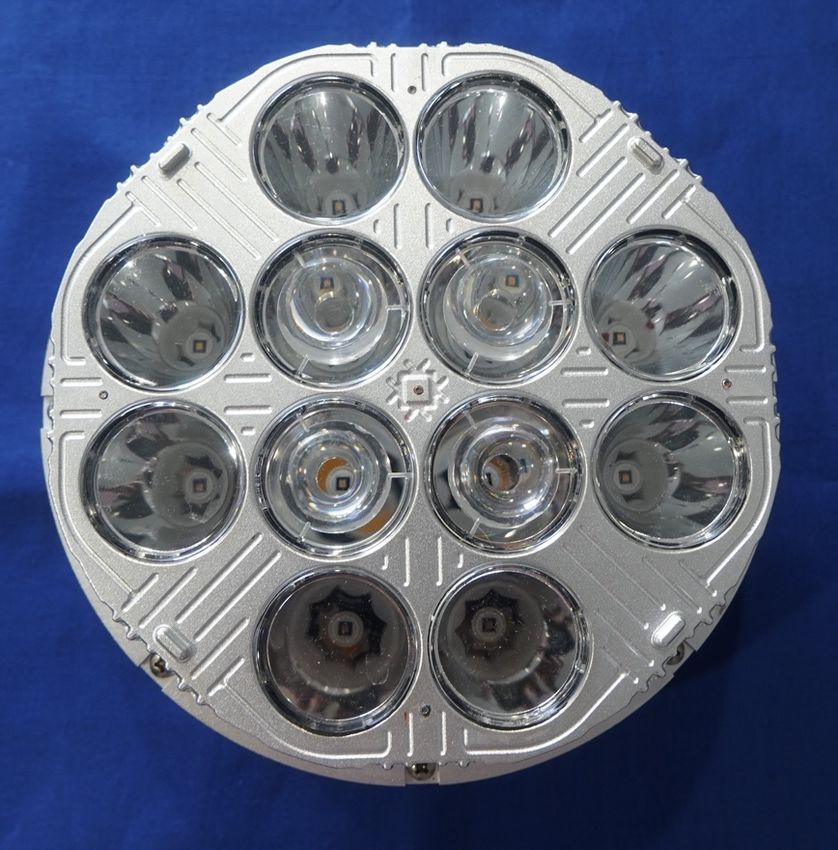
METRIC/ENGLISH CONVERSION FACTORS

              ENGLISH TO METRIC                                                                         METRIC TO ENGLISH
                  LENGTH (APPROXIMATE)                                                                       LENGTH (APPROXIMATE)
                    1 inch (in)        =    2.5 centimeters (cm)                                  1 millimeter (mm) = 0.04 inch (in)
                     1 foot (ft)       =    30 centimeters (cm)                                   1 centimeter (cm) = 0.4 inch (in)
                   1 yard (yd)         =    0.9 meter (m)                                                   1 meter (m) = 3.3 feet (ft)
                    1 mile (mi)        =    1.6 kilometers (km)                                             1 meter (m) = 1.1 yards (yd)
                                                                                                      1 kilometer (km) = 0.6 mile (mi)

                    AREA (APPROXIMATE)                                                                           AREA (APPROXIMATE)
    1 square inch (sq in, in2)         =    6.5 square centimeters (cm2)                1 square centimeter (cm2) = 0.16 square inch (sq in, in2)
      1 square foot (sq ft, ft2)       =    0.09 square meter (m2)                              1 square meter (m2) = 1.2 square yards (sq yd, yd2)
   1 square yard (sq yd, yd ) 2
                                       =    0.8 square meter (m )      2
                                                                                            1 square kilometer (km2) = 0.4 square mile (sq mi, mi2)
   1 square mile (sq mi, mi ) 2
                                       =    2.6 square kilometers (km )        2
                                                                                        10,000 square meters (m2) = 1 hectare (ha) = 2.5 acres
     1 acre = 0.4 hectare (he)         =    4,000 square meters (m2)

           MASS - WEIGHT (APPROXIMATE)                                                                MASS - WEIGHT (APPROXIMATE)
                  1 ounce (oz)         =    28 grams (gm)                                                   1 gram (gm) = 0.036 ounce (oz)
                  1 pound (lb)         =    0.45 kilogram (kg)                                         1 kilogram (kg) = 2.2 pounds (lb)
1 short ton = 2,000 pounds (lb)        =    0.9 tonne (t)                                                    1 tonne (t) = 1,000 kilograms (kg)
                                                                                                                         = 1.1 short tons

                  VOLUME (APPROXIMATE)                                                                      VOLUME (APPROXIMATE)
             1 teaspoon (tsp)          =    5 milliliters (ml)                                          1 milliliter (ml) = 0.03 fluid ounce (fl oz)
          1 tablespoon (tbsp)          =    15 milliliters (ml)                                                  1 liter (l) = 2.1 pints (pt)
          1 fluid ounce (fl oz)        =    30 milliliters (ml)                                                  1 liter (l) = 1.06 quarts (qt)
                      1 cup (c)        =    0.24 liter (l)                                                       1 liter (l) = 0.26 gallon (gal)
                     1 pint (pt)       =    0.47 liter (l)
                   1 quart (qt)        =    0.96 liter (l)
                 1 gallon (gal)        =    3.8 liters (l)
       1 cubic foot (cu ft, ft3)       =    0.03 cubic meter (m3)                                 1 cubic meter (m3) = 36 cubic feet (cu ft, ft3)
    1 cubic yard (cu yd, yd3)          =    0.76 cubic meter (m3)                                 1 cubic meter (m3) = 1.3 cubic yards (cu yd, yd3)

                TEMPERATURE (EXACT)                                                                         TEMPERATURE (EXACT)
                     [(x-32)(5/9)] °F = y °C                                                           [(9/5) y + 32] °C = x °F

                       QUICK INCH - CENTIMETER LENGTH CONVERSION
                        0                         1                        2                            3                         4                     5
           Inches
      Centimeters 0                1          2         3         4        5            6         7          8          9         10         11    12       13

         QUICK FAHRENHEIT - CELSIUS TEMPERATURE CONVERSION
        °F -40° -22°        -4°            14°        32°        50°       68°          86°        104°          122°       140° 158° 176° 194° 212°

        °C -40° -30°        -20°           -10°       0°     10°           20°          30°           40°        50°        60°        70°   80°   90° 100°

      For more exact and or other conversion factors, see NIST Miscellaneous Publication 286, Units of Weights and
      Measures. Price $2.50 SD Catalog No. C13 10286                                                              Updated 6/17/98

                                                                                   ii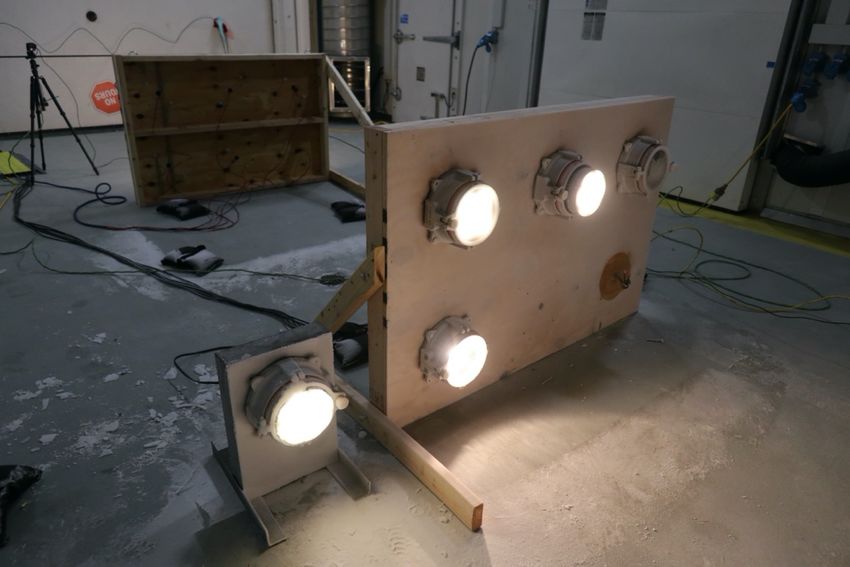
Acknowledgements

The authors acknowledge the support and contributions made by the Association of American
Railroads Locomotive Committee LED Headlight-Auxiliary Light Standard Technical Advisory
Group. The guidance and railway expertise offered by this group of industry professionals was
instrumental in the development of a test methodology that accurately simulated severe winter
conditions in which light-emitting diode lamps used in a railroad environment must operate.

                                              iii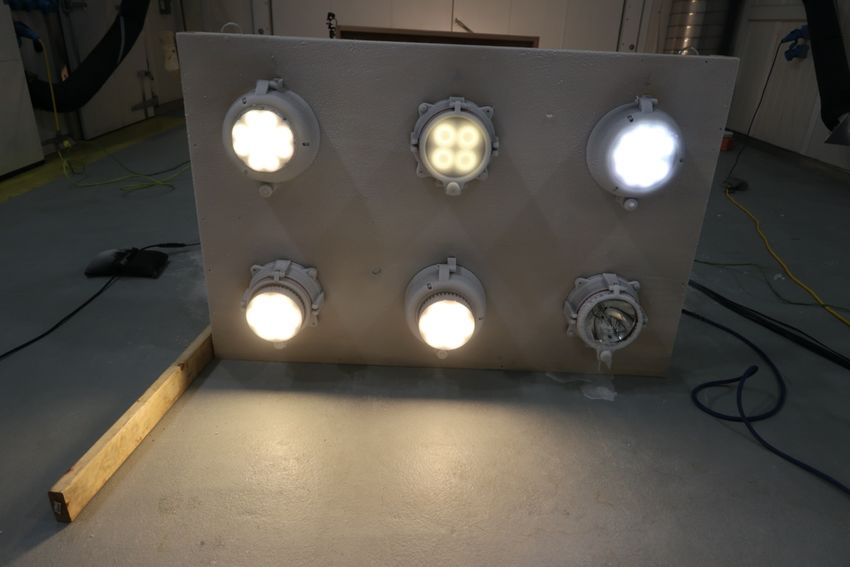
Contents

Executive Summary ........................................................................................................................ 1
1.               Introduction ................................................................................................................. 3
     1.1         Background ................................................................................................................. 3
     1.2         Objectives .................................................................................................................... 4
     1.3         Overall Approach ........................................................................................................ 4
     1.4         Scope ........................................................................................................................... 4
     1.5         Organization of the Report .......................................................................................... 4
2.               Testing Plan and Requirements ................................................................................... 5
     2.1         TAG Testing Requirements......................................................................................... 5
3.               Methodology................................................................................................................ 7
     3.1         Lamp Samples ............................................................................................................. 7
     3.2         Preliminary Testing and Setup .................................................................................... 7
     3.3         Testing Facilities ......................................................................................................... 9
     3.4         Ice Melt Test .............................................................................................................. 10
     3.5         Snow Accumulation Test .......................................................................................... 11
4.               Results and Discussion .............................................................................................. 13
     4.1         Ice Melt Test Results ................................................................................................. 13
     4.2         Snow Accumulation Test Results.............................................................................. 19
     4.3         Discussion of Ice Melt and Snow Accumulation Tests ............................................. 28
5.               Conclusion ................................................................................................................. 29
6.               References ................................................................................................................. 30
Appendix A. Lamp Samples ......................................................................................................... 31
Appendix B. Ice Melt Test – Selected Photographs ..................................................................... 37
Appendix C. Snow Accumulation Test – Selected Photographs .................................................. 41
Appendix D. General Documentation – Selected Photographs .................................................... 52
Appendix E. Power Supply Datasheet .......................................................................................... 58
Appendix F. ACE Laboratory Technical Specifications Sheet .................................................... 64

                                                                       iv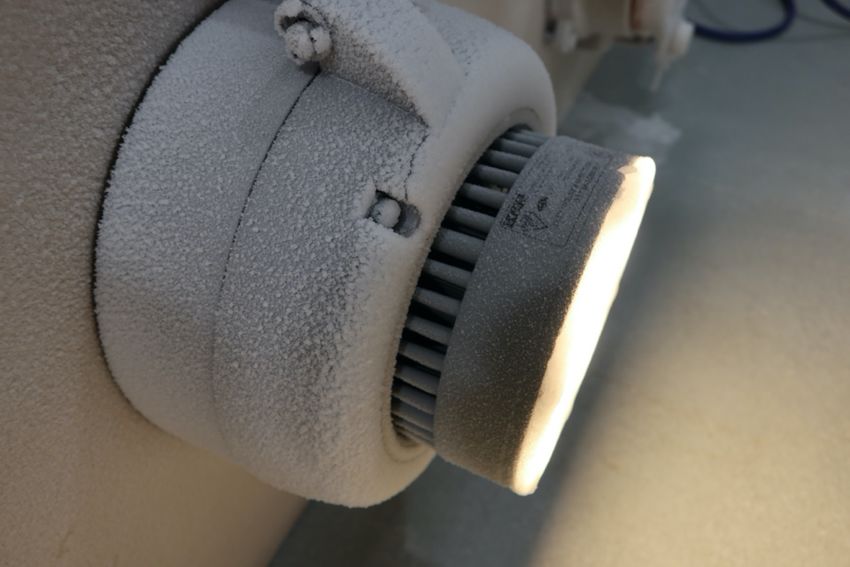
Illustrations

Figure 1. Test frames with light fixtures mounted.......................................................................... 7
Figure 2. Thermal image of preliminary temperature testing ......................................................... 8
Figure 3. Metal test frame with housing and halogen lamp mounted............................................. 9
Figure 4. Setup of light fixtures in the SCC for ice layering ........................................................ 10
Figure 5. Light fixtures with 1/4-inch accumulation of ice .......................................................... 10
Figure 6. Test frame installed in the CWT prior to Snow Accumulation Test ............................. 12
Figure 7. Setup of test frames in the SCC ..................................................................................... 13
Figure 8. Extent of ice melting at the conclusion of Trial 2 ......................................................... 15
Figure 9. Light fixtures after Trial 3 and 30 minutes of operation ............................................... 17
Figure 10. LED light fixtures after 30 minutes of operation at -20 °C ......................................... 18
Figure 11. Layer of ice falling from lens face after moderately hitting the lamp housings.......... 19
Figure 12. Test frames inside the CWT at wind speeds of 70 mph (113 km/h) ........................... 20
Figure 13. Photo taken during Trial 1 with detail view of halogen lamp ..................................... 21
Figure 14. Accumulation of snow and ice on light fixtures after Trial 1...................................... 22
Figure 15. Close-up view of the accumulation of snow and ice on light fixtures after Trial 1 .... 22
Figure 16. Setup of test frames and light fixtures for Trial 2 ....................................................... 23
Figure 17. Photograph taken during Trial 2 showing ice accumulation on the halogen lamp ..... 25
Figure 18. Accumulation of snow and ice on light fixtures after Trial 2...................................... 26
Figure 19. Accumulation of snow and ice on light fixtures after Trial 3...................................... 27
Figure 20. LED sample supplied by J.W. Speaker ....................................................................... 31
Figure 21. LED sample supplied by Hydra-Tech International .................................................... 32
Figure 22. LED sample supplied by Railhead/Divvali ................................................................. 33
Figure 23. LED sample supplied by Smart Light Source Co. ...................................................... 34
Figure 24. Halogen sample supplied by AMGLO ........................................................................ 35
Figure 25. Halogen sample supplied by ePowerRail .................................................................... 36
Figure 26. Test frame 1 with lamps powered on .......................................................................... 37
Figure 27. LED sample during testing .......................................................................................... 38
Figure 28. LED sample during testing .......................................................................................... 38
Figure 29. Test frame 2 and metal frame with lamps powered on ............................................... 39
Figure 30. LED sample during testing .......................................................................................... 39
Figure 31. LED sample during testing .......................................................................................... 40

                                                                v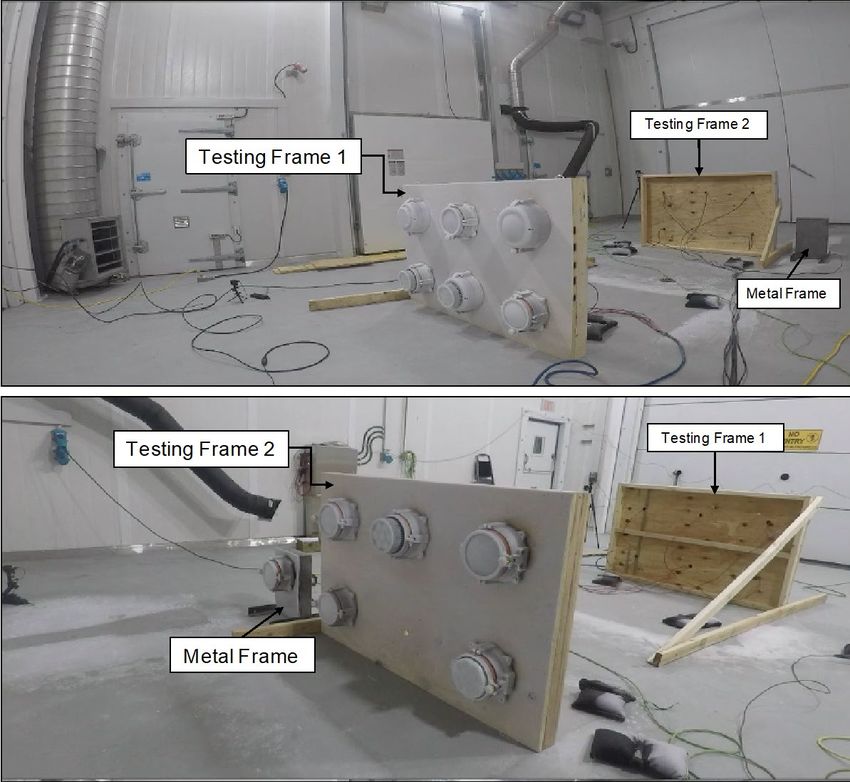
Figure 32. Separation of ice from lens of LED sample ................................................................ 40
Figure 33. Halogen sample after Trial 1 ....................................................................................... 41
Figure 34. LED sample after Trial 1 ............................................................................................. 42
Figure 35. LED sample after Trial 1 ............................................................................................. 42
Figure 36. LED sample after Trial 1 ............................................................................................. 43
Figure 37. LED sample after Trial 1 ............................................................................................. 43
Figure 38. LED sample after Trial 1 ............................................................................................. 44
Figure 39. Measurement of ice accumulation on LED sample after Trial 1................................. 45
Figure 40. Measurement of ice accumulation on halogen sample after Trial 1 ............................ 45
Figure 41. Light fixtures after Trial 2 ........................................................................................... 46
Figure 42. LED sample after Trial 2 ............................................................................................. 46
Figure 43. LED sample after Trial 2 ............................................................................................. 47
Figure 44. Halogen sample after Trial 2 ....................................................................................... 47
Figure 45. LED sample after Trial 2 ............................................................................................. 48
Figure 46. LED sample after Trial 2 (non-powered sample) ........................................................ 48
Figure 47. LED sample on metal testing frame after Trial 2 ........................................................ 49
Figure 48. Documentation of ice on LED sample after Trial 2 .................................................... 50
Figure 49. Documentation of ice on LED sample after Trial 2 .................................................... 50
Figure 50. Measurement of ice thickness on LED sample after Trial 3 ....................................... 51
Figure 51. Power supplies used during Snow Accumulation Test ............................................... 52
Figure 52. Early stages of the water spraying process .................................................................. 53
Figure 53. LED sample in the early stages of building the 1/4 inch layer of ice .......................... 53
Figure 54. Halogen sample in the early stages of building the 1/4 inch layer of ice .................... 54
Figure 55. Experimenter measuring the ice layer thickness using a depth gauge ........................ 54
Figure 56. Halogen sample in the late stages of building the 1/4 inch layer of ice ...................... 55
Figure 57. Test frames in the late stages of building the 1/4-inch layer of ice ............................. 55
Figure 58. View of the testing area in the CWT ........................................................................... 56
Figure 59. Documentation of snow inside housing ...................................................................... 56
Figure 60. Documentation of snow inside the housing of the metal test frame............................ 57

                                                                 vi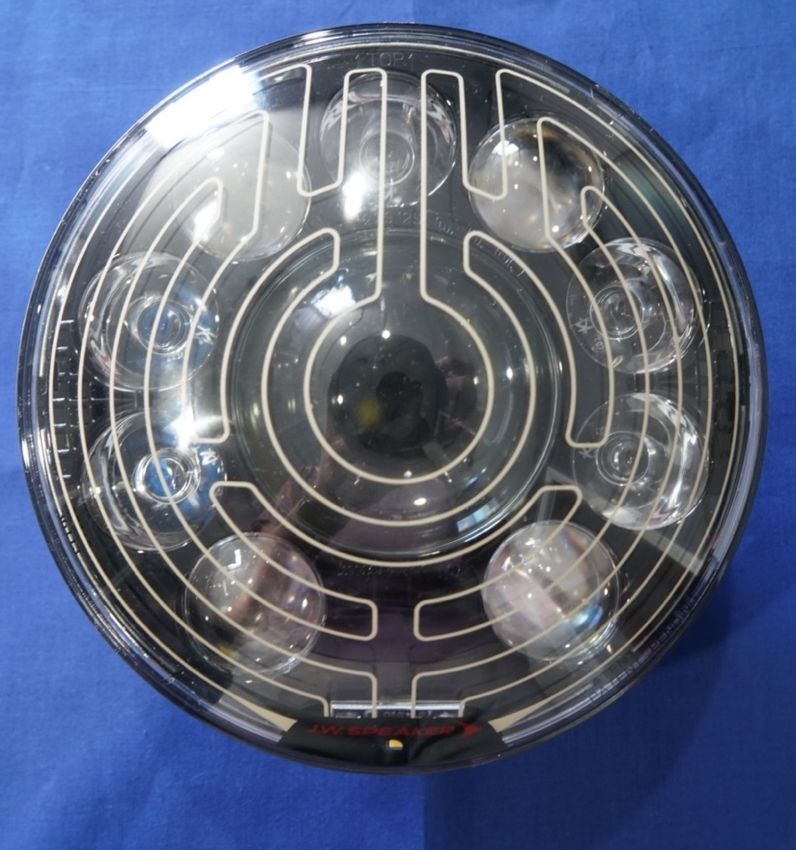
Tables

Table 1. Summary of Ice Melt Test trials ..................................................................................... 14
Table 2. Ice Melt Test, Trial 1 – temperature -40 °C.................................................................... 15
Table 3. Ice Melt Test, Trial 3 – temperature -40 °C.................................................................... 16
Table 4. Ice Melt Test, Trial 4 – temperature -20 °C.................................................................... 18
Table 5. Accumulation of Snow Test, Trial 1 – 70 mph wind...................................................... 21
Table 6. Snow Accumulation Test, Trial 2 – 70 mph wind .......................................................... 24
Table 7. Snow Accumulation Test, Trial 3 – 90 mph wind .......................................................... 27

                                                              vii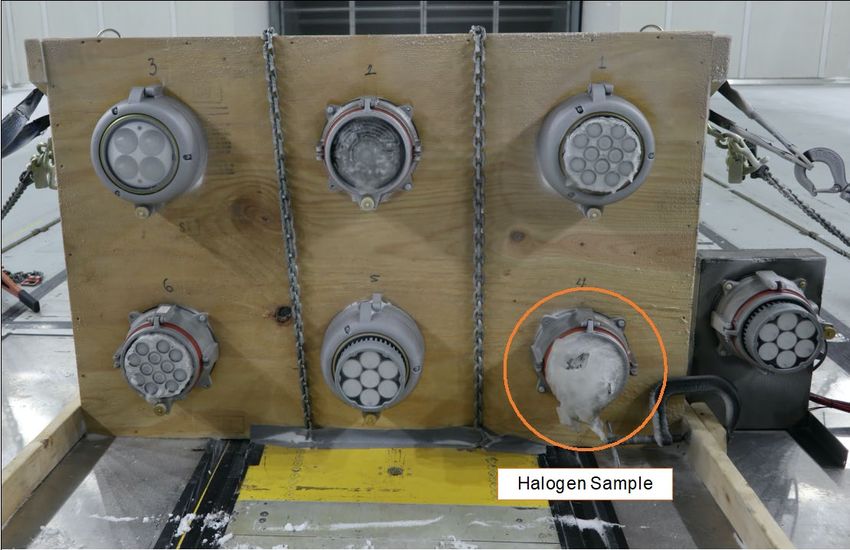
Executive Summary

This report describes the test program used to study the performance of light-emitting diode
(LED) fixtures used as locomotive headlights and auxiliary lights lamps under severe cold
weather conditions. Researchers sought to determine whether LED lamps could melt a 1/4-inch-
thick layer of ice from the lens surface and whether the lamps would accumulate a coating of
snow and ice when operated in the presence of very cold, windblown snow. Throughout the
testing, halogen lamps, currently standard equipment on freight locomotives, were used as a
performance benchmark.
Over the last several years, the railroad industry has begun to introduce LED lighting, a
relatively new technology, for locomotive headlights and auxiliary lights. In response to this
initiative the Association of American Railroads (AAR) Locomotive Committee Headlight-
Auxiliary Light Standard Technical Advisory Group has been leading efforts to evaluate the
performance and illumination characteristics of LED lamps, particularly in comparison to their
halogen counterparts that have historically been used on locomotives. To support the industry’s
initiative, the Federal Railroad Administration’s Office of Research, Development, and
Technology supported the development of a comprehensive four-phase research and test
program in cooperation with the AAR to evaluate the performance of LED lamps in a railroad
environment. In Phase I of this program, test procedures were established and tests were
conducted to determine that currently available LED lamps satisfied applicable regulatory
requirements and illumination characteristics under laboratory conditions. Subsequently,
subjective assessment of the visibility aspects of LED lamps was evaluated under static (Phase
II) and dynamic field (Phase III) test conditions, with halogen lamps used as a performance
benchmark. The purpose of Phase IV testing was the evaluation of the performance of LED lamp
samples under severe winter conditions using environmentally controlled laboratory facilities.
LED and halogen lamp samples from previous phases of this research were tested again during
this study. During the Ice Melt Tests, the research team tested the lamp samples by measuring
their ability to melt a 1/4-inch layer of accumulated ice on the lens while operating at a very low
temperature. The team assessed lamp samples during the Snow Accumulation Test to determine
their ability to prevent snow and ice from accumulating on the exposed surfaces while operating
in at low temperatures.
The Ice Melt Test revealed that all the halogen lamps tested could completely melt the 1/4-inch
layer of ice. The melting process started within 2 minutes of being powered on, and the ice layer
was completely eliminated in under 10 minutes. In contrast, none of the LED samples could
completely melt the layer of ice. Initial trials were conducted at -40 °C, and subsequently at -20
°C, to better understand the limits of the defrosting performance of the LED lamps. Some LED
samples did exhibit partial melting of the ice, either through partial separation of the ice from the
lens face, a flurry-like structure on the outer layer of ice, or the formation of icicles on the lamp
housing. Researchers observed after trials at -20 °C that the ice layer on some LED samples had
weakened, and striking the lamps with moderate force caused the layer of ice to fall from the
face of the lamps, suggesting that the typical vibration generated by the moving locomotive
could assist in defrosting the lamps during particular harsh winter conditions.
The results of the Snow Accumulation Test demonstrated that in the presence of cold, high-speed
winds, the halogen lamps consistently accumulated ice on the fixture within 10 minutes of

                                                  1
operation. Following each of three trials, an ice dome had formed on the housing of the halogen
lamps, protruding several inches in front of the fixture. In contrast, the LED lamp samples
accumulated very little ice, requiring close examination in order to detect and measure the
thickness of ice. The ice layers formed on the LED samples varied in thickness, from nearly
imperceptible up to approximately 1/4-inch.
This particular phase of the LED compliance testing efforts revealed several relevant
observations related to the lamps’ severe cold weather performance characteristics. The halogen
lamps were more successful at melting an existing layer of ice on the lens, compared to the LED
lamps. However, when tested in windy, snowy conditions, the LED lamps exhibited less
accumulated ice in comparison to the halogen lamps, which formed larges domes of ice
protruding several inches from the lens. These results provide a better understanding of how each
of these lamp types might perform under severe winter conditions, but also demonstrate that for
the questions studied here, there is not a unequivocal answer as to which is the better choice of
lamp for winter use.
21. Introduction
This report summarizes Phase IV of the compliance testing of LED fixtures for use as
locomotive headlights and auxiliary lights. This phase focused on evaluating the environmental
performance of light-emitting diode (LED) lamps compared to halogen lamps in very cold and
snowy conditions. This program was a collaborative effort between the Federal Railroad
Administration’s (FRA’s) Office of Research, Development and Technology and the Association
of American Railroads (AAR) Locomotive Committee’s LED Headlight-Auxiliary Light
Standard Technical Advisory Group (TAG).
Phase I of this undertaking addressed the photometric characteristics (e.g., luminous intensity
and color temperature) of LED and halogen lamps, comparing their performance in a laboratory
environment. Human-factors aspects related to visibility (e.g., track and wayside visibility,
discomfort glare, and recognition of lamp patterns) of LED lamps were tested in static
locomotive tests in Phase II and dynamic locomotive tests in Phase III.
1.1 Background
As part of Phase IV efforts to incorporate LED lamps into locomotive headlights, a research
team comprised of Engineering Systems, Inc. (ESi) and ENSCO Rail, Inc. (ENSCO) designed
two experiments intended to evaluate the performance of LED lamps during low-temperature
environmental conditions. One experiment, referred to as the “Ice Melt Test,” investigated the
ability of LED and halogen lamps to melt a 1/4-inch layer of ice covering the exposed lamp and
housing while operating under low-temperature conditions (-40 °C). A second experiment,
referred to as the “Snow Accumulation Test,” investigated whether LED and halogen lamps
would accumulate snow and ice while operating in low-temperatures and wind speeds of 70 mph
and 90 mph.
The experiments designed for this study incorporated testing guidance provided by the AAR
TAG to simulate the worst case environmental condition likely to be encountered on the railway.
The testing requirements proposed by the TAG committee were developed in accordance with
AAR Standards S-5516 * and S-9401.V1.0 †.
The following terms are used throughout this report:
1. Lamp: Assembly containing illuminating element(s) and a protective housing, using
either halogen or LED technology.
2. Housing: Metal enclosure on the locomotive that allows lamps to be installed.
3. Light fixture: Combination of lamp and housing
4. Test frame: A structure used to mount several light fixtures in a specific orientation.
*
LED Headlights and Auxiliary Lighting for Locomotives (2019); Section 3.7: Environmental.
†
Railroad Electronics Environmental Requirements (2009); Table 3.1: Environmental Requirements (Vehicle
Exterior Body Mounted).
31.2 Objectives
Based on the testing requirements established by AAR TAG, two primary objectives were
established for Phase IV testing:
1. To determine the ability of lamps to melt 1/4-inch of accumulated ice after 30 minutes of
operation at -40 °C.
2. To determine the ability of lamps to prevent ice and/or snow accumulation while being
operated in low temperature (-40 °C) and high wind (up to 90 mph) conditions.
1.3 Overall Approach
To achieve the objectives described above, suitable test facilities were identified within the
Automotive Centre for Excellence (ACE) laboratory at the University of Ontario Institute of
Technology (Ontario Tech). ‡ The ACE laboratory has state-of-the-art climatic chambers capable
of simulating a wide range of environmental conditions. The Ice Melt Test was performed at
ACE’s Small Climatic Chamber (SCC), which can maintain a temperature of -40 °C. The Snow
Accumulation Test was performed at ACE’s Climatic Wind Tunnel (CWT), which is also
capable maintaining a temperature of -40 °C while generating wind speeds in excess of 155 mph
(250 km/h). Additionally, the CWT has the capacity to inject moisture into the wind stream
resulting in blowing rain or snow, depending on the temperature.
1.4 Scope
The controlled environmental chambers at ACE allowed researchers to simultaneously conduct
multiple trials comparing LED and halogen lamp performance. The overall scope of the study
was to compare LED and halogen lamps’ ability to operate normally under various low-
temperature environmental conditions.
1.5 Organization of the Report
The testing plan and requirements established by the AAR TAG are detailed in Section 2.
Section 3 details the test methodology and specific protocols followed during both experiments.
Analysis and discussion of the testing results is presented in Section 4. Finally, conclusions
based on the entirety of the work are offered in Section 5.
‡
https://ace.ontariotechu.ca/
42. Testing Plan and Requirements
The two experiments designed for this study followed the AAR TAG’s testing requirements,
which were developed in accordance with AAR Standards S-5516 (AAR, 2019) and S-
9401.V1.0 (AAR, 2009). The requirements that guided the experimental design are specified
below. Further details of the test methodology are discussed in Section 3.
2.1 TAG Testing Requirements
Each lamp sample shall be tested in each of the two primary types of housings. The following
tests shall be performed in an environmental test chamber and shall be documented in real time
with a video recording of the test.
1. Ice Melt Test
a. The entire exposed, forward facing portion of the lamp shall be coated with 1/4-
inch of ice. (The exposed portion does not include the back of the lamp nor does it
include the side portion of the lamp that will be enclosed within the lamp
housing.)
i. The 1/4-inch layer of ice shall be formed on the exposed portion of the
lamp, in one of the following ways, prior to initiating the test:
1. The lamp may be submerged (and frozen) face-down in a container
of water at a depth that will cause 1/4 inch of ice to form on the
front and side portions of the lamp that would be exposed to the
elements when installed in a lamp housing. A suitable container
would be 1/2-inch larger than the diameter of the lamp.
2. Water spray may be allowed to accumulate until a measurable 1/4-
inch layer of ice is present on the front and sides of the lamp that
would be exposed to the elements when installed in a lamp
housing.
b. The lamp shall be mounted in a locomotive headlamp housing and placed in an
environmental test chamber (installed in the same orientation as it would be on
the front of a locomotive) with an ambient temperature of -40 °C.
c. Upon temperature stabilization of the light fixture at -40 °C, the lamp shall be
powered with 74 VDC to simulate normal operation on the “bright” setting.
d. Thirty minutes after power is applied to the lamp, the 74 VDC power supply shall
be turned off and the presence of any residual ice accumulation shall be
documented with photos, video, and measurement of any remaining ice. Special
consideration shall be given to any ice that remains on the forward facing lens
surfaces. A time-stamped video recording of the testing will show the exact
timing of any melt-off events.
2. Snow Accumulation Test
a. The lamp shall be mounted in a locomotive headlamp housing and placed in an
environmental test chamber (installed in the same orientation as it would be on
5the front of a locomotive) with an ambient temperature of approximately -7 °C.
All samples were left soaking overnight at an ambient temperature of -20 °C to
create the best conditions for facilitating icy build-up on the lamp sample.
b. Upon temperature stabilization of the lamp fixture at the desired temperature, a
headwind of 70 mph shall be aimed directly at the lamp lens. Subsequent trials
shall be conducted with a windspeed of 90 mph as well.
c. In combination with the headwind, a water spray shall be used to simulate a
slushy/sticky/icy precipitation. The air temperature was kept at approximately -7
°C to create the best conditions for facilitating icy build-up on the lamp sample.
d. Upon start-up of the simulated headwind and precipitation, the lamp shall be
powered with 74 VDC to simulate normal operation on the “bright” setting.
e. Over a period of 30 minutes, the lamp must monitored and any accumulation of
precipitation on the lamp lens shall be recorded.
After each test, the lamps shall be evaluated on the amount of time required to melt the layer of
ice, or the quantity of snow and ice that has accumulated on the lens of the lamp.
63. Methodology
This section presents the methods, testing apparatus, and analytical tools used in the Ice Melt
Test and Snow Accumulation Test.
3.1 Lamp Samples
A randomly selected group of the lamp samples submitted to the researchers for Phase III testing
were also used during Phase IV testing. The samples included four different LED lamp models
provided by J.W. Speaker, Hydra-Tech, Railhead/Divvali, and SMART Light Source. The test
samples also included two different halogen lamp models provided by AMGLO and ePowerRail.
Eight samples per lamp model were provided to the research team to support Phases III and IV
testing. Further details of the lamp models provided can be found in Appendix A.
3.2 Preliminary Testing and Setup
A major consideration during the experimental design was the establishment of a test fixture
capable of holding multiple lamp housings simultaneously. Following discussions with ACE
regarding wind loading and available anchor points within the environmental chambers,
researchers constructed a wooden test frame with diagonal braces. They then built a pair of test
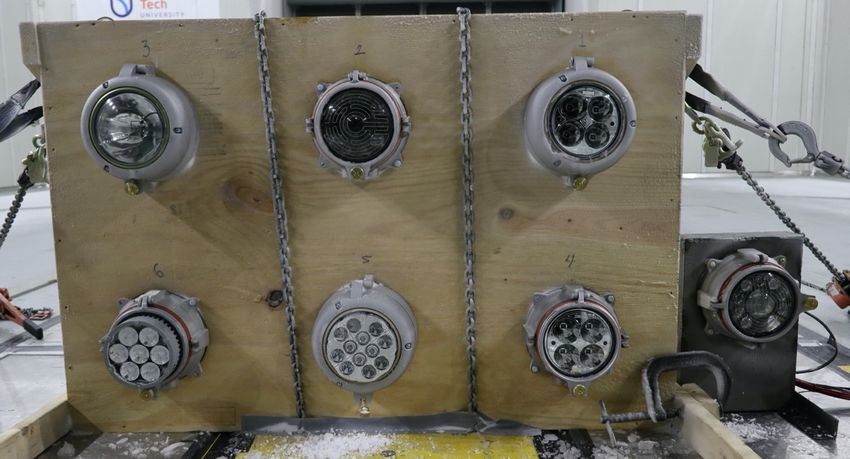
fixtures – each fixture capable of holding up to 6 locomotive housings and lamps (see Figure 1).
ACE approved the design specifications of the structures to withstand the high-wind, low-
temperature and high-humidity conditions required for testing.
Figure 1. Test frames with light fixtures mounted
3.2.1 Preliminary Temperature Testing
One concern related to the test frame design was related to potential thermal interference
between neighboring lamps, particularly for those lamps directly adjacent to a halogen lamp. To
investigate whether the temperature of any given light fixture would affect another one, a simple
test frame with five light fixtures was positioned outdoors at ambient temperatures between -17
7°C and -15 °C (1.4 °F and 5 °F). § All five lamps were powered on to simulate operation in
“bright” mode. After 30 minutes of operation, the temperature of the test frame and light fixtures
was measured. Due to the low thermal conductivity of wood, these measurements showed no
significant increase in temperature of the test frame in areas surrounding each light fixture.
Figure 2. Thermal image of preliminary temperature testing
A second concern related to the test frame design was the material selected. The low thermal
conductivity of wood prevented any of the lamps’ operating temperature from being influenced
by adjacent lamps. Conversely, there were concerns that the wooden test frame would insulate
the lamps, preventing the dissipation of heat into the typical metal body of a locomotive. To test
for this potential effect, researchers built a metal test frame to house a single light fixture (see
Figure 3). The preliminary temperature test described above was repeated with the addition of
the metal test frame. They positioned the wood and metal test frames outdoors at similar ambient
temperatures. They then evaluated the metal test frame with both halogen and LED lamps. The
temperature of the lamp housings on both test frames were measured and found to be very
similar. This result suggests that the wooden test frame did not insulate or otherwise influence
the temperature of the light fixture any differently than a metal frame. To verify this conclusion,
the metal frame with a single light fixture, alternately housing LED and halogen lamps, was
included in the Ice Melt Test and the Snow Accumulation Test.
§
These preliminary tests were performed during wintertime in Michigan.
8Figure 3. Metal test frame with housing and halogen lamp mounted
For all test iterations, the lamps were powered by a programmable DC power supply set to 75
VDC (BK Precision 9206; see Appendix E for datasheet).
3.3 Testing Facilities
Several facilities were considered for the environmental testing described above; however, only
the ACE laboratory satisfied all of the requirements established by the TAG committee. The
ACE laboratory is located on the main campus of Ontario Tech in Oshawa, Ontario (see
Appendix F for fact sheet and specifications) and houses a total of five testing chambers with
distinct capabilities. For the completion of the tests included in the present study, the Small
Climatic Chamber (SCC) and the Climatic Wind Tunnel (CWT) were used.
3.3.1 Small Climatic Chamber
The SCC is large enough to fit two sedan cars. It can maintain temperatures as low as -40 °C and
humidity levels ranging from 5 percent to 95 percent relative humidity (RH). Additionally, the
SCC can modify these environmental variables in a fairly short amount of time, minimizing the
time required between test iterations.
3.3.2 Climatic Wind Tunnel (CWT)
The CWT is a large testing chamber typically used to test objects from small cars to trucks and
buses. It can generate wind speeds in excess of 155 mph (250 km/h) while maintaining
temperatures as low as -40 °C and humidity levels from 5 percent to 95 percent RH. Anchors are
located at various points on the floor allowing for secure attachment of the test frames.
93.4 Ice Melt Test
Researchers conducted the Ice Melt Test in the SCC on January 6, 2020. They installed the lamp
samples onto the test frames inside the chamber for 4 to 5 hours prior to testing in order to reach
a stable temperature of -40 °C. Once the samples’ temperature had stabilized, they laid the test
frames horizontally on a level, flat floor. They repeatedly sprayed the lamp samples with a thin
coating of water until the desired 1/4-inch layer of ice formed on the exposed surfaces (see
Figure 4 and Figure 5).
Figure 4. Setup of light fixtures in the SCC for ice layering
Figure 5. Light fixtures with 1/4-inch accumulation of ice
10The frequent opening and closing of the SCC to allow for the researchers to spray water onto the
lamps resulted in a 2 to 3 degree increase in the ambient temperature. Prior to the start of each
trial, the SCC temperature was allowed to stabilize between -38 °C and -40 °C. For each trial, up
to nine lamps were powered simultaneously with 74 VDC. After 30 minutes of operation, the
presence of any residual ice was documented with photos, video, and measurements of area and
thickness. This test procedure was repeated for a total of five trials in order to test all the lamp
samples. Based on the temperatures measured during the preliminary stages, researchers
hypothesized that none of the LED samples would melt any ice after 30 minutes of operation.
Therefore, they gathered measurements for the second trial after a continuation of the first 30
minutes of operation, letting the samples operate for a full hour. The third trial was another
evaluation of the lamps after 30 minutes of operation at -40 °C, but with a different, randomized
placement of the lamp samples compared to the first trial. The fourth and fifth trials were
designed to evaluate the residual ice on the lamp samples after 30 minutes of operation at -20 °C.
For Trials 1 and 3, the placement of the lamp samples within the testing frame was randomized.
Selected photographs of the Ice Melt Test are provided in Appendix B.
3.5 Snow Accumulation Test
Following the Ice Melt Test, researchers completed the Snow Accumulation Test on January 7,
2020, using one of the wooden test frames and the metal test frame. Photographs taken during
the Snow Accumulation Test are provided in Appendix C. The test frames were securely chained
to the floor of the CWT in order to withstand the expected wind loading. Following the
recommendations of ACE test personnel, an ambient temperature of -20 °C to -15 °C was the
ideal temperature for creation of wet, sticky snow that would be likely to stick to the lamps. All
lamp samples were left in the CWT overnight to stabilize at temperatures between -20 °C and
-15 °C.
11Figure 6. Test frame installed in the CWT prior to Snow Accumulation Test
After allowing the lamps’ temperature to stabilize overnight, researchers increased the ambient
temperature of the CWT to approximately -7 °C. The slightly higher temperature allowed for the
production of snow with “packing” characteristics, or snow that could more easily accumulate on
the lamp surfaces. The research team sought this type of snow to simulate the worst-case
conditions in which the lamps would likely be used.
The experimental design for this test included three trials. For each trial, the team tested a
different set of lamps and randomly selected their position within the testing frames. The first
two trials were conducted with wind speeds of approximately 70 mph (113 km/h). The last trial
was conducted with wind speeds of approximately 90 mph (145 km/h). During all trials, all
lamps were powered with 75 VDC to simulate “bright” mode operation for 30 minutes. After this
period, any accumulation of precipitation was documented via photographs, videos, and
measurements. The thickness of ice present was measured using a digital caliper, a two-sided
steel ruler, and a depth gauge.
124. Results and Discussion
This section presents a summary Phase IV testing results as well as an explanation of the analysis
employed and discussion of the implications.
4.1 Ice Melt Test Results
After researchers had applied the desired 1/4-inch thick layer of ice, they rotated the test frames
so that the light fixtures were aimed parallel to the ground, replicating the typical orientation
when installed on a locomotive. Three separate frames were used to test multiple samples
simultaneously. The three test frames were positioned in a way that none of the lamps would
project light directly onto another lamp (see Figure 7). This precaution was taken to avoid a
scenario where light projected onto a lamp may expedite melting of the ice.
Figure 7. Setup of test frames in the SCC
13During the Ice Melt Test, five 30-minute trials were completed. In each trial, up to nine lamp
samples were tested. The original test plan included a single 30-minute trial for each group of
lamps. Based on discussions with the AAR TAG and FRA during the test planning, researchers
expected that this length of time would be sufficient to allow the lamps to melt the 1/4-inch layer
of ice. Following the first trial, no ice melting was observed on any of the LED samples.
However, both halogen lamps used in this trial melted all ice from the lens surfaces within 6 to 7
minutes. Following this initial trial, the researchers modified the test plan by extending the
planned 30-minute trials to 1 hour, in order to determine if a longer period of time would
facilitate defrosting of the LED lamps.
Table 1. Summary of Ice Melt Test trials
Trial # Duration (minutes) Ambient Comments
Temperature (°C)
1 30 -40 °C
2 30 -40 °C Extension of Trial 1
3 30 -40 °C
4 30 -20 °C Same lamps as Trial 3
5 30 -20 °C Extension of Trial 4
4.1.1 Trial 1
For the first trial of the Ice Melt Test, nine lamp samples were evaluated, consisting of seven
LED lamps and two halogen lamps. The average temperature in the SCC during this trial was
-38.5 °C; the RH varied between 60 percent and 80 percent. During the first trial, only the two
halogen samples exhibited melting of the ice layer, which was completely melted from both
samples in less than 7 minutes (see Table 2). Figure 8 shows that after 30 minutes, the ice
remained on all LED samples in this trial, while the halogen samples were completely free of ice.
14Table 2. Ice Melt Test, Trial 1 – temperature -40 °C
Lamp Test Lamp Melting Time of Event
Comment
No. Frame Code Event? (minutes)
1 1 LED 3 No -
2 1 LED 1 No -
3 1 LED 2 No -
4 1 LED 4 No -
The melting process started within 2
5 1 Halogen 1 Yes4.1.3 Trial 3
For Trial 3, a different combination of nine lamp samples were tested, consisting of seven LED
lamps and two halogen lamps. The average temperature during this trial was -39.3 °C; RH was
between 60 percent and 80 percent. Consistent with the Trial 1 observations, after 30 minutes of
operation in “bright” mode, only the halogen lamp completely melted the layer of ice. The
melting of the ice layer began within 2 minutes of being powered on and was completed in less
than 8 minutes.
After 30 minutes of operation, no LED samples had completely melted the ice layer. However,
two LED lamp models (three samples in total) exhibited partial melting of the ice or other signs
of an interaction between the lamp’s heat and the layer of ice covering the lens. The two samples
of LED 3 exhibited a partial separation of the layer of ice from the lens face of the lamps. In
addition, one of the LED 3 samples developed icicles on the bottom portion of the light fixture,
indicating ice had melted, dripped down, and refrozen. The LED 2 sample tested in Trial 3
developed a flurry-like structure on the outer layer of ice covering the lens, just as it had in Trial
2.
Table 3. Ice Melt Test, Trial 3 – temperature -40 °C
Time of
Lamp Test Lamp Melting
Event Comment
No. Frame Code Event?
(minutes)
Layer started separating from the lens face,
1 1 LED 3 Partial -
and flurry-like structure on outer layer.
2 1 LED 1 No -
3 1 LED 2 Partial - Flurry-like structure on outer layer
4 1 LED 4 No -
5 1 LED 4 No -
6 2 LED 1 No -
7 2 LED 4 No -
The melting process started within 2
8 2 Halogen 2 YesFigure 9. Light fixtures after Trial 3 and 30 minutes of operation
4.1.4 Trial 4
In Trial 4, researchers tested nine LED lamp samples. After the limited ice melting by LED
samples in Trials 1–3, the average ambient temperature during Trial 4 was increased to -19.9 °C;
average RH was measured at approximately 80 percent.
The LED samples were powered on and operated in “bright” mode for 30 minutes. Again, none
of the LED lamps completely melted the ice layer. However, all LED lamp models tested, other
than LED 1, showed some change in the appearance of ice layer. Table 4 shows the results of
Trial 4 and describes the change in appearance of the ice that was observed.
Compared to the results exhibited in the prior trials, the partial melting produced by LED 2 were
characterized by larger portions of the lens being free of ice. Samples of LED 3 developed larger
icicle formations and the separation between the lens and the ice layer increased (see Figure 10).
Samples of LED 4, which extended farthest beyond the lamp housing, melted ice into water
droplets around the lateral portion of the lamp (see Figure 10).
17Table 4. Ice Melt Test, Trial 4 – temperature -20 °C
Time of
Lamp Test Lamp Melting
Event Comment
No. Frame Code Event?
(minutes)
Layer started separating from the lens face,
1 1 LED 3 Partial -
and flurry-like structure on outer layer.
2 1 LED 1 No -
3 1 LED 2 Partial - Flurry-like structure on outer layer
4 1 LED 4 - - Water droplets around the lamp
5 1 LED 4 - - Water droplets around the lamp
6 2 LED 1 No -
7 2 LED 4 - - Water droplets around the lamp
8 2 LED 2 Partial - Partial melt on the lens face
Longer icicle formations and separation of ice
9 Metal LED 3 Partial -
from the lens face
Figure 10. LED light fixtures after 30 minutes of operation at -20 °C
184.1.5 Trial 5
Following the incomplete melting of ice documented in Trial 4, researchers performed an
additional 30-minute trial at a temperature of -20 °C as an exploratory exercise. The goal of this
trial was to evaluate if the thermal interaction between the lamp and the layer of ice would result
in greater melting with the increased time. After this additional 30 minutes, they found no visible
differences in the appearance of the ice. However, after powering off the lamps and documenting
the extent of remaining ice, they observed that several samples of all lamp models had
weakened. Specifically, the ice contacting the lens had melted, leaving a small gap, although the
ice layer was still attached to the lamp housing. When the housings of some lamp samples were
intentionally struck with moderate force, the layer of ice fell from the lens face.
The separation of the ice layer from the lamp lens suggests that vibration could work in
conjunction with the lamp’s heat output to facilitate the removal of ice from the lamp lens. A
locomotive in motion may produce enough vibration to shed any accumulation of ice on LED
lamps. However, this would require the locomotive to begin track movements prior to the LED
lamp being completely defrosted, resulting in slightly less light output from the obscured lamp.
Note that these LED lamps required more than 30 minutes to weaken the ice layer enough to be
dislodged by applying a moderate amount of force.
Figure 11. Layer of ice falling from lens face after moderately hitting the lamp housings
4.2 Snow Accumulation Test Results
For the Snow Accumulation Test, lamp samples were tested using one of the wooden test frames
and the metal test frame, as shown in Figure 6. The test frames were positioned perpendicular to
the direction of the airflow and the precipitation nozzle of the CWT (see Figure 12).
For the Snow Accumulation Test, researchers completed three separate 30-minute trials. Trials 1
and 2 were conducted at winds speeds of 70 mph (113 km/h) while Trial 3 was conducted at 90
19mph (145 km/h). All trials were performed at similar ambient temperature (-7 °C) and RH (an
average of 92 percent RH). During each trial, up to seven lamp samples were tested. A total of
sixteen LED lamps and three halogen lamps were tested during the course of all three trials.
Figure 12. Test frames inside the CWT at wind speeds of 70 mph (113 km/h)
4.2.1 Trial 1
Trial 1 involved testing six LED lamps and one halogen lamp. During this trial, no visible
accumulation of snow or ice was present on the LED lamps. Approximately 10 minutes into the
testing, the halogen sample began accumulating ice near the bottom of the light fixture. After
approximately 14 minutes of operation, the accumulation of ice on the halogen lamp became
visible via the video cameras. Icicle formations were observed on the bottom of the light fixture,
and a shroud of ice formed over the lamp lens (see Figure 13).
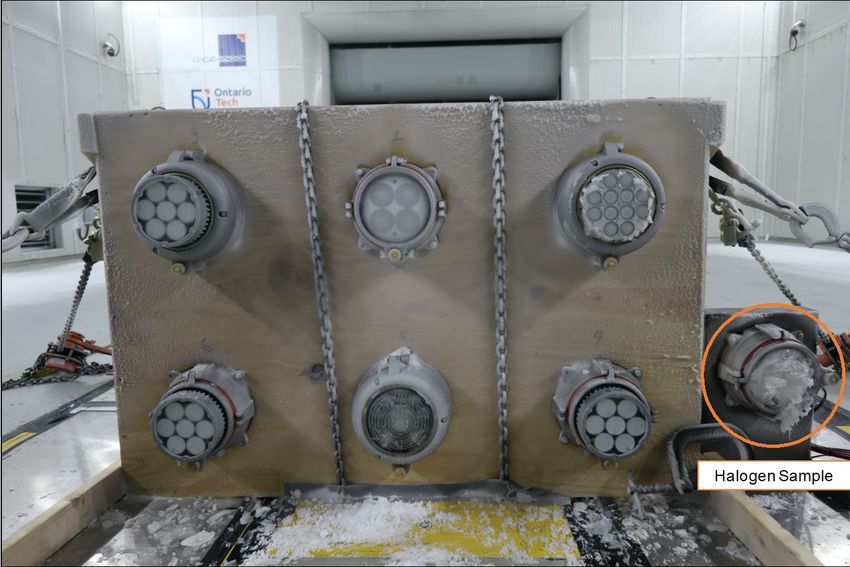
After 30 minutes of operation, all lamps were powered off and the presence of ice or snow on the
lamps was documented. Table 5 presents the results of Trial 1. LED 1 and 4 accumulated less
than 1/16-inch of ice or snow on the lens, while LEDs 2 and 3 accumulated layers between 1/8-
inch and 1/4-inch thick. The layer of ice formed on LEDs 2 and 3 was not smooth or uniform,
resulting in the range of thickness measurements. Figure 14 and Figure 15 show the
accumulation of ice and snow on the light fixtures for Trial 1. As is seen in these figures, the
accumulation of ice on the halogen sample was significant. No ice accumulated directly on the
lens of the halogen lamp, but a significant dome of ice was formed over the lens and attached to
the lamp housing.
20Figure 13. Photo taken during Trial 1 with detail view of halogen lamp
Table 5. Accumulation of Snow Test, Trial 1 – 70 mph wind
Lamp Test Lamp
Accumulation? Thickness Comment
No. Frame Code
1 1 LED 3 Yes 1/8 inch - 1/4 inch
2 1 LED 2 Yes 1/8 inch - 1/4 inch
3 1 LED 1 Yes < 1/16 inch
Ice dome formed over the light
fixture. The dome protruded
4 1 Halogen 1 Yes *
more than 2 inches from the
front of the fixture.
5 1 LED 4 Yes < 1/16 inch
6 1 LED 3 Yes 1/8 inch - 1/4 inch
Not enough accumulation to
7 Metal LED 4 Yes -
be measurable.
21Figure 14. Accumulation of snow and ice on light fixtures after Trial 1
Figure 15. Close-up view of the accumulation of snow and ice on light fixtures after Trial 1
224.2.2 Trial 2
During Trial 2, researchers tested seven lamp samples. In contrast to Trial 1, the position of the
halogen sample was predetermined to be on the upper row of the testing frame and in a different
type of housing than used previously (see upper-left corner lamp in Figure 16).Other than the
halogen sample, all other lamps were randomly positioned within the testing frames.
Additionally, a non-powered LED sample was included in the bottom-left corner of the wooden
test frame to establish a baseline for the amount of snow and ice accumulation expected on a
non-operational LED. Similar to Trial 1, the results of Trial 2 showed that the halogen lamp
developed a significant dome ice around the lamp. Table 6 contains observations and
measurements made during Trial 2.
Figure 16. Setup of test frames and light fixtures for Trial 2
23Table 6. Snow Accumulation Test, Trial 2 – 70 mph wind
Lamp Test Lamp
Accumulation? Thickness Comment
No. Frame Code
1/32 inch > 1/16
1 1 LED 1 Yes
inch
2 1 LED 2 Yes 1/8 inch - 1/4 inch
Ice dome formed around the light
fixture. The dome protruded more
3 1 Halogen 2 Yes *
than 3.5 inches from the front of the
fixture.
1/32 inch > 1/16
4 1 LED 1 Yes
inch
5 1 LED 3 Yes 1/8 inch - 1/4 inch
Non-powered sample.
6 1 LED 4 Yes < 1/16 inch Not enough accumulation to
measure precisely.
Not enough accumulation to be
7 Metal LED 2 Yes < 1/16 inch
precisely measurable.
During Trial 2, researchers observed an accumulation of ice on the halogen sample after less than
10 minutes of operation. Additionally, the amount of ice that had accumulated at the end of the
trial was greater than what was observed during Trial 1. Figure 17 contains a photograph taken
during Trial 2 after less than 15 minutes of operation. In the upper-left corner of this photograph,
the circled lamp has an extended halo of emitted light compared to the other samples, indicating
the accumulation of ice around the housing. In the bottom-right corner of the figure, portions of
the icicle formations around the light fixture can be seen. Consistent with the results of Trial 1,
the LED 2 and LED 3 samples accumulated the greatest amount of snow and ice, while LED 1
and LED 4 ** samples accumulated the least.
**
LED 4 was not powered during this trial.
24Figure 17. Photograph taken during Trial 2 showing ice accumulation on the halogen lamp
Figure 18 shows the accumulation of snow and ice on the light fixtures after completion of Trial
2. As shown in the upper-left corner of this figure, the extent of ice accumulation on the halogen
sample was significantly greater than the accumulation on the LED samples. The dome of ice on
the halogen sample extended beyond and below the front of the fixture more than 3.5 inches,
while none of the LED samples exceeded 1/4-inch accumulation at the thickest portion
measured.
A visual inspection of the non-powered LED 4 sample revealed that the accumulation of ice was
not significantly different than the accumulation documented when LED 4 was powered during
Trials 1 and 3. In all trials, the ice accumulation observed on LED 4 samples was less than 1/16-
inch.
25Figure 18. Accumulation of snow and ice on light fixtures after Trial 2
4.2.3 Trial 3
During Trial 3, all samples were randomly positioned within the wooden test frame while the
halogen sample was installed in the metal test frame. A total of seven samples were tested, five
LEDs and one halogen. This trial was conducted at wind speeds of approximately 90 mph (145
km/h).
The results observed during Trial 3 strongly correlated with results from previous trials; the
halogen sample collected the greatest amount of snow and ice. Once more, after approximately
10 minutes of operation, there were visual indicators that the halogen sample was developing a
dome of ice and an extended halo of light. The dome of ice covering the halogen light fixture at
the end of the trial was not as pronounced as it had been after Trial 2, extending beyond the
fixture approximately 2 inches. Similar to previous trials, the LED samples corresponding to
models LED 2 and LED 3 accumulated the greatest amount of ice or snow directly on the lens,
while models LED 1 and LED 2 accumulated the least amount of ice or snow. Table 7 shows the
results of Trial 3 and the measured accumulation of snow and ice.
The increase in wind speed (from 70 mph to 90 mph) did not have a statistically significant
effect on the total accumulation of snow or ice on the samples. Given the nature, purpose, and
experimental design for this test, it was not possible to conclusively analyze the effect that wind
speed may have on the accumulation of snow and ice.
26Table 7. Snow Accumulation Test, Trial 3 – 90 mph wind
Lamp Test Lamp
Accumulation? Thickness Comment
No. Frame Code
1 1 LED 3 Yes 1/8 inch - 1/4 inch
2 1 LED 1 Yes4.3 Discussion of Ice Melt and Snow Accumulation Tests
For all Ice Melt trials conducted at -40 °C, the general trend observed was that the halogen lamps
completely melted the 1/4-inch-thick layer of ice in under 30 minutes. None of the LED samples
tested exhibited complete melting of the ice. However, the samples of model LED 2 and LED 3
did generate sufficient heat to weaken the bond between the ice and the lens. When the chamber
temperature was increased to -20 °C, LED 2 and LED 3 exhibited greater weakening of this
bond. In some samples, the layer of ice was slightly separated from the lens or portions of the
layer were partially melted. This resulted in the ice layer being sufficiently weakened so that the
ice broke loose from the housing with a moderate impact to the housing, suggesting that the
vibration of a locomotive in motion may assist with defrosting the lamps. In other samples,
icicles were produced toward the bottom of the light fixture, indicating a thaw and refreeze
process had occurred. Finally, other samples formed flurry-like structures of snowflakes on the
ice layer. In contrast, LED 1 and LED 4 did not exhibit signs of weakening or partial melting of
the ice layers.
The Snow Accumulation Test revealed that the lamp models that exhibited a greater tendency to
melt ice (i.e., Halogen 1, Halogen 2, LED 2 and LED 3) were also the models that accumulated
the greatest amount of snow and ice. The halogen samples developed a significant dome of ice,
which in most trials completely covered the lens. LED 2 and LED 3 accumulated a layer of ice
on the lens; however, this accumulation was much thinner than what researchers observed on the
halogen lamps. This result suggests a somewhat counterintuitive relationship between the lamp’s
heat output, the propensity to accumulate ice at high wind speeds and the ability to melt ice at
low temperatures without the presence of wind. The samples that generated more heat (i.e., the
halogen lamps) were more likely to defrost completely during the Ice Melt Test. However, these
samples proved to accumulate greater amounts of snow and ice during the Snow Accumulation
Test, with higher lamp temperatures corresponding to greater accumulation on the light fixture.
28You can also read