Comparing the application of CEA and BCA to tuberculosis control interventions in South Africa
←
→
Page content transcription
If your browser does not render page correctly, please read the page content below
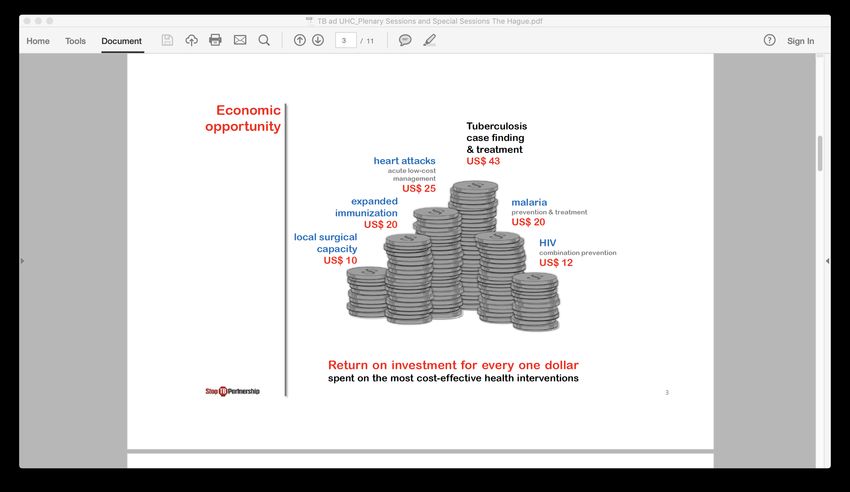
Comparing the application of CEA
  and BCA to tuberculosis control
  interventions in South Africa

  Tommy Wilkinson, Fiammetta Bozzani, Anna
  Vassall, Michelle Remme, Edina Sinanovic

  Presenter:
  Tommy Wilkinson, Lecturer, Health Economics Unit,
  University of Cape Town, and
  Consultant, Health, Nutrition, and Population Global
  Practice, World Bank

With thanks to: National Department of Health, South Africa; TB Think Tank;
TIME modelling team; Bill and Melinda Gates Foundation;
BCA reference case team and particularly Brad Wong, Lisa Robinson, Jim
Hammitt, peer reviewers
Background
• Tuberculosis (TB) is the leading cause of death in South Africa.
• In 2014, the South African TB Think Tank was established to
  advise the National Department of Health (NDoH) on policy and
  programmatic implementation of TB interventions
• Institutionalisation of economics and disease modelling to
  inform priorities for the national TB programme
• Economic evaluation conducted to inform the National Strategic
  Plan 2017-2022, employing the TIME (TB Impact Model
  Estimates)
• Conventional approach, estimating of incremental cost-
  effectiveness ratios (per DALY averted (Burden of Disease)) with
  and without constraints of different interventions
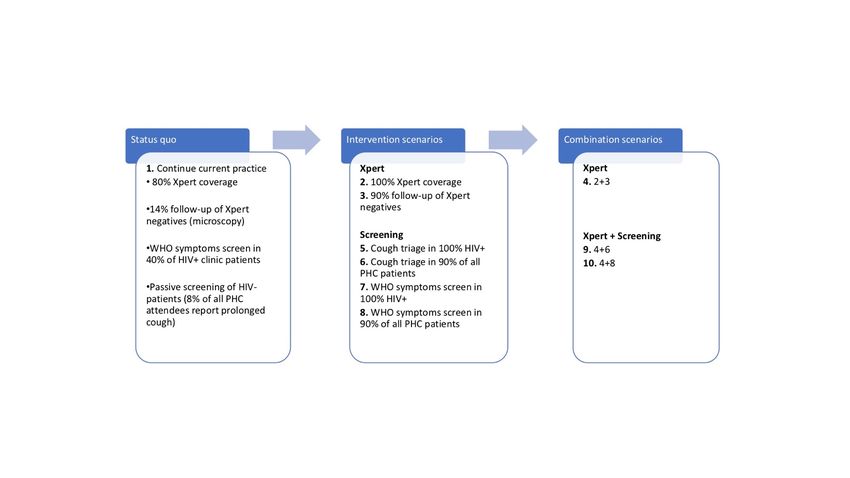
10 scenarios for TB case detection:
Applying the BCA guidelines
• Provide a test-case for the BCA guidelines
• Feasibility under data scarcity
• Would the results tell us or policy makers
  something new/ different than CEA?
                                                                        Summary Analytical
                             Costs                 Health Impact
                                                                            Output
       Cost       South African government
                                               Lives saved,             Incremental cost
  Effectiveness   Health system and TB
                                               DALYs averted            effectiveness ratios
     Analysis     program costs
                  South African government
                  Health system and TB         Valuation of mortality
   Benefit Cost                                                         Net benefits, benefit
                  program costs, with third    and morbidity risk
    Analysis                                                            cost ratios
                  party costs represented as   reductions
                  additional analysis
Data on costs and benefits • Extensive primary data collection of TB costs • Surveys of patients (direct costs and income loss) • Programmatic data for coverage (baseline) (incremental) • Effectiveness data systematic reviews and meta-analysis • Incidence data and other data combination of secondary and primary data collection • Conventional model calibration, extensive consultation with NDoH
Costs
                     Intervention               Total              Total            Total
                                          0% discount rate   3% discount rate   5.04% discount
                                                                                     rate

    2                  100% Xp                $1 175              $836              $ 672

    3                90% FU Xp -               $257               $183              $ 147

    4                    2&3                  $1 464             $1 042             $ 838

    5           100% HIV+ cough triage        -$1 807            -$1 241            -$971

    6           90% PHC cough triage          $1 843             $1 314            $ 1 058

    7               100% HIV+ SS              $9 504             $6 729            $5 394

    8                90% PHC SS               $13 383            $9 494            $ 7 617
                        4&6
    9                                         $3 468             $2 469            $ 1 987

   10                    4&8                  $16 323            $11 570           $9 277

Total cost of interventions by element of the treatment pathway 2015-2035 at differing
discount rates (in 2015 Int$, millions, incremental to status quo)
Value of statistical life: South Africa
• Lack of data on WTP in SA, so conduct benefits transfer
• Value of statistical life calculation:
VSLtarget = VSLbase * (Incometarget/ Incomebase) elasticity
• Income base is SA 2015 per capita income adjusted for purchasing power parity ($12,840),
adjusted for income growth 2.52% over time
• Approach 1: ratio of GNI per capita to VSL estimates commonly used in the US ($9.1
million), with elasticity of 1 = Int$2 054 400
• Approach 2: ratio of GNI per capita to VSL estimates commonly used in the OECD ($2-3
million) with elasticity of 1 = Int$1 284 000
• Approach 3: approach 1, but using an elasticity of 1.5 = Int$ 981 652
• Value of statistical life year (VSLY) calculated by dividing VSL by mean undiscounted
expected life years remaining for average South African adult (30.75 years)Deconstructing the DALY:
Years Lived with Disability, Years of Life Lost
(Red area measures DALYs. Red + white is a “full and healthy” life)
No
disability
Max
disability
0 years Expected no.
years full life
Figure adapted from Arnesen, NorheimDeconstructing the DALY:
Deaths, Years Lived with Disability, Years of Life Lost
No
disability • Morbidity benefit = sum(YLDt*VSLYt)
where YLD is YLD averted incremental to status quo
• VSLY adjusted for growth at time = t
Max
disability
Expected no.
0 years years full life
Figure adapted from Arnesen, NorheimDeconstructing the DALY:
Deaths, Years Lived with Disability, Years of Life Lost
No • Mortality benefit=sum(deatht*VSLt)
disability (where deaths are incremental to status quo)
• VSL adjusted for growth at time = t
• In context where mortality is
occurring very early or very late in
Max life, can also use:
disability Mortality benefit= sum(YLLt*VSLYt)
Expected no.
0 years years full life
Net health benefits = Mortality benefit + Morbidity benefit
Figure acknowledgement Arnesen, NorheimBenefits
Total monetized
Monetized Monetized Monetized benefit
Total benefit
Intervention benefit of Total YLD benefit of of morbidity risk
deaths (combined
(incremental to status quo) mortality risk averted morbidity risk reduction + 3rd-
averted mortality and
reduction reduction party costs)
morbidity)
2 100% Xp 17 913 24 309
$19 351 $854 $930 $20 205
3 90% FU Xp - 5 170 9 189
$5 569 $321 $303 $5 891
4 2&3 22 780 34 203
$24 597 $1 201 $1 257 $25 798
5 100% HIV+ cough triage 1 769 5 047
$1 832 $174 $233 $2 006
6 90% PHC cough triage 15 571 14 815
$16 827 $521 $494 $17 347
7 100% HIV+ SS 35 775 52 771
$38 490 $1 842 $1 615 $40 333
8 90% PHC SS 55 429 53 039
$59 912 $1 865 $1 557 $61 778
9 4&6 37 237 48 181
$40 213 $1 692 $1 739 $41 905
10 4&8 73 970 83 701
$79 903 $2 941 $2 835 $82 844
Total monetized benefit by mortality and years lived in disability incremental to status quo 2015-2035 (in 2015 Int$, ‘millions).Net benefits and benefit-cost ratios
Intervention Net benefit Net benefit Benefit-cost ratio
(Int$) (ZAR)
2 100% Xp $19 369 R107 770 21
3 90% FU Xp - $5 708 R31 757 28
4 2&3 $24 756 R137 741 21
5 100% HIV+ cough triage $3 247 R18 067 >100
6 90% PHC cough triage $16 033 R89 210 11
7 100% HIV+ SS $33 603 R186 969 5
8 90% PHC SS $52 284 R290 907 6
9 4&6 $39 436 R219 420 15
10 4&8 $71 274 R396 570 6
Net benefit and BCR by intervention, incremental to status quo
2015-2035 (in 2015 Int$ millions and ZAR millions)CEA results:
Incremental Cost Effectiveness Ratios
6 000 000
Incremental costs, (thousands US$ 2015)
5 000 000
10
4 000 000
8
3 000 000
7
2 000 000
1 000 000 9
0 6 4
-
- 5 500 1 000 1 500 2 000
(1 000 000)
Incremental DALYs averted (thousands)
Unconstrained scenario; Bozzani et alInterpreting Results:
• CEA (decision rules based on opportunity cost threshold and expansion
path)
• Invest in Int 9 (Xpert with follow-up and cough triage), Int 5 and 10
potential policy options
• BCA (decision rule maximize welfare gain)
• Int. 10: Highest net benefit under all approaches to VSL calculation,
but a relatively low RoI
• Moving from Int. 9 to Int 10 involves replacing cough triage with
symptom screen in primary health centre
• Both are “correct”, but measuring differing things
• Presentation and policy translation will determine interpretation
and potentially policy responses
• Many other factors will influence policy selection – the evaluation
process is integral to establishing and quantifying additional factorsDiscussion: Methods
• Given historical and persistent levels of inequity and access to care in South Africa:
• To what extent is a monetized value of individual preferences for changes in one’s own risks
valid in determining health policy?
• How can the objective function to maximise health under a budget constraint be balanced
against other social values?
• Intervention in TB is driven by mortality prevention:
• But would it be consistent to assume the value of disability compared to death is the same as
value of risk of disability to risk of death?
• Valid in South Africa for intersectoral resource allocation?
• Likely, but more BCA evaluations required
• But does either analytical approach sufficiently focus the issue on the constraints to health
sector budget, capacity to deliver?
• Income growth assumptions in long term in South Africa
• Credibility and complexity for non-economist decision makers (even if only
advocating with the Treasury)BCA: Making a case for investment
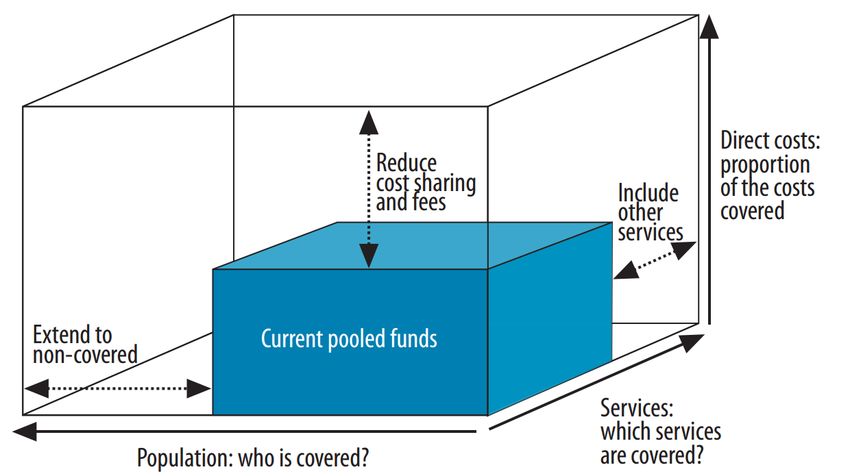
CEA: Coverage decisions within
        constrained, pooled funding
    Central UHC questions:

•     How much of the
      cost is covered?

•     Who is covered?

•     What is covered?

      Source: World Health Organization, World Health Report, 2010

         UHC = Universal Health Coverage
Which method? “Ultimately, the validity of the differing approaches rests on the requirements, understanding, and informational needs of the intended decision maker, and the realities of local perspective, and context”
You can also read


