Community Supervision Program - Court Services and Offender Supervision Agency - Congressional Budget Justification
←
→
Page content transcription
If your browser does not render page correctly, please read the page content below
Court Services and Offender Supervision
                Agency

   Community Supervision
        Program

     Congressional Budget Justification
             Fiscal Year 2021
                February 10, 2020
Table of Contents
AGENCY OVERVIEW: ................................................................................................................. 3
FY 2021: CSP BUDGET REQUEST .......................................................................................... 11
FY 2021 CHANGES TO BASE: ....................................................................................................12
CSP PROGRAM EFFECTIVENESS .......................................................................................... 13
RECIDIVISM ...............................................................................................................................14
SUCCESSFUL COMPLETION OF SUPERVISION ...........................................................................20
PERFORMANCE INDICATORS: .............................................................................................. 21
REARREST..................................................................................................................................21
TECHNICAL VIOLATIONS ..........................................................................................................23
DRUG USE ..................................................................................................................................24
EMPLOYMENT ...........................................................................................................................26
EDUCATION ...............................................................................................................................26
HOUSING ....................................................................................................................................27
ORGANIZATIONAL STRUCTURE .......................................................................................... 29
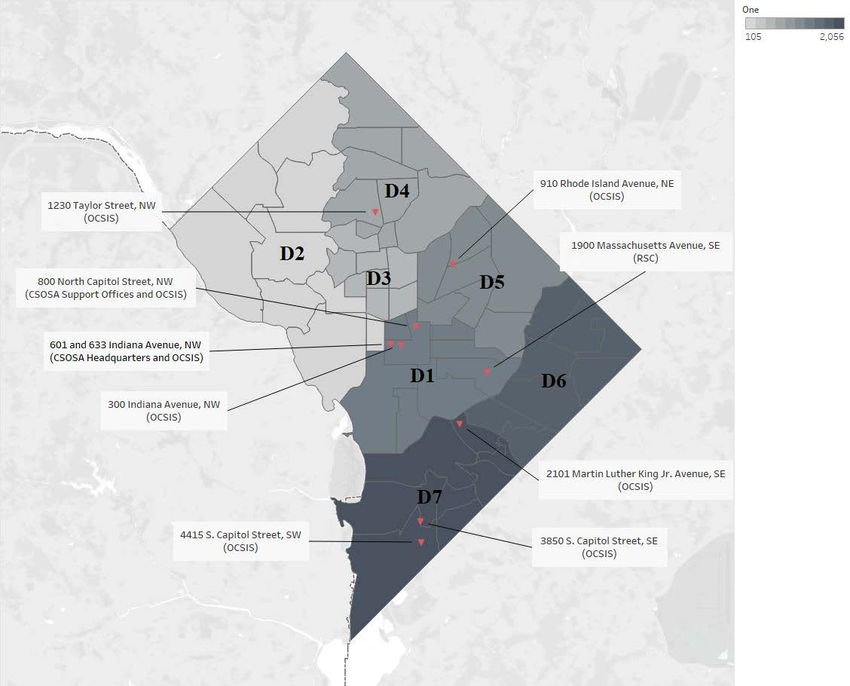
FIELD UNIT LOCATIONS ......................................................................................................... 30
RESOURCE REQUIREMENTS BY STRATEGIC GOAL...................................................... 32
STRATEGIC GOAL 1: REDUCE RECIDIVISM BY TARGETING CRIMINOGENIC
RISK AND NEEDS USING INNOVATIVE AND EVIDENCE-BASED STRATEGIES ...... 34
STRATEGIC GOAL 2: INTEGRATE OFFENDERS INTO THE COMMUNITY BY
CONNECTING THEM WITH RESOURCES AND INTERVENTIONS ............................... 40
STRATEGIC GOAL 3: STRENGTHEN AND PROMOTE ACCOUNTABILITY BY
ENSURING OFFENDER COMPLIANCE AND CULTIVATING A CULTURE OF
CONTINUOUS MEASUREMENT AND IMPROVEMENT ................................................... 42
STRATEGIC GOAL 4: SUPPORT THE FAIR ADMINISTRATION OF JUSTICE BY
PROVIDING TIMELY AND ACCURATE INFORMATION TO CRIMINAL JUSTICE
DECISION-MAKERS ................................................................................................................... 52
BUDGET DISPLAYS:................................................................................................................... 58COURT SERVICES AND OFFENDER SUPERVISION AGENCY
FOR THE DISTRICT OF COLUMBIA
Fiscal Year 2021 Budget Request
Community Supervision Program
Agency Overview:
The Court Services and Offender Supervision Agency’s (CSOSA’s) Community Supervision
Program (CSP) supervises adults released by the Superior Court for the District of Columbia on
probation, those released by the U.S. Parole Commission on parole or supervised release, as well as
a smaller number of individuals subject to Deferred Sentencing Agreements (DSA) or Civil
Protection Orders (CPOs). The CSP strategy emphasizes public safety, successful re-entry into the
community, and effective supervision through an integrated system of comprehensive risk and
needs assessments, close supervision, drug testing, treatment and support services, and incentives
and sanctions. CSP also develops and provides the Court and the U.S. Parole Commission with
critical and timely information for sentencing determinations, supervision conditions and offender
compliance.
The criminal justice system in the nation’s capital is complex, with public safety responsibility
spread over both local and federal government agencies. CSP works closely with law enforcement
entities, such as the D.C. Metropolitan Police Department (MPD), the Superior Court for the
District of Columbia, and D.C. Department of Corrections, as well as the Federal Bureau of Prisons
(BOP), the U.S. Parole Commission, the U.S. Attorney’s Office, and the U.S. Marshals Service to
increase public safety for everyone who lives, visits or works in the District of Columbia. CSP also
relies upon partnerships with the District of Columbia government, local faith-based and non-profit
organizations to provide critical social services to the offender population.
Agency Realignment:
In 2018, CSP initiated a major, significant organizational realignment. This realignment was driven
by the need to continuously align business practices with evidence-based practices (EBPs) in
community corrections, respond to the changing risk factors of our supervised population, and meet
our commitment to continuous quality improvement. Internally, this is part of our ongoing efforts to
enhance operational efficiency, improve program effectiveness, and align organizational resources
with our priorities and evolving needs. Of equal importance, it also coincides with the development
and release of our FY 2018–2022 Strategic Plan.
The purpose of the realignment is to maximize organizational efficiencies, as well as the Agency’s
opportunities to positively impact public safety, through the use of EBPs. The realignment resulted
in the creation of CSP’s Office of Community Supervision & Intervention Services (OCSIS) which
addresses the following mission-critical functions: operations support activities, accountability and
monitoring of offenders, and high-risk containment and behavioral intervention strategies for
CSOSA’s highest-risk offenders.
3D.C. MPD Collaboration: In FY 2019, CSP partnered with D.C. MPD to hold several coordinated
weekend/night events in high crime areas, each over a two-night period. The heightened, visible
law enforcement presence occurred when violent crime spiked and demonstrated the Agency’s
commitment to public safety. Law enforcement reported a significant decline in violent activity in
the targeted areas during these collaborative evening events. In addition, CSP participated in joint
crime initiatives throughout the summer of 2019, where CSP expanded employment visits,
increased community contacts, and held Saturday morning reporting twice per month that offered
offenders various programs to aid in successful reintegration.
High Intensity Supervision Teams (HISTs): In FY 2019, CSP realigned existing supervision
resources to create five (5) HISTs performing close supervision of our highest-risk offenders. The
optimum supervision caseload ratio for the HISTs is 25:1, or lower, allowing for intense
supervision by a CSP law enforcement officer. HIST Community Supervision Officers (CSOs)
provide pro-active supervision and address non-compliance with swift and certain sanctions. HIST
CSOs often work nights and weekends, assisting D.C. MPD in high-crime areas or with special
crime initiatives. CSP expanded the number of HISTs and CSOs with intensive supervision
caseloads in FY 2020 to address the number of arrests for violence, weapons, and other felonies
occurring disproportionately among offenders at the highest risk levels.
Triage Screener: In July 2018, CSP deployed our Triage Screener providing an immediate, risk-
anticipated assessment with an appropriate supervision level within 24 hours after an offender
begins supervision. In August 2019, the response time for Triage Screener results was improved to
less than one minute, allowing CSP to immediately place an offender in appropriate supervision
upon intake.
Dynamic Risk Assessment for Offender Re-entry (DRAOR): In FY 2019, CSP acquired the
DRAOR offender assessment instrument. The DRAOR augments static risk scales by accounting
for real-time changes in dynamic and acute risks (i.e., those demonstrated to anticipate an imminent
supervision failure). Also, unlike many other correctional assessment tools, the DRAOR assesses
protective factors that may mitigate the risk of an offender engaging in future criminal
behavior. The DRAOR is one of the assessment tools that will be used by the Agency to aid in
identifying risks and needs among the supervised population. Deployment of the DRAOR began in
the first quarter of FY 2020.
Evidence-Based Practices (EBPs): In FY 2019, CSP increased our use of Cognitive Behavioral
Interventions (CBI) for addressing high-risk offenders. CBI focuses on criminogenic needs that
research states reduce recidivism, create safer communities, and reduces victimization. CSP
provides extensive staff training and established informal learning teams to perpetuate CBI
practices and culture.
Compliance Monitoring and Intelligence Center: In June 2019, CSP created a Compliance
Monitoring Intelligence Center, located at 300 Indiana Avenue, NW (co-located with D.C. MPD’s
headquarters). The Center operates from 6:00 AM until 10:00 PM Monday-Saturday ensuring
offender compliance with real-time Global Positioning System (GPS) requirements, sharing
intelligence on high-risk offenders with D.C. MPD and other law enforcement agencies, tracking
offender rearrests, and coordinating CSP’s immediate responses to compliance issues.
4Rapid Engagement Team (RET): The RET was created to address high-risk, non-compliant
offenders with emphasis on those who are not compliant with GPS requirements, Re-entry and
Sanction Center walk-aways, and offenders on warrant status. The RET engages with D.C. MPD to
conduct after-hour accountability tours and work with the Warrant Team to apprehend high-risk
offenders who have active arrest warrants. In addition, in FY 2019 and continuing into FY 2020,
RET collaborates with D.C. MPD and the Metro Transit Police Department to conduct visibility
tours that target areas of increased criminal activity. The RET operates 6:00 AM until 10:00 PM
Monday-Saturday.
Randomized Offender Drug Testing: In May 2019, CSP implemented a program to perform
randomized drug testing of all HIST offenders. HIST offenders are required to contact CSP every
business day to determine if they have been selected for drug testing on that day at one of four CSP
substance collection units. Randomized drug testing is expected to serve as an increased deterrent to
drug use.
Community Engagement and Achievement Centers (CEACs): As of September 30, 2019, 29.1
percent of our total offender population lacked a GED or high school diploma, and 47.5 percent of
our employable offender population was unemployed. In FY 2019, CSP initiated the re-engineering
of our CEACs and plans to provide increased remedial education and vocational training based on
continued employment and education challenges faced by our offenders. CSP plans to expand
CEAC programming to the Re-entry and Sanctions Center (RSC) in FY 2020.
Employment Initiatives: In FY 2019, CSP expanded its efforts to train offenders for the workplace
and identify employment opportunities. Specifically, CSP invited prospective employment partners
and a congressional leader to a Second Chance hiring event, established a new working relationship
with the Society for Human Resource Management, and developed a set of new programs aimed at
implementation in FY 2020. One program is patterned after the Joseph Project, a successful
employment initiative in Wisconsin, that identifies and recruits employers who agree to hire
offenders completing a job preparation program run by CSP and a community partner. Moreover,
CSP is seeking approval from the Office of Personnel Management (OPM) to hire a small number
of former offenders to temporary six-month positions with the Agency. Those selected for this
program would serve as “Credible Messengers” to offenders under supervision, offering mentoring
and coaching based on their own unique experiences. Finally, CSP developed the “Hire One”
campaign, directly aimed at the region’s employers, seeking their commitment to offer employment
to former offenders.
5Supervised Offender Summary
In FY 2019, CSP monitored or supervised approximately 9,500 adult offenders on any given day
and 14,830 different offenders over the course of the fiscal year. Approximately 85 percent of
offenders supervised during the year were male, and 15 percent were female. During FY 2019,
5,372 offenders entered CSOSA supervision: 4,175 men and women sentenced to probation by the
Superior Court for the District of Columbia (to include those with DSAs and CPOs) and 1,197
individuals released from incarceration in a Federal BOP facility on parole or supervised release.
Parolees serve a portion of their sentence in prison before they are eligible for parole at the
discretion of the U.S. Parole Commission, while supervised releasees serve a minimum of 85
percent of their sentence in prison and the balance under CSP supervision in the community.
Offenders are typically expected to remain under CSP supervision for the following durations 1:
Probation: 20 to 21 months;
Parole: 12 to 18 years;
Supervised Release: 40 to 41 months;
DSA: 9 to 10 months; and
CPO: 12 to 13 months
On September 30, 2019, CSP supervised 8,900 individuals, including 5,591 probationers, 2,982
offenders on supervised release or parole. 182 defendants with DSAs, and 145 respondents with CPOs.
Just over 7,100 of those under supervision reside in the District of Columbia, representing about 1 in
every 81 adult residents of the District on this date. 2 The remaining supervised offenders, defendants, or
respondents reside in another jurisdiction, and their cases are monitored by CSP per the Interstate
Compact Agreement (ICA).
CSP Supervised Offenders by Supervision Type, as of FYs 2017–2019
September 30, 2017 September 30, 2018 September 30, 2019
Supervision Type
N % N % N %
Probation 5,853 57.9 5,926 61.3 5,591 62.8
Parole 1,045 10.3 950 9.8 884 9.9
Supervised Release 2,696 26.7 2,382 24.6 2,098 23.6
DSA 242 2.3 201 2.1 182 2.1
CPO 274 2.7 210 2.2 145 1.6
Supervised Population 10,110 100.0 9,669 100.0 8,900 100.0
1 Values represent the 95% confidence interval around the average length of sentence for the CSP’s FY 2019 Total Supervised
Population. Life sentences have been excluded and, where applicable, extensions to the original sentence
are taken into consideration in the calculation
2 U.S. Census Bureau, 2019 Population Estimates, District of Columbia Adults 18 and Over (577,581). Estimated population data as
of July 1, 2019.
6Total Supervised Offender Population:
CSP’s Total Supervised Population (TSP) includes all offenders with Probation, Parole, and
Supervised Release sentences, and individuals with DSAs or CPOs that are assigned to a CSO and
supervised for at least one day within the 12-month reporting period.
In FY 2019 (October 1, 2018 through September 30, 2019), CSP supervised 14,830 unique offenders.
As shown in the table below, probationers make up the majority of CSP’s TSP, accounting for nearly
two-thirds of the population; nearly one-fourth of the population are on supervised release, and just
under eight percent are on parole. DSAs and CPOs comprise approximately two percent of the
population each.
Data also show that CSP’s TSP has been decreasing for the past several years. The TSP for FY 2019
was 5.7 percent lower than the FY 2018 TSP. Supervised releasees decreased by approximately nine
percent, parolees by seven percent, and probationers by three percent. While the percentage decrease
of DSA and CPOs is fairly high (30 and 13 percent, respectively), as noted above, they comprise a
very small portion of the TSP.
Total Supervised Population (TSP) by Supervision Type FYs 2017–2019
FY 2017 FY 2018 FY 2019
Supervision Type N % N % N %
Probation 10,125 61.7% 10,055 63.9% 9,754 65.8%
Parole 1,448 8.8% 1,266 8.0% 1,173 7.9%
Supervised Release 3,932 24.0% 3,563 22.6% 3,236 21.8%
DSA 481 2.9% 415 2.6% 361 2.4%
CPO 421 2.6% 435 2.8% 306 2.1%
TSP 16,407 100.0% 15,734 100.0% 14,830 100.0%
Offender Risk and Needs:
CSP data shows that the criminogenic and support services needs of supervised offenders are
substantial, and addressing those needs is essential to reducing recidivism. The 5,372 offenders
entering CSP supervision during FY 2019 were characterized by the following:
• 41.2 percent were identified as having anti-social attitudes and temperament; 3
• 31.1 percent were identified as having an immediate substance abuse need while 82.9 percent
self-reported having a history using illicit substances;³
• 25.2 percent lacked prosocial leisure activities;³
• 54.0 percent were unemployed when they began supervision; 4
3 Based on offender entrants for whom a comprehensive assessment was completed. Data reflect assessments completed closest
to when the offender began supervision.
4 Based on offenders deemed “employable” according to job verifications completed closest to when they began supervision.
7• 29.4 percent reported having less than a high school diploma or GED;
• 30.4 percent were identified as having mental health needs;
• 63.9 percent self-reported having children; 40.7 percent of those with dependent-age children
reported being the primary caretaker of those children; ³ and
• 7.5 percent reported that their living arrangement was unstable at intake. 5
Further, many of our offenders, particularly those who have served long periods of incarceration, do
not have supportive family relationships. Economic hardship has only increased the difficulties
offenders face in obtaining employment and housing.
Offender Outcomes:
To monitor how well the Agency is achieving its mission, CSP established one outcome indicator
and one outcome-oriented performance goal related to public safety:
1. Decreasing recidivism among the supervised offender population, and
2. Successful completion of supervision.
In considering these outcomes, CSP recognizes the well-established connection among
criminogenic needs, behavioral health (both substance abuse and mental health challenges) and
crime. Long-term success in reducing recidivism depends upon two key factors:
1. Identifying and treating criminogenic needs, as well as addressing behavioral health issues
and other social problems among the offender population; and
2. Establishing swift and certain consequences for violations of supervision conditions.
CSP recognizes that recidivism places an enormous burden on the offender’s family, the
community, and the entire criminal justice system. We monitor revocation rates and other related
factors, as well as monitor and adjust (as needed) our interventions to meet offender needs. It is not
unusual for offenders to return to CSP supervision. Of the 5,372 offenders who entered supervision
in FY 2019, 21.6 percent had been under CSP supervision at some point in the 36 months prior to
their supervision start date.
CSP research has shown that, compared to the total supervised population, offenders who are
eventually revoked to incarceration are more likely to test positive for drugs, have unstable housing,
Offenders are “employable” if they are not retired, disabled, suffering from a debilitating medical condition, receiving SSI,
participating in a residential treatment program, participating in a residential sanctions program (i.e., incarcerated), or participating
in a school or training program. Employability is unknown for offenders who have not had a job verification conducted.
5 Based on home verifications completed closest to when each offender began supervision. Offenders are considered to have
“unstable housing” if they reside in a homeless shelter, halfway house through a public law placement, transitional housing,
hotel or motel, or have no fixed address. Programs funded by the U.S. Department of Housing and Urban Development (HUD)
use a more comprehensive definition of homelessness and housing instability to include, for example, persons living with
friends or family members on a temporary basis and persons in imminent danger of losing their current housing. CSP does
not routinely track a number of factors considered in HUD’s definition. Therefore, reported figures may underestimate the
percentage of offenders living in unstable conditions.
8lack employment, and/or be assessed by CSP at the highest risk levels. As such, CSP is continuing
to realign existing supervision and offender support services to provide focused interventions and
appropriate supervision for our offender population in an attempt to reduce recidivism and increase
successful completion of supervision.
Offender Arrests for Incidents of Serious, Violent Crime:
The District of Columbia experienced an increase in homicides in 2019, as well as an increase in
robberies and the total number of firearms recovered. Of the 72 individuals arrested for homicides
committed in 2019 in the District of Columbia, eighteen percent (18%) of these arrests involved
individuals under CSOSA supervision at the time of the a homicide. In addition, CSP offenders
were disproportionately impacted as victims of homicides in the District of Columbia in 2019,
when compared with the total population of the District, accounting for approximately fifteen
percent (15%) of all homicide victims.
Despite this increase in homicides and certain other crimes, the overall number of incidents of
serious violence 6 in the District of Columbia has declined since FY 2012. In FY 2012, the average
number of serious incidents per day in the District was 21; by FY 2019, the average declined to less
than 13 incidents per day. From FY 2012 through FY 2019, between six and seven percent of total
serious, violent incidents reported to law enforcement per fiscal year were attributed by arrest to
offenders CSP was supervising at the time of the incident. Importantly, the percentage of CSP
offenders arrested for serious violent incidents while under supervision remains fairly low. Of the
14,830 unique offenders supervised by CSP in FY 2019, two percent were arrested for an incident
of serious violence in the District while under supervision; this is similar to the percentage of CSP’s
TSP arrested for an incident of serious, violent crime in FY 2012.
Despite the low number of CSP offenders arrested for an incident of serious violence in District, the
increase in homicides, firearm recoveries and robberies is of concern to the Agency. As previously
noted, CSP offenders account for eighteen percent (18%) of the homicide arrests in 2019; CSP
offenders are also disproportionately impacted as victims of homicides in the District, accounting
for approximately fifteen percent (15%) of the 2019 homicide victims. These homicide victims and
suspects, as well as those CSP offenders arrested for other incidents of serious violence or firearms
are more likely to be assessed and supervised at the highest risk levels. CSP is actively addressing
this critical public safety issue by focusing our resources on our highest-risk offenders with the
intent of further reducing all types of serious violence within the District and the participation or
victimization of CSP offenders in those crimes. To that end, CSP is improving our offender risk and
needs assessments and interventions. CSP has created HISTs and implemented the RET and
Compliance Monitoring and Intelligence Center initiatives to immediately address non-compliant
activities and share data on high-risk offenders. CSP is partnering with D.C. MPD to perform
night/weekend supervision activities in high-crime areas. CSOSA is also collaborating with the
U.S. Marshals Service and other federal and local law enforcement agencies to locate offenders
with outstanding arrest warrants. As a result of this collaborative warrant initiative that began in the
first quarter of FY 2020, the number of offenders with outstanding warrants has been reduced by
more than 10 percent thus far.
6 Serious, violent incidents include homicide, aggravated assault, sexual assault, assault with a dangerous weapon, assault with intent
to kill, carjacking and robbery. Incidents counted are those that occurred during the year, even if the arrest was not made until after
the end of the year.
9CSP FY 2019 Total Supervised Population Profile:
FY 2019 TOTAL SUPERVISED
FY 2019 ENTRIES FY 2019 EXITS
POPULATION
Total: 5,372 Total: 14,830 Total: 6,509
209 Parole Supervised 14,830 unique offenders 288 Parole
988 Supervised Release over the course of the fiscal year and 1,276 Supervised Release
3,880 Probation approximately 9,500 offenders on any 4,500 Probation
185 DSA given day 218 DSA
110 CPO 227 CPO
Characteristics at intake Characteristics under supervision Supervision outcomes
• 22 percent had previously been • Approximately 45 percent of • 66 percent of cases closed
under CSOSA supervision at offenders assessed and successfully
some point within the last three supervised by CSP at the highest • 92 percent of offenders under
years risk levels¹ supervision in FY 2019 were not
• 41 percent were identified as • 18 percent aged 25 and under revoked to incarceration
having anti-social attitudes and • 15 percent female
temperament² • 24 percent of offenders were
• 31 percent were identified as rearrested while under
having an immediate substance supervision
use need and 83 percent self- • 2 percent (290) of supervised
reported having a history of using offenders were rearrested for
illicit substances² incidents of serious, violent
• 25 percent lacked prosocial crime in the District of
leisure activities Columbia3
• 54 percent were unemployed • 51 percent of the drug tested
• 29 percent had less than a high population4 tested positive for
school education illicit substances (excluding
• 8 percent resided in unstable alcohol)
conditions4 • Community Supervision
• 30 percent were identified as Officers (CSOs) issued Alleged
having mental health needs² Violation Reports to the
• 63 percent self-reported having releasing authority for 29
children; 41 percent of those with percent of supervised offenders
dependent-age children reported
being the primary caretaker of
those children²
¹ CSOSA assesses the risk to public safety posed by offenders during supervision at intake and throughout the term of supervision using various
assessment tools. Risk assessments are not required for misdemeanants residing outside of D.C. who are supervised primarily by mail, or for
offenders who are in monitored or warrant status.
² Reported estimates are based on offender entrants for whom an assessment was completed. Data reflect assessments completed closest to when the
offender began supervision.
³ Serious, violent incidents include homicide, aggravated assault, sexual assault, assault with a dangerous weapon, assault with intent to kill,
carjacking and robbery. Incidents counted are those that occurred during the year, even if the arrest was not made until after the end of the year.
4
Includes all offenders in active status during a reporting month who were supervised at the medium, maximum or intensive level.
10FY 2021: CSP Budget Request
The FY 2021 Budget Request for CSP is $180,973,000, a net decrease of $92,000 or 0.05 percent
below the FY 2020 Enacted Budget.
Court Services and Offender Supervision Agency
Community Supervision Program
Total
Annual Three-Year Appropriation
Amount Amount Amount
FTE $(000) $(000) $(000)
FY 2017 Enacted Budget 877 182,721 - 182,721
FY 2018 Enacted Budget 835 180,840 - 180,840
FY 2019 Enacted Budget 825 177,247 5,919 183,166
1
FY 2020 Enacted Budget 795 177,247 3,818 181,065
Changes to Base:
FY 2020 Non-Recurring Relocation Initiative - - (1,567) (1,567)
FY 2020 Non-Recurring Relocation Initiative - - (2,251) (2,251)
FY 2021 Pay Raise - 1,457 - 1,457
FY 2021 Employee Awards - 795 - 795
FY 2021 Employee Retirement Contributions - 1,474 - 1,474
FY 2021 Non-Payroll Inflation - - - -
Sub-Total, Changes to Base - 3,726 (3,818) (92)
FY 2021 BASE 795 180,973 - 180,973
Requested Program Changes:
NA - - - -
Sub-Total, Requested Program Changes - - - -
FY 2021 President's Budget 795 180,973 - 180,973
Increase (Decrease) versus FY 2020 Enacted - 3,726 (3,818) (92)
Percent Increase (Decrease) versus FY 2020 Enacted: 0.00% 2.10% -100.00% -0.05%
1
CSP’s FY 2020 Enacted Budget includes $1,567,000 in Three-Year (FY 2020-2022) funding for costs associated with a
replacement lease for CSOSA’s headquarters, field offices and related facilities and $2,251,000 in Three-Year (FY 2020-2022)
funding for a replacement lease for our 910 Rhode Island Avenue, NE, field unit. This funding does not recur in FY 2021.
11FY 2021 Changes to Base:
1. Non-Recurring FY 2020 Resources -$1,567,000 0 positions 0 FTE
The FY 2020 Enacted Budget contains $1,567,000 in Three Year (FY 2020-2022) funding as the
second installment of resources to support space acquisition and planning for a portion of expiring
CSP leases identified in Prospectus Number PDC-12-WA19. This funding does not recur in FY
2021. This funding will be used in conjunction with Three Year (FY 2019-2021) funding contained
in FY 2019 Enacted budget ($5,919,000) to support CSP’s relocation of our Headquarters locations
at 601 and 633 Indiana Avenue, NW.
2. Non-Recurring FY 2020 Resources -$2,251,000 0 positions 0 FTE
The FY 2020 Enacted Budget contains $2,251,000 in Three Year (FY 2020-2022) funding to
support space acquisition and planning for CSP’s expiring lease at our 910 Rhode Island Avenue,
NE, supervision field office. This funding does not recur in FY 2021.
3. FY 2021 Pay Raise Increase $1,457,000 0 positions 0 FTE
The FY 2021 PB includes $1,457,000 to support FY 2021 (October 2020 – September 2021) payroll
cost increases associated with the actual 3.52 percent 2020 civilian pay raise plus an estimated 1.0
percent 2021 civilian pay raise.
4. FY 2021 Employee Awards Increase $795,000 0 positions 0 FTE
The FY 2021 PB includes $795,000 to support an increase in FY 2021 employee awards to enable
the agency to strategically plan incentive awards, bonuses, recruitment, and retention allowances
toward rewarding high-performing employees and those with critical skill sets.
5. FY 2021 Employee Retirement Increase $1,474,000 0 positions 0 FTE
The FY 2021 PB includes $1,474,000 to support FY 2021 increases in agency contributions to
employee Federal Employees Retirement System (FERS) retirement accounts effective FY 2021.
6. FY 2021 Non-Pay Inflationary Increases $0 0 positions 0 FTE
CSP’s FY 2021 budget request does not contain resources for projected FY 2021 cost increases to
non-personnel cost categories, including rents, supplies, materials, equipment, utilities, and
contracts with the private sector. CSP does not project increases in net Non-Pay Inflationary Cost
increases, such as planned FY 2021 rents, primarily due to our efforts to reduce our occupancy
footprint. Similarly, CSP plans to absorb the costs associated with proposed expanded drug testing
(e.g., fentanyl, other opioids) within FY 2021 Base funding.
12CSP Program Effectiveness
CSP is making a lasting contribution to the District of Columbia community by improving public
safety and enabling offenders to become productive members of society.
CSP has established one outcome indicator and one outcome-oriented performance goal
related to improving public safety:
Outcome indicator: Reducing recidivism among the supervised population
CSP currently measures recidivism through revocations to incarceration following a new
conviction and/or for violating release conditions.
Outcome-oriented performance goal: Successful completion of supervision
In FY 2012, CSP updated its definition of successful completion of supervision to align with
how releasing authorities define successful completion and to more precisely classify all
offenders as “successful,” “unsuccessful,” or “other.” The old definition of successful
supervision completion only included offenders whose supervision periods were terminated
or expired without revocation by the releasing authority. Successful completion of
supervision has now been expanded to include those offenders discharged from supervision
whose supervision periods expired satisfactorily, expired unsatisfactorily, terminated
satisfactorily, or terminated unsatisfactorily, or whose case(s) were returned to the sending
jurisdiction in compliance or transferred to U.S. Probation. Unsuccessful completion of
supervision includes cases closed with a status of revoked to incarceration, revoked
unsatisfactorily, deported, returned to the sending jurisdiction out of compliance, or pending
USPC institutional hearing. Cases that closed for administrative reasons or death are now
classified as Other, neither successful or unsuccessful.
CSP has established six other indicators related to offender compliance on supervision and
reintegration:
1) Rearrest,
2) Technical violations,
3) Drug use,
4) Employment/job retention,
5) Education, and
6) Housing
We believe that, by focusing our case management strategies and interventions on these six areas, more
offenders will complete supervision successfully, resulting in improved public safety in the District of
Columbia. The following sections discuss progress toward each indicator.
13OUTCOME INDICATOR:
Recidivism
Generally speaking, recidivism refers to an offender’s relapse or return to criminal behavior after
receiving some type of sanction (i.e., incarceration, probation, etc.). Although the concept is
relatively easy to understand, measuring recidivism can be challenging. Because criminal activity
may go undetected, official records are often incomplete representations of an offender’s
involvement in criminal activity. Therefore, it may be difficult to identify exactly if or when an
offender recidivates. Because criminal justice agencies are generally limited to official records
when studying recidivism, they often rely on using a variety of constructs in order to obtain a
complete picture of an offender’s criminal activity. While common measurements include rearrest,
reconviction and reincarceration, there is no standard definition of recidivism. Furthermore, there is
no broadly accepted length of follow-up to track recidivism. Recidivism rates will vary for the same
group depending on how it is defined and the follow-up period used. In addition, although failure
rates serve as the foundation of recidivism research, it is essential to move beyond them to improve
recidivism as a performance measure. Constructs such as desistance (cessation of criminal activity),
crime severity, and behavior changes should also be included as indicators of success. 7
Traditionally, CSP has measured recidivism through revocations to incarceration following a new
conviction and/or for violating release conditions. In 2019, CSP estimated the probability that
offenders entering supervision during FYs 2011-2016 would recidivate within one, two, and three
years of beginning supervision. 8 The three-year estimates on both recidivism measures—revocation
for new offense and revocation for technical violation—are highest for offenders under supervised
release. Within the first three years of supervision, approximately half of supervised releasees have
their supervision terminated unsuccessfully, one-third are revoked for technical violations, and one-
fourth are revoked for new offenses. Parolees are least likely to be revoked for new offenses, while
probationers are least likely to be revoked for technical violations. Contrasting persons beginning
supervision during FY 2015 with those beginning during FY 2016, we find that the FY 2016 cohort
of supervised releasees were less often revoked on technical violations and equally likely to be
revoked for new offense. Among parolees, both categories of revocation saw decreases in the FY
2016 cohort as compared with the FY 2015 entrants. Among probationers, revocation for technical
violations decreased, and revocation for new offenses increased.
7 King, R. & Elderbroom, B. (2014). Improving Recidivism as a Performance Measure. Washington, D.C.: Urban Institute.
8 For this report, CSP identified cohorts of offenders entering supervision during each fiscal year and estimated their probability of
recidivating within three years of beginning supervision. This methodology differs from measures of revocation to incarceration
and successful completion of supervision. Estimates of revocations to incarceration (page 17-18) are based on the actual number of
unique offenders revoked during the fiscal year out of all offenders supervised during the year. Estimates of successful completions
of supervision (page 23) are based on the actual number of cases (not offenders) that closed successfully during the fiscal year out
of the total number of cases that closed during the year. Because the unit of analysis differs between this study and the two other
measures, estimates generated by each should not be compared.
14Percentage of Entrants Expected to Recidivate by Supervision Type, Failure (Recidivism)
Type and Time From Supervision Start, FYs 2011–20161
Supervision Type Recidivism Type Years 2011 2012 2013 2014 2015 20161
N=8,813 N=8,967 N=7,896 N=7,066 N=6,461 N=6,248
Parole Revoked (Violation) 1 2 4 3 2 4 4
2 9 15 11 11 14 16
3 16 20 17 17 22 20
Revoked (New Offense) 1 3 6 6 3 3 1
2 15 15 14 8 8 4
3 22 20 21 12 12 9
Supervised Release Revoked (Violation) 1 7 7 7 8 9 10
2 14 19 19 21 23 23
3 21 28 29 32 36 33
Revoked (New Offense) 1 9 10 10 10 7 8
2 23 25 23 19 17 20
3 33 33 30 24 25 26
Probation Revoked (Violation) 1 9 9 9 7 7 8
2 15 16 14 12 12 14
3 18 19 17 14 16 14
Revoked (New Offense) 1 9 7 6 5 5 7
2 14 14 12 9 8 11
3 16 16 12 10 10 13
1
This analysis considers a three year follow-up period. FY 2016 is the most recent cohort analyzed.
During its most recent strategic planning period, however, CSP recognized the importance of
developing measures to detect smaller, incremental changes in offender behavior that may be
indicative of recidivism. CSP began developing such measures to include monitoring of changes in
risk and needs scores, changes in the duration between arrests, fluctuations in offense severity and
specialization, and changes in the frequency and variety of illicit drug use. Particularly for high-risk
offenders, positive changes in these indicators can all signify real progress.
CSP plans to report on these new measures in the upcoming performance year.
Revocations to Incarceration:
CSP tracks the percentage of its total supervised population revoked to incarceration each year.
Revocation to incarceration of CSP offenders results from multiple factors and is an outcome of a
complex supervision process that seeks to balance public safety with supporting offender
reintegration. Most offenders return to prison after a series of events demonstrate their inability to
maintain compliant behavior on supervision. Non-compliance may involve one or more arrests,
conviction for a new offense, repeated technical violations of release conditions (such as positive
drug tests or missed office appointments), or a combination of arrest and technical violations. CSP
strives to decrease revocations to incarceration by continuing to develop, implement, and evaluate
effective supervision programs and techniques.
After a careful review, CSP updated its reporting methodology for revocations in FY 2012. Prior to
FY 2012, CSP counted the number of offenders re-incarcerated based on the offender’s
supervision status at the end of the respective fiscal year. As such, offenders who were revoked to
incarceration early in the fiscal year, but then began a new supervision period with CSP before the
end of the year (and whose last supervision status did not reflect a revoked status), were not
included in the count of incarcerated offenders. In FY 2012, CSP modified its measurement to
ensure that all revocations were captured for reporting, including those for offenders who may
15have begun a new supervision period before the end of the fiscal year. This method was applied to
previous fiscal years, and data in the table below reflect the updated methodology for all years,
which more accurately represents Agency activities and performance.
Data show that, although there has been some fluctuation throughout the years in revocations by
supervision type, the overall percentage of CSP’s TSP revoked to incarceration has been steadily
decreasing since FY 2006. From FYs 2006 to 2010, overall revocations decreased from nearly 14
percent to just over 10 percent. This decrease was driven primarily by parole and supervised release
cases supervised on behalf of the U.S. Parole Commission. Revocations of parolees decreased by
nearly 12 percentage points and revocations of supervised release offenders decreased by almost
eight percentage points during that time. From FY 2011 to FY 2015, overall revocations decreased
by two additional percentage points, which was primarily attributed to decreases in revocations of
probationers which decreased steadily over that time. There were slight increases in revocation rates
among all supervision types in FY 2016 and more moderate increases the following year, resulting
in an overall revocation rate that was just under 10 percent in FY 2017. Since FY 2017, the overall
revocation rate has decreased, with roughly 9 percent of offenders under supervision in FY 2019
revoked to incarceration. Again, this is primarily attributed to decreasing revocations among
probationers. The revocation rate for probationers decreased over one percentage point over the past
two years while revocations of offenders on supervised release (those who were incarcerated for a
portion of their sentence and then serve the remainder in the community) increased more than two
percentage points during that time.
CSP Total Supervised Population Revoked to Incarceration¹, by Supervision Type, FYs 2006–2019
Parole Supervised Release Probation2 Total
% % % % % % % %
N N N N
FY Change Revoked Change Revoked Change Revoked Change Revoked
2006 5,852 17.2 2,508 18.4 16,345 11.8 24,705 13.8
2007 5,053 -13.7 13.3 3,444 37.3 18.0 16,181 -1.0 11.1 24,678 -0.1 12.5
2008 4,465 -11.6 9.9 4,116 19.5 15.3 16,130 -0.3 10.4 24,711 0.1 11.1
2009 4,177 -6.5 8.4 4,591 11.5 13.8 16,018 -0.7 11.2 24,786 0.3 11.2
2010 4,009 -4.0 5.5 4,943 7.7 10.8 16,257 1.5 11.4 25,209 1.7 10.3
2011 3,413 -14.9 7.2 5,213 5.5 11.6 16,185 -0.4 10.6 24,811 -1.6 10.4
2012 3,060 -10.3 5.5 5,350 2.6 11.1 16,087 -0.6 10.2 24,497 -1.3 9.8
2013 2,716 -11.2 6.0 5,338 -0.2 11.5 15,011 -6.7 9.9 23,065 -5.8 9.8
2014 2,340 -13.8 6.1 5,166 -3.2 12.7 13,357 -11.0 8.7 20,863 -9.5 9.4
2015 1,934 -17.4 4.6 4,857 -6.0 12.1 11,636 -12.9 7.0 18,427 -11.7 8.1
2016 1,659 -14.2 4.8 4,394 -9.5 12.3 10,943 -6.0 7.6 16,996 -7.8 8.5
2017 1,448 -12.7 6.0 3,932 -10.5 14.1 11,027 0.8 8.7 16,407 -3.5 9.8
2018 1,266 -12.6 5.4 3,563 -9.4 15.9 10,905 -1.1 8.0 15,734 -4.1 9.6
2019 1,173 -7.3 5.5 3,236 -9.2 16.5 10,421 -4.4 7.5 14,830 -5.7 9.3
¹ Revocation (incarceration) data excludes a small number of cases that were closed and revoked but the offender was not incarcerated.
2
Probation also includes Civil Protection Order (CPO) and Deferred Sentencing Agreement (DSA) cases.
16% Revoked
20%
Supv Release
10%
TSP
Probation
Parole
0%
2006 2007 2008 2009 2010 2011 2012 2013 2014 2015 2016 2017 2018 2019
Fiscal Year
Although CSP strives to reduce recidivism and address offenders’ criminogenic needs while they
are in the community, it is equally important for us to recognize and respond to offender
noncompliance on supervision to protect public safety. CSP views its ability to stabilize the
revocation rate among re-entrants (e.g., parole and supervised release) over the past year while
continuing to mitigate threats to public safety as a significant strategic accomplishment. We believe
our evidence-based approach of focusing resources on the highest-risk offenders contributes
significantly to reducing recidivism. It will be important moving forward to develop other measures
of recidivism to show the impact of our strategies.
Compared to the overall supervised population, offenders revoked to incarceration during FY 2019
were characterized by the following:
• More likely to be assessed and supervised by CSP at the highest risk levels (73.4 percent
compared to 45.2 percent of the total supervised population);
• More likely to have unstable housing situations (20.1 percent compared to 9.9 percent for
the total supervised population);
• Have lower educational attainment (44.5 percent with less than a high school education
compared to 28.6 percent of the total supervised population); and
• If employable, less likely to be employed (17.4 percent compared to 52.3 percent for the
total supervised population).
Both females and parolees were slightly under-represented in the FY 2019 revoked population. Women
made up 15.3 percent of the overall supervision population during FY 2019, but only 12.0 percent of
offenders revoked to incarceration were female. Additionally, parolees constituted 7.9 percent of the FY
2019 supervised population, but only 4.7 percent of offenders revoked were on parole.
Alleged Violation Reports:
If sanctions do not restore offender compliance, or the non-compliant behavior escalates, CSP
informs the releasing authority (Superior Court for the District of Columbia or the U.S. Parole
Commission) by filing an Alleged Violation Report (AVR). An AVR can result in incarceration or
the imposition of additional supervision special conditions. CSP prepares and electronically submits
17an AVR to the Superior Court for the District of Columbia for any new arrest of a probationer.
Effective FY 2019, the U.S. Parole Commission requested that an AVR be submitted only in cases
where CSP is seeking revocation or a modification of release conditions for parole/supervised
release cases.
Each releasing authority handles AVRs for new arrests differently. For probation cases, the
Superior Court for the District of Columbia generally waits for a conviction before revoking an
offender who has been rearrested, where the re-arrest is the only violation of probation. For
parole/supervised release cases in which the U.S. Parole Commission issues a warrant, it will first
hold a preliminary hearing to determine probable cause. If probable cause is determined, the U.S.
Parole Commission then will hold a revocation hearing at which time the offender can be revoked
without having been convicted on a new charge.
AVRs submitted for new arrests most often result in revocation if the offender has a history of non-
compliance and if the rearrest is of a serious nature or similar to the offense for which release was
granted. Many AVRs, however, are submitted for technical violations and generally do not result in
revocation. Once a technical violation issue(s) is resolved by the releasing authority without
revocation, the offender continues under CSP supervision, often with additional compliance
instructions or added special conditions from the releasing authority.
In FY 2019, CSP developed and filed a total of 6,851 AVRs for offenders under supervision. Nearly
two-thirds of AVRs were filed for probationers (to include offenders with DSAs and individuals
with CPOs), 30 percent for supervised releasees, and the remainder for parolees. Approximately 60
percent of AVRs each year are filed for rearrests, 20 percent are filed for offenders failing to report
for supervision appointments, and the remaining 20 percent for other technical violations.
AVR Filed by CSP, by Supervision Type, FYs 2015–2019
Supervised Probation1 Total
Fiscal Year Parole
Release
2015 557 2,561 3,109 6,227
2016 473 2,546 3,529 6,548
2017 449 2,602 4,291 7,342
2018 450 2,343 4,706 7,499
20192 366 2,068 4,417 6,851
¹ Probation also includes offenders with Civil Protection Orders (CPOs) and Deferred Sentencing Agreements (DSAs).
2An AVR is filed with the Superior Court for the District of Columbia in response to any new arrest in every probation case.
Effective FY 2019, for supervised release and parole cases, an AVR is filed with the U.S. Parole Commission only in response to any
new arrest where the Agency is requesting revocation or modification of release conditions.
In FY 2019, just under 30 percent of the TSP had at least one AVR filed with the releasing
authority. Slight decreases in the percentage of the population with more than one AVR filed in FY
2019 versus FY 2018 were realized across all supervision types. However, the percent of the TSP
for whom at least one AVR was filed in FY 2019 is considerably greater than FY 2015.
18CSP Offenders For Whom At Least One AVR Was Filed by Supervision Type, FYs 2015–2019
Parole Supervised Release Probation¹ Total
N 1+AVR % N 1+AVR % N 1+AVR % N 1+AVR %
2015 1,934 410 21.2 4,857 1,709 35.2 11,636 2,314 19.9 18,427 4,433 24.0
2016 1,659 346 20.9 4,394 1,691 38.5 10,943 2,508 22.9 16,996 4,545 26.7
2017 1,448 327 22.6 3,932 1,583 40.3 11,027 2,853 25.9 16,407 4,763 29.0
2018 1,266 288 22.7 3,563 1,400 39.3 10,905 3,084 28.3 15,734 4,772 30.3
2019 1,173 265 22.6 3,236 1,243 38.4 10,421 2,850 27.3 14,830 4,358 29.4
¹ Probation also includes offenders with Civil Protection Orders (CPOs) and Deferred Sentencing Agreements (DSAs).
CSP’s Office of Research and Evaluation reviewed offenders entering CSP supervision during FYs
2014 – 2018 and determined the percentage of offenders for whom AVRs were sent to the releasing
authority within one year of beginning supervision. For those with AVRs filed, the number of days that
elapsed from the beginning of the supervision period until the first AVR was issued was also
determined. In FY 2014, roughly two out of five new offenders had at least one AVR filed within one
year and, on average, their first AVR was filed roughly five months after starting supervision. The
percentage of entrants with AVRs filed during the first year of supervision increased from FY 2014 to
FY 2017, with nearly half of FY 2017 and FY 2018 entrants having at least one AVR filed within the
first year of supervision. Additionally, the amount of time from when an offender begins supervision to
when they accrue their first AVR has been decreasing. These data suggest that the beginning of
supervision may be a particularly challenging time for new offenders and CSOs must stress the
importance of complying with release conditions early in the supervision period.
AVRs Issued to Offender Entrants Within One Year of Entry to CSP Supervision, FYs 2014–2018
Offender Entrants to CSP Percentage of Entrants with Average Days to First AVR
Fiscal Year
Supervision AVRs Issued w/in One Year LL Mean UL
2014 7,724 37.5 145 148 152
2015 6,461 39.2 143 147 151
2016 6,248 44.1 135 138 142
2017 6,162 49.3 126 129 133
2018 5,886 48.0 124 128 132
19OUTCOME-ORIENTED PERFORMANCE GOAL:
Successful Completion of Supervision
Cases that close successfully are defined by CSP as those that expire/terminate satisfactorily,
expire/terminate unsatisfactorily, are returned to their sending jurisdiction in compliance, or are
transferred to U.S. Probation. Cases that close unsuccessfully are those that are revoked to
incarceration, revoked unsatisfactorily, returned to their sending jurisdiction out of compliance, are
pending U.S. Parole Commission institutional hearing, or the offender has been deported. Cases
that close for administrative reasons or death are neither successful or unsuccessful, and classified
as “Other.” These definitions are consistent with how the Superior Court for the District of
Columbia and the U.S. Parole Commission define successful and unsuccessful cases.
Following a notable decrease in the percentage of successful completions from FY 2015 to FY
2017, our successful completion rate has steadily increased over the past two years. In FY 2019, a
total of 7,984 CSP supervision cases closed: 5,997 probation/CPO/DSA cases, 1,563 supervised
release cases, and 424 parole cases. The table below shows that 5,234 (65.7 percent) of these case
closures represented successful completions of supervision and 2,359 (29.5 percent) were
unsuccessful. We believe our evidence-based strategy of focusing resources on the highest-risk
offenders over the past several years played a significant role in nearly two-thirds of supervision
cases closing in FY 2019. Five percent of cases that closed in FY 2019 were closed administratively
or due to death.
Similar to previous years, a higher percentage of probation cases completed successfully (73.3
percent) compared to parole/supervised release cases (42.3 percent). In FYs 2018 and 2019, we
realized an increase in the percentage of probation cases closing successfully, while the percentage
of successful parole and supervised release cases decreased. This demonstrates a need for us to
continue focusing resources on those offenders released from incarceration that demonstrate higher
risk and higher needs.
Supervision Completions¹ by Supervision Type, FYs 2015 – 2019
Parole Supervised Release Probation2 Total
% % % % % % % %
N Succ Unsucc N Succ Unsucc N Succ Unsucc N Succ Unsucc
2015 727 57.5 30.3 1,972 44.9 48.4 7,009 75.7 20.4 9,708 68.1 26.9
2016 587 61.2 28.6 1,849 44.7 47.1 6,125 72.6 23.2 8,561 65.8 28.7
2017 577 57.7 29.1 1,763 42.6 49.5 6,227 69.6 26.6 8,567 63.2 31.5
2018 449 57.7 27.4 1,624 39.3 52.4 5,883 71.6 25.4 7,956 64.3 31.0
2019 424 54.0 31.8 1,563 39.2 51.8 5,997 73.3 23.6 7,984 65.7 29.5
¹ Data reflects supervision cases, not offenders supervised. Within-group percentages do not equal 100 due to cases closing administratively or due to death.
2
Probation also includes Civil Protection Order (CPO) and Deferred Sentencing Agreement (DSA) cases.
20PERFORMANCE INDICATORS:
Rearrest
Rearrest is a commonly used indicator of criminal activity among offenders on supervision, though
it does not in itself constitute recidivism (defined as a return to incarceration). Until FY 2008, CSP
captured data only for arrests occurring in the District of Columbia. Beginning in FY 2009,
increased data sharing between jurisdictions allowed CSP also to track arrests of supervised
offenders in Maryland and Virginia. Additionally, in FY 2012, improved charge data from the D.C.
MPD allowed CSP to distinguish between arrests made in D.C. for new crimes, as compared to
arrests made in response to parole or probation technical violations. The acquisition of these data
allows for more comprehensive reporting of offender rearrests.
As of September 30, 2019, nearly twenty-four percent (23.9%) of CSP’s FY 2019 TSP had been
rearrested in D.C., MD, or VA (all charges considered), while under supervision during the year, which is
one percentage point lower than the FY 2018 rearrest rate. Although decreases in rearrests were realized
across all supervision types, parolees and probationers demonstrated greater decreases than those on
supervised release.
When only D.C. arrests are considered, data reveal larger decreases in the rearrest rates of CSOSA
offenders from FY 2018 to FY 2019, suggesting that offenders may be committing more crime outside
the District than in previous years. In addition, while 21.7 percent of supervised offenders were rearrested
in the District in FY 2019 when all charges were considered, this percentage dropped to 16.4 percent
when arrests for parole/probation violations were excluded. These data indicate that a nontrivial number
of supervised offenders are rearrested each year in the District due to violations of their release
conditions, rather than for the commission of a new crime.
Data show that offenders on supervised release are consistently rearrested at a higher rate than parolees
and probationers. This trend continued into FY 2019 with just under one-third of supervised releasees
rearrested as of September 30, 2019 (D.C., MD, and VA; all charges considered). While rearrests in D.C.
decreased for offenders of all supervision types, the overall rearrest rate, when MD and VA arrests are
considered, remained fairly stable. This suggests that offenders may be committing more crimes outside
of the District than in previous years. When examining the rearrests of offenders in D.C. for new charges,
however, arrest rates decreased among all supervision groups. This suggests that while offenders may be
continuing to violate release conditions, they may not be committing as much new crime.
Percentage of Total Supervised Population Rearrested,1 FYs 2015–2019
FY 2015 FY 2016 FY 2017 FY 2018 FY 2019
Probation2
DC Arrests 15.7% 18.5% 21.6% 21.2% 19.5%
DC Arrests (new charges)3 12.0% 14.7% 17.7% 16.9% 15.4%
DC/MD/VA Arrests 17.6% 20.6% 23.3% 22.7% 21.8%
Parole
DC Arrests 16.4% 18.6% 18.3% 19.7% 17.3%
DC Arrests (new charges3 13.1% 14.1% 14.3% 15.2% 12.8%
DC/MD/VA Arrests 17.7% 19.7% 19.4% 20.9% 19.0%
Supervised Release
DC Arrests 25.6% 31.2% 31.3% 31.2% 30.5%
DC Arrests (new charges)3 19.4% 24.3% 24.1% 23.6% 20.7%
DC/MD/VA Arrests 27.9% 33.1% 32.5% 32.5% 32.4%
21You can also read