Commercial Market Insights - January 2022 National Association of REALTORS Research Group - National Association of ...

Page created by Ron Lopez
 
CONTINUE READING
Commercial Market Insights - January 2022 National Association of REALTORS Research Group - National Association of ...
Commercial Market
Insights
January 2022
National Association of REALTORS®
Research Group
Commercial Market Insights - January 2022 National Association of REALTORS Research Group - National Association of ...
Summary
The recovery in the commercial real estate market that started in the second half of
2021 is continuing into the first month of 2022. All core commercial sectors
―multifamily, office, industrial, and retail ―experienced net positive absorption during
last quarter of 2021 through January. As such, rents continue to rise and vacancy rates
continue to trending downwards except in the office market.

In the multifamily market, the asking rents rose at an average year-over-year rate of
11.3% in the past 12 months as of January . Asking rents for industrial properties also
continued to rise steeply at 8.9%. Asking rents for retail properties were also up over
the past 12 months by 3.5% on average. In the office property market, asking rents are
up on average by 1% year-over-year in the past 12 months, weighed down by declining
rents in a few markets in major metro areas of New York, Washington DC, and San
Francisco. However, office rents are rising in nearly all markets.

The office property market continues to grapple with an elevated vacancy rate of 12.4%.
But in the multifamily, industrial, and retail property market, vacancy rates are
hovering at below 5%, with the lowest vacancy rate in the industrial market at 4.4%. In
the hotel sector, the occupancy rate rose to 58% in December 2021, up from 42% one
year ago.

While demand for multifamily units is strong, absorption appears to have started to
wane. In the 12 months ended January 26, net absorption was at 600,251 units, a slower
pace compared to the 12-month absorption of 709,000. Demand could be waning due
to the sharp uptick in asking rents. Additionally, renters who left their apartments in
the wake of the pandemic have already moved back, while many workers are back to
the office. According to the US Census Bureau, just 19% of workers in
management/professional/administrative office support worked from home during
the work in December 2021, down from 54% in May 2020.

Developers continue to bet their dollars on the primary markets of New York,
Washington DC, Boston, Chicago, Los Angeles and San Francisco, given the
construction activity in these markets. However, construction activity across
multifamily, office, industrial, and retail markets is more intensely happening in the
metro areas of Florida, South Carolina, North Carolina, Georgia, Alabama, Texas,
Tennessee, Texas, and Arizona, Utah, Idaho, and Washington. Not a surprise as
employment is growing fast in these areas and given the net domestic migration in
many of these states.

This month’s issue also includes the results of NAR’s Quarterly Market Survey that asks
REALTORS® what they are observing in their markets relative to pre-pandemic
conditions. The 2021 Q4 survey reveals fewer tenants with missed rents, a majority of
companies offering hybrid work schedules, companies moving into smaller offices,
shorter term leases, investments in workplace sanitation, and more conversion of
vacant malls. Among the respondents, 63% reported that they are seeing more
companies leasing smaller offices, 57% reported they are seeing more short-term
leases of two years or less, and 58% reported they are seeing more conversions of
vacant retail malls for other uses.

Enjoy this month’s issue!
Commercial Market Insights - January 2022 National Association of REALTORS Research Group - National Association of ...
Economic Conditions
Tightening labor market and rising inflation

 18.8 million jobs created since
                                                                                          18.8 Million Payroll Jobs Created With
 May 2020                                                                                  3.6 Million Lost Jobs to Recover as of
                                                                                                       December 2021
 As of December 2021, the economy has
 created 18.8 million net new jobs, or 84% of                                      155                                                               152.5
                                                                                  150                                                                                                                                             149.0

                                                                       Millions
 the 22.4 million jobs lost during March and                                      145
                                                                                  140
 April 2020. There are nearly 3.6 million                                          135
 nonfarm payroll jobs still to be recovered.                                      130
                                                                                   125                                                               130.2
                                                                                  120
                                                                                    115
 As of the end of December, there were

                                                                                          Mar/2019

                                                                                          Mar/2020

                                                                                          Mar/2021
                                                                                           Jan/2019

                                                                                          May/2019
                                                                                            Jul/2019

                                                                                          Nov/2019
                                                                                          Jan/2020

                                                                                          May/2020

                                                                                           Jan/2021
                                                                                           Jul/2020

                                                                                          May/2021
                                                                                          Nov/2020

                                                                                            Jul/2021

                                                                                          Nov/2021
                                                                                          Sep/2019

                                                                                          Sep/2020

                                                                                           Sep/2021
 about 5 million more job openings than job
 seekers, or nearly 2 jobs openings per job
 seeker.

 With tightening labor market conditions,
 the average weekly wage rose 4.9% on a
 year-over-year basis in December 2021.                                              Nearly 2 Job Openings Per
                                                                                  Unemployed as of December 2021
                                                                            25000          (in thousands)
                                                                           20000
          Job Openings vs. Number of                                         15000
        Unemployed as of December 2021
                (in thousands)                                               10000                                                                                                                                                8997
                                                                                  5000                                                                                                                                            4739
       Professional and                      700                                          0
       business services                                        1678
                                                                                              Jan/2019
                                                                                                         Apr/2019
                                                                                                                    Jul/2019
                                                                                                                               Oct/2019
                                                                                                                                          Jan/2020
                                                                                                                                                     Apr/2020

                                                                                                                                                                           Oct/2020
                                                                                                                                                                                      Jan/2021
                                                                                                                                                                Jul/2020

                                                                                                                                                                                                 Apr/2021
                                                                                                                                                                                                            Jul/2021
                                                                                                                                                                                                                       Oct/2021
 Leisure and hospitality                           988
                                                         1341
   Wholesale and retail                            1,019
         trade                                         1,268                                               Job openings                                                       Unemployed

          Manufacturing                    478
                                                 818
     Transportation and                    455
          utilities                          597
                                                                                               Year-over-Year Percent Change in
      Financial activities           196                                                            Average Weekly Wages
                                           509
                                                                           8.0
                                        469                                7.0
            Construction              307                                  6.0
                                                                           5.0                                                                                                                                                     4.8
             Information         99                                        4.0
                                  151                                      3.0
                                                                           2.0
                                                                           1.0
              Unemployed             Job Openings
                                                                           0.0
                                                                                     Mar/2019

                                                                                     Mar/2020

                                                                                     Mar/2021
                                                                                      Jan/2019

                                                                                     May/2019

                                                                                     Jan/2020

                                                                                      Jan/2021
                                                                                       Jul/2019

                                                                                     Nov/2019

                                                                                     May/2020
                                                                                      Jul/2020

                                                                                     May/2021
                                                                                     Nov/2020

                                                                                       Jul/2021

                                                                                     Nov/2021
                                                                                     Sep/2019

                                                                                     Sep/2020

                                                                                      Sep/2021

  Source: BLS Establishment Survey
Commercial Market Insights - January 2022 National Association of REALTORS Research Group - National Association of ...
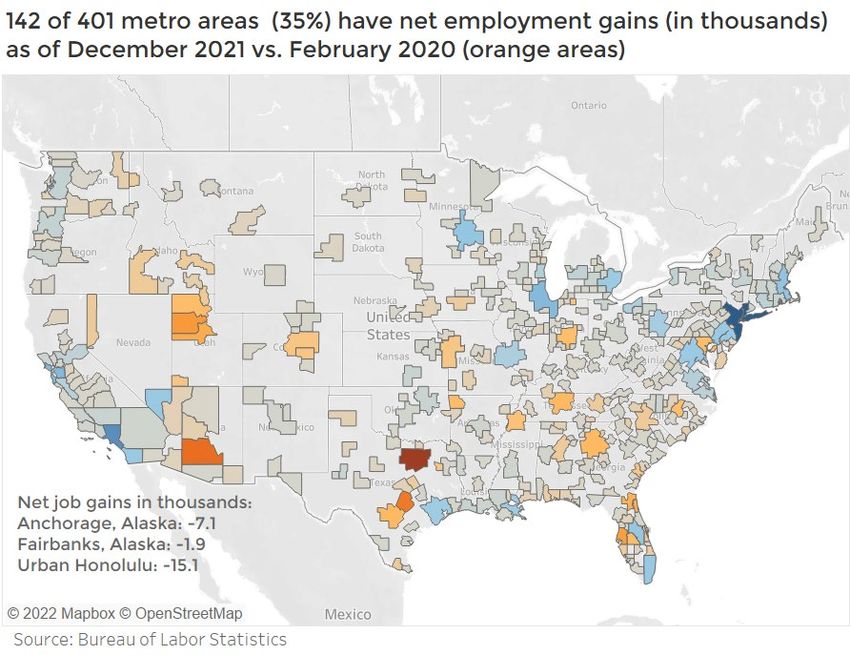
Economic Conditions
Tightening labor market and rising inflation

Six states and 35% of 401 metro areas have higher employment as of
December compared to February 2020
As of December, six states have more nonfarm employment compared to March 2020: Utah
(+4%), Idaho (+2.3%), Arizona (+1.1%), Montana (+0.1%), Texas (+1.2%), and Georgia (0.2%).

By metro area, 142 markets, or 35% of 401 markets, have surpassed the level of nonfarm
employment compared to February 2020. The job leaders are Salt Lake City, Tampa-St.
Petersburg-Clearwater, Provo-Orem, Jacksonville, San Antonio, Nashville, Atlanta, Kansas
City. Fayetteville, and Ogden.

The gateway metro areas of New York-Newark-Jersey City, Los Angeles-Long-Beach-
Anaheim, San Francisco-Oakland-Hayward, and Chicago-Naperville-Elgin have lost the
most jobs, each at over 100,000.
Commercial Market Insights - January 2022 National Association of REALTORS Research Group - National Association of ...
Economic Conditions
Tightening labor market and rising inflation

Fraction of workers working from                         Percent of employed 16 years old and
home declines to 11%                                      over who worked from home as of
                                                                    December 2021
Workers are returning to the office, with        60%
11.3% of employed workers 16 years old and       40%
over teleworking, down from 35.4% in May                                                                                                          19%
                                                 20%
2020. Among management, professional,             0%
                                                                                                                                                   11%
and related occupations, just 20.4% are

                                                         2019

                                                                                   Oct-20
                                                                 20-Jun

                                                                          Aug-20

                                                                                                     Feb-21

                                                                                                                       1-Jun

                                                                                                                                        Oct-21
                                                                                                              Apr-21

                                                                                                                               Aug-21
                                                                                            Dec-20

                                                                                                                                                 Dec-21
teleworking, down from 57.4% in May 2020.
As of November, 17.5 million people
teleworked, up from 8.9 million in 2019 who                     Total employed, 16 years and over
worked from home, but down from 48.7
                                                                Management/professional/offce-support
million in May 2020. With the rise in Delta
variant and Omicron cases, tech, finance,              Source: BLS COVID-19 Supplemental Survey
and media companies such as Apple®,
Alphabet®, Uber®, Lyft®, Blackstone, Carlyle,
CNN, and NBC, have announced delaying                    Inflation Rises to 7% in December 2021
their office re-entry schedules.                 8.0
                                                                                                                                                     7
                                                 6.0                                                                                                 5.5
                                                 4.0
Inflation accelerates to 7% in                   2.0

December                                         0.0
                                                       Mar/2019
                                                        Jan/2019

                                                       May/2019

                                                       Mar/2020

                                                       Mar/2021
                                                         Jul/2019

                                                       Nov/2019
                                                       Jan/2020

                                                       May/2020
                                                       Sep/2019

                                                        Jul/2020

                                                        Jan/2021
                                                       Nov/2020

                                                       May/2021
                                                       Sep/2020

                                                         Jul/2021

                                                       Nov/2021
                                                        Sep/2021
Inflation accelerated to 7% in December as
core inflation (inflation excluding food and
energy) also accelerated to 5.5%, indicating
                                                                     Headline inflation
inflation is becoming persistent. In its                             Inflation excluding food and energy…
January 26 meeting, the Federal Open
Market Committee stated it will end its asset      Source: US Bureau of Labor Statistics
purchases program in March and expects to
raise the federal funds rate target “soon”
which it kept at 0 to 0.25% in the January 26             30-Year Fixed Mortgage Rate and 10-
meeting to bring back inflation to 2%.                              Year T-Note Yield
                                                 5.00

10-year T-Note rises to 1.75%                    4.00
                                                                                                                                                  3.56
                                                 3.00
As of January 20, the 10-year T-note yield has   2.00                                                                                              1.75
increased to 1.75% while the 30-year fixed       1.00
mortgage rate was has increased to 3.56%.        0.00
                                                         23/Jul/2020W
                                                         03/Jan/2019W

                                                         03/Jun/2021W
                                                        05/Aug/2021W
                                                        07/Mar/2019W

                                                           11/Jul/2019W

                                                         14/Nov/2019W
                                                         16/Jan/2020W
                                                        19/Mar/2020W
                                                        21/May/2020W

                                                        09/Dec/2021W
                                                        09/May/2019W

                                                         12/Sep/2019W

                                                        24/Sep/2020W

                                                         28/Jan/2021W
                                                        26/Nov/2020W

                                                          01/Apr/2021W

                                                         07/Oct/2021W

Higher mortgage rates will make a home
purchase less affordable for buyers at the
margin, although the expectation of higher
mortgage rates in 2023 could spur buyers to
lock in at the current rates.
                                                                     30-Year Fixed Rate Mortgage
                                                                     10-Year Treasury Note Yield
                                                          Source: Freddie Mac, US Treasury
Commercial Market Insights - January 2022 National Association of REALTORS Research Group - National Association of ...
REALTOR® Quarterly Market
Survey: Improving rental conditions, smaller offices, shorter
leases, more investment to improve hygiene, more adaptive reuse
 Every quarter, the National Association of REALTORS® conducts a quarterly market survey
 of its members engaged in commercial real estate. The 2021 Q4 survey reveals fewer
 tenants with missed rents, majority of companies offering hybrid work schedules,
 companies moving into smaller offices, shorter term leases, investments in workplace
 sanitation, and more conversion of vacant malls, .

    Percent of REALTOR® respondents who              Percent of REALTOR® respondents
     reported "More" tenants with missed,           who reported "More" companies with
     late, or partial multifamily residential         hybrid/staggered work schedules
     rent payments compared to January                   compared to January 2020
                       2020
                                                         83%   85%
                                                                      76%    70%     71%
                 59%                                                                       65%
           54%                                     55%
    36%                42%    37%   33%      31%

       Percent of REALTOR® respondents               Percent of REALTOR® respondents
         who reported "More" companies             who reported "More" companies with
       leasing smaller offices compared to         2-year or less lease terms compared to
                  January 2020                                   January 2020
                                                         59%   63%
     71%               70%                                            57%    54%     56%   57%
                 69%                68%
                              65%
           62%                               63%
                                                   23%

       Percent of REALTOR® respondents              Percent of REALTOR® respondents
        who reported "More" companies               who reported "More" repurposing of
        making investments to improve                   vacant malls compared to
        workplace hygiene compared to                          January 2020
                  January 2020
                                                               53%                       58%
                                                         52%         49%    52%    53%
           76%   81%   76%
                              67%   67%      69%   37%
     48%
Commercial Market Insights - January 2022 National Association of REALTORS Research Group - National Association of ...
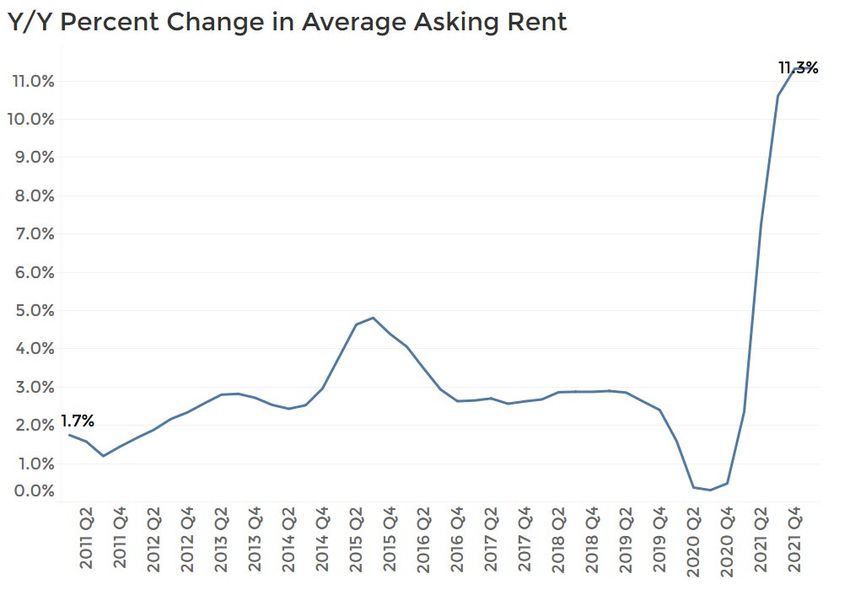
Commercial Market Overview
Rising occupancy and rent growth across all markets

  All commercial sectors experienced net positive absorption as of a three month period
  ending in January.

  In the multifamily apartment market, 76,170 units were absorbed on a net basis in the
  past three months as of January 26, a level that is in line with historical levels, but a
  slower pace compared to 2020-2021. About 1 million apartment units have been
  absorbed from 2020 Q2 through 2021 Q4, bringing the vacancy rate down to 4.9% from
  6.7% in 2020 Q1.

  In the office market, 10.2 million square feet of office space was absorbed on a net basis
  in the past three months ending January 26. With workers heading back to the office,
  occupancy has increased since 2021 Q3. However, there is still 117 million square feet of
  office space returned to the market since 2020 Q2 through 2021 Q4. The vacancy rate
  has increased to 12.4% as of 2021 Q4 from 9.7% in 2020 Q1.

  In the industrial market, 96.8 million square feet of office space was absorbed in the past
  three months ending January 26, with 684 million square feet of space absorbed since
  2020 Q2 through 2021 Q4. The industrial sector has the lowest vacancy rate among the
  core property markets, at 4.4%, from 5.3% in 2020 Q1.

  In the retail property market, 28.5 million square feet absorbed in the past three months
  ending January 26, with a net absorption of 50 million square feet since 2020 Q2
  through 2021 Q4. The vacancy rate is at 4.6%.
Commercial Market Insights - January 2022 National Association of REALTORS Research Group - National Association of ...
Commercial Market Overview
Net absorption outpaces construction except in office

 Asking rents rose on a year-over-year basis
 in all core commercial markets. Asking rent
 growth on a year-over-year basis is highest
 for the multifamily property sector at 11.3%.
 Asking rents for industrial properties also
 continued to rise steeply at 8.9%. Even rents
 for retail properties rose at 3.5%. In the office
 property market, asking rents are now also
 trending upwards by 1%.

 In the multifamily market, 600,251 units
 were absorbed in the past 12 months ended
 January 26, which is slightly below the
 687,540 units under construction, or 4% of
 current inventory. With slower demand,
 expect rent growth to ease somewhat. In
 the industrial property market, the 507
 million square feet under construction is on
 pace with the 12-month absorption of 504
 million, but not all of this current
 construction will be completed in 12
 months. Expect rent growth to continue to
 increase and vacancy rates to tighten. In
 the office market, 142 million square feet is
 under construction, which is equivalent to
 1.7% of the current inventory, so this
 additional supply will add to the unused
 office space; expect vacancy rates to
 increase and rent growth to remain
 modest. In the retail property market, 49
 million square feet of office space is under
 construction, which is below the 12-month
 net absorption, so expect an uptick in rent
 and tighter vacancy rate.

 With strong investor demand, cap rents
 continued to trend down, an indication that
 property values are rising. As of December
 18, the lowest median cap rate was of
 multifamily properties (5.1%) while the
 highest cap rate was of retail properties
 (6.9%). Cap rates have trended downwards
 compared to pre-pandemic levels even for
 office properties and even as 10-year
 Treasury yields have trended upwards to
 1.75% as of January 21 from 0.9% in March
 2020.
Commercial Market Insights - January 2022 National Association of REALTORS Research Group - National Association of ...
Multifamily
Absorption of apartment units starting to ease

Net absorption of apartment units appears
to be slowing down. In the 12 months ended
January 26, net absorption was at 600,251
units, a slower pace compared to the 12-
month absorption of 709,000 in 2021. Net
absorption declined across all multifamily
class types. Class A apartment accounted
for 51% of the absorbed units, followed by
Class B (46%) and then Class C (11%).

The 12-month net absorption is running
below the 687,540 apartment units under
construction in 390 markets tracked by
CoStar, so slower demand will tend to
reduce the pressure for rents to rise. As of
January 16, asking rents are have increased
on average by 11.3% in the past 12 months.

By class, fewer Class A apartment units are
under construction compared to the pre-
pandemic level, while construction of Class
B and C apartments have increased. Class A
units tend to be found in central business
districts so the decline in Class A units is an
indicator that developers are investing less
in central business districts and more in the
outlying areas.

 Source: NAR analysis of CoStar data
Commercial Market Insights - January 2022 National Association of REALTORS Research Group - National Association of ...
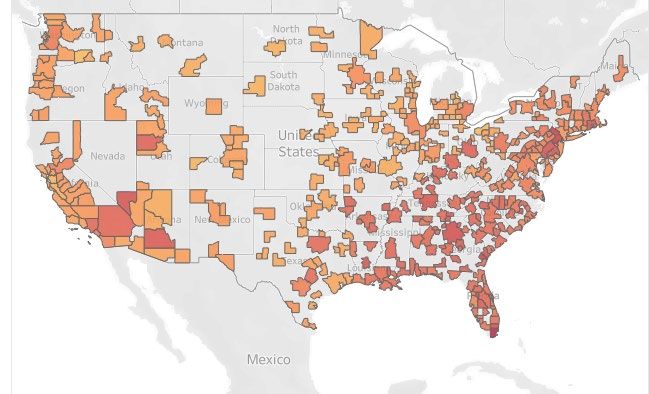
Multifamily
Strongest asking rent growth in Sunbelt and Mountain states

 A third of metro areas are experiencing double-digit increases in asking rents. These are
 mainly in metro areas in the Sunbelt and Mountain areas. Florida metro areas are
 experiencing the highest rent growth, led by Naples (38%), Fort Myers (33%), Orlando (24%),
 Tampa (23%), Fort Lauderdale (22%), and Punta Gorda (23%).
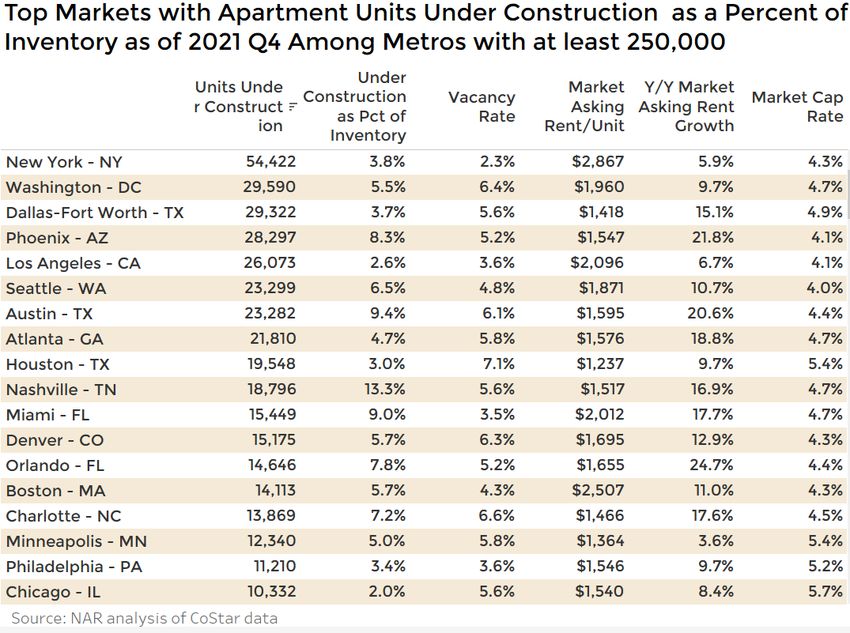
Multifamily
NY Metro is still top market for developers, but intensity of
construction activity is highest in non-primary markets
 The New York metro area is still the top market for developers in terms of the number of
 units under construction, with nearly 55,000 units under construction, adding 4% to the
 current inventory. This will ease the tight supply in the New York metro area, which has a
 vacancy rate of just 2%. Washington DC is another favorite market for developers, with
 nearly 30,000 units under construction or 5.5% of inventory. With a vacancy rate of nearly
 6%, the added supply should ease rent growth. Dallas, Phoenix, and Los Angeles round out
 the top five (Table 1).

 However, the intensity of construction―measured by construction activity as a percent of
 current stock of apartment units ― is highest in Myrtle Beach (23%), Port St. Lucie (23%),
 Huntsville (16%), Spartanburg (14%), Nashville (14%). Provo (11%) and Ogden (10%).
Office
Occupancy continues to improve as of January 2022

On a net basis, office occupancy increased in
the three month period ending January 26,
with 10.2 million square feet absorbed.
Absorption has been positive since 2021 Q3.
Absorption was positive for Class A and Class
B office buildings, while occupancy declined
in Class C apartments. Occupiers might have
a preference for Class A/B because newer
buildings have facilities and amenities that
create safer and healthier working conditions
to minimize the transmission of the Covid
virus, and have workspaces that are better
suited for a hybrid workstyle (e.g. better air
filtration, touchless elevators, a mix of
dedicated and hot desks).

However, office occupancy is still down on a
net basis by 105 million square feet since the
pandemic and the vacancy rate remains
elevated at 12.4%. Class A office buildings
have the highest vacancy rate, at 16%, while
Class C buildings have the lowest vacancy
rate at 5.3%.

With high vacancy rates, Class A buildings
had the lowest average rent growth in the
past 12 months of 0.4% compared to 1.4% for
Class C buildings.

In the office market, 142 million square feet is
under construction, which is equivalent to
1.7% of the current inventory, mostly Class A.
So expect rent growth to remain modest as
the units under construction add to the
supply of office space.

 Source: NAR analysis of CoStar data
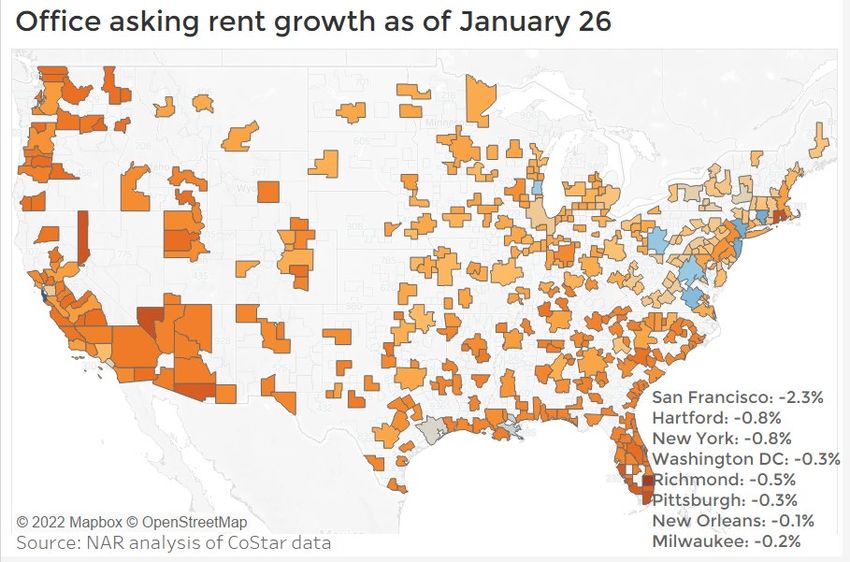
Office
Rents are increasing in nearly all metro areas

 Of the 390 market areas tracked by CoStar, only eight have declining rents. These include
 the major markets of San Francisco (-2.3%), New York (-0.8%), and Washington DC (-0.3%).).
 Florida has eight of the 40 top metro areas with the fastest rent growth, with average rent
 growth in the past 12 months of at least 3% year-over-year: Palm Beach, Miami, Fort
 Lauderdale, Orlando, Sarasota, Fort Myers, Melbourne, and Naples.

 Source: NAR analysis of CoStar data
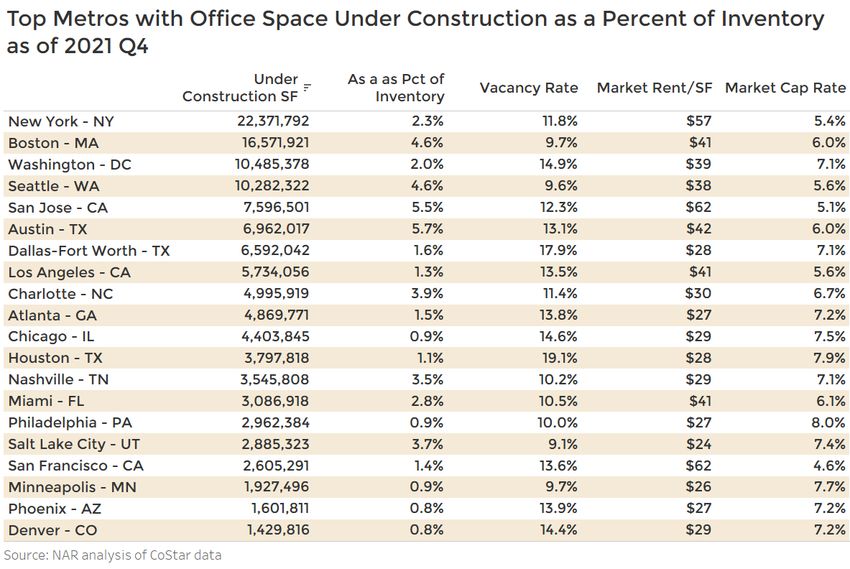
Office
Office construction to hold down rent growth

 As of 2021 Q4, 142 million square feet is under construction, equivalent to 1.7% of the
 current inventory of office space. With 105 million square feet of office space given back to
 the market since the pandemic, the construction underway will add to the current vacant
 space and will keep rent growth at a modest pace, likely at just 1%.

 The largest office construction activity is in the New York metro areas, followed by Boston,
 Washington DC, and Seattle, each with at least 10 million square feet under construction
 (Table 1).

 As a percent of office inventory, the construction activity is most intense in Austin (5.7%),
 San Jose (5.5% of inventory), Seattle (4.6%), Boston (4.6%), Charlotte (3.9%), Salt Lake City
 (3.7%), and Nashville (3.5%) where construction is at least 3% of the current inventory (Table
 2). The average market rent per square foot in these markets is about $20 to $30 cheaper
 compared to San Francisco and San Jose, which generates significant savings in office
 rents for tech companies setting up in these markets.
Industrial
Shredding records as total absorption reaches highest
level ever

  The U.S. industrial sector is continuing its                                                          Industrial Demand: Net Absorption Since Q1
  record-setting ways as it went on a tear                                                        180
                                                                                                                           2012
  in Q4 and in 2021 in general. It is difficult

                                                               Net Absorption SF in Millions SF
                                                                                                  160
  to find weakness in this sector currently,
                                                                                                  140
  where industrial properties across the
                                                                                                  120                                                     132.1
  U.S. landscape are experiencing such
  positive momentum and with a lot of                                                             100
  investor optimism for these concrete                                                             80
  walls.                                                                                           60
                                                                                                   40
  In regards to net absorption, although                                                           20
  down from the previous quarter,                                                                   0
  absorption reached 132.1 msf in Q4 2021,

                                                                                                        2012 Q1
                                                                                                        2012 Q3
                                                                                                        2013 Q1
                                                                                                        2013 Q3
                                                                                                        2014 Q1
                                                                                                        2014 Q3
                                                                                                        2015 Q1
                                                                                                        2015 Q3
                                                                                                        2016 Q1
                                                                                                        2016 Q3
                                                                                                        2017 Q1
                                                                                                        2017 Q3
                                                                                                        2018 Q1
                                                                                                        2018 Q3
                                                                                                        2019 Q1
                                                                                                        2019 Q3
                                                                                                        2020 Q1
                                                                                                        2020 Q3
                                                                                                        2021 Q1
                                                                                                        2021 Q3
  the most ever recorded in any Q4. Net
  absorption of industrial space reached
  its strongest level ever, with a total net                   Source: NAR analysis of CoStar data
  absorption of 504.0 msf in 2021, which is
  more than double 2020’s total.                                                                  The largest increase in occupancy was in
  Absorption as of January 25, 2022 totaled                                                       Dallas-Fort Worth, Chicago, Phoenix,
  100.9 msf. To put that into perspective in                                                      Indianapolis, Houston, Little Rock and
  regards to the increased demand for                                                             Atlanta each with net absorption over 4
  industrial space, the previous Q1 2021                                                          msf as of Q1 2022.
  record high took the entire quarter to
  reach at 115 msf and we are currently less
  than 15 msf away from that number,
  having done so in less than one month
  into Q1 2022.

        Positive Net Absorption as of January 25,                                                       Negative Net Absorption as of January 25,
                         2022                                                                                            2022
                                                                                                        Roanoke - VA (631,411)
Dallas-Fort Worth - TX                            10,718,664
                                                                                                    Lexington - KY       (555,414)
          Chicago - IL                     8,006,156
                                                                                                   Bakersfield - CA         (507,474)
         Phoenix - AZ               5,988,131
                                                                                                          Tampa - FL                    (268,152)
     Indianapolis - IN            5,248,216
                                                                                                        Altoona - PA                      (215,623)
         Houston - TX           4,746,525
                                                                                  Winston-Salem - NC                                       (204,643)
       Little Rock - AR        4,028,864
                                                                                                    Pittsfield - MA                        (203,804)
          Atlanta - GA         4,010,799

           Austin - TX                                                                            Baton Rouge - LA                            (148,072)
                              3,900,442

        Memphis - TN         3,461,345                                                             South Bend - IN                            (147,265)

Source: NAR analysis of CoStar data                                                    Source: NAR analysis of CoStar data
Industrial
Positive rent growth experienced in all 390 covered
metro markets

 The average asking rent across 390
 markets increased by 9% year-over-year                         Y/Y Percent Change in Average Asking
 as of January 25, 2022. While almost a                                         Rent
 third of metros have double-digit rent             10.0%                                                                                                                                       9.3%
 growth, all 390 covered metros have                 9.0%
 positive rent growth. Across the U.S., the          8.0%
                                                     7.0%
 highest rent growth rates are located in            6.0%
 the Sunbelt states and in particular                5.0%
                                                     4.0%
 Florida. Florida metro areas such as                3.0%
 Miami, The Villages, and Fort Lauderdale            2.0%
 had the highest rent growth rates. The              1.0%
                                                     0.0%
 metro areas of Miami, Northern New

                                                            2012 Q1
                                                                      2012 Q4
                                                                                2013 Q3
                                                                                          2014 Q2
                                                                                                    2015 Q1
                                                                                                              2015 Q4
                                                                                                                        2016 Q3
                                                                                                                                  2017 Q2
                                                                                                                                            2018 Q1
                                                                                                                                                      2018 Q4
                                                                                                                                                                2019 Q3
                                                                                                                                                                          2020 Q2
                                                                                                                                                                                    2021 Q1
                                                                                                                                                                                              2021 Q4
 Jersey, Hinesville, The Villages, Atlanta,
 Fort Lauderdale, Goldsboro, Providence
 and Philadelphia, had asking rents up at
 least 13% year-over-year and were the              Source: NAR analysis of CoStar data
 leaders as of January 25, 2022.

             Industrial: All 390 metros covered had positive y/y percent change in asking rents
                                            as of January 25, 2022

            Fairbanks, Alaska: 7.1%
            Anchorage, Alaska: 7.1%
            Honolulu, Hawaii: 7.1%
            Kahului-Wailuku-Lahaina, Hawaii: 7.3%
Industrial
The Sunbelt leads industrial construction and Texas in
particular

 At the conclusion of Q4 2021, there were
 2,268 industrial buildings under
 construction totaling 512 msf. This is the             Industrial Space Under Construction SF
 largest amount of industrial space ever                         as of January 25, 2022
 under construction according to 390              600,000,000                                                                                                       512,242,816
 markets tracked by CoStar where the              500,000,000
 leaders in square footage under                  400,000,000
 construction were Dallas-Fort Worth,             300,000,000
 Phoenix, Chicago, Atlanta, Indianapolis,
                                                  200,000,000
 Inland Empire, Philadelphia, Columbus,
                                                  100,000,000
 Savannah, and Houston.
                                                            0

                                                                2012 Q1
                                                                          2012 Q4
                                                                                    2013 Q3
                                                                                              2014 Q2
                                                                                                        2015 Q1
                                                                                                                  2015 Q4
                                                                                                                            2016 Q3
                                                                                                                                      2017 Q2
                                                                                                                                                2018 Q1
                                                                                                                                                          2018 Q4
                                                                                                                                                                    2019 Q3
                                                                                                                                                                              2020 Q2
                                                                                                                                                                                        2021 Q1
                                                                                                                                                                                                  2021 Q4
 In regards to the number of industrial
 buildings under construction, the Sunbelt
 was the most active as it pertains to the
 top 5 metros with Dallas-Forth Worth (236)       Source: NAR analysis of CoStar data
 leading, followed by Houston (174), Inland
 empire (156), Phoenix (138) and Atlanta (110).
 Of the top leaders in the number of
 industrial buildings under construction and
 with the largest footprint, these metro
 areas are primarily located in Texas.

               Markets with Most Industrial Space Under Construction as of Q4 2021
Retail
Retail demand continues to outpace supply while
leasing slides
 Retail markets continued solid performance
 in Q4 2021. After having absorbed 29 million                                                                                                                                                                                Retail Demand: Net Absorption Since Q1
                                                                                                                                                                                                                                             2012
 sf in Q3 2021, the highest level since Q4 2017,
 more than 28 msf was absorbed in the fourth

                                                                                                                                                                                Net Absorption SF in Millions SF
                                                                                                                                                                                                                     50
 quarter as occupancy fell by less than a 1 msf.                                                                                                                                                                     40
 But despite the decline, absorption had a                                                                                                                                                                           30
 good Q4. Since 2020 Q2, retail occupancy is                                                                                                                                                                         20                                                                                                                                                       28
 up on a net basis by 50 msf, with the largest
                                                                                                                                                                                                                     10
 losses in the metro areas of Saint Louis,
 Jackson, Modesto, Northern New Jersey,                                                                                                                                                                                0
 Harrisburg, Kingsport and Poughkeepsie.                                                                                                                                                                           -10
 Conversely, metro such as Houston, Dallas-                                                                                                                                                                        -20
 Fort Worth, Atlanta, Chicago, Detroit,

                                                                                                                                                                                                                              2012 Q1
                                                                                                                                                                                                                                         2012 Q4
                                                                                                                                                                                                                                                    2013 Q3
                                                                                                                                                                                                                                                              2014 Q2
                                                                                                                                                                                                                                                                         2015 Q1
                                                                                                                                                                                                                                                                                    2015 Q4
                                                                                                                                                                                                                                                                                              2016 Q3
                                                                                                                                                                                                                                                                                                        2017 Q2
                                                                                                                                                                                                                                                                                                                   2018 Q1
                                                                                                                                                                                                                                                                                                                             2018 Q4
                                                                                                                                                                                                                                                                                                                                           2019 Q3
                                                                                                                                                                                                                                                                                                                                                      2020 Q2
                                                                                                                                                                                                                                                                                                                                                                2021 Q1
                                                                                                                                                                                                                                                                                                                                                                          2021 Q4
 Phoenix, Philadelphia and New York each
 had positive net absorption of at least 1 msf.
                                                                                                                                                                         Source: NAR analysis of CoStar
 On the supply side, supply is continuing to
 be outpaced by increasing demand for retail
 space. The increase in demand for retail                                                                                                                                                                                                   Retail Demand and Deliveries
 space is still met with supply coming up
 short. Supply lagged demand for the 3rd                                                                                                                                        50,000,000
 consecutive quarter in Q4 2021 (5.3 msf). But                                                                                                                                  40,000,000
 supply in Q4 2021 was above the 10-year low                                                                                                                                    30,000,000
 recorded in Q3 2021 (1.4 msf).                                                                                                                                                 20,000,000
                                                                                                                                                                                10,000,000
 Leasing continues to slide from the Q2 2021                                                                                                                                                                                    0
 high of 57 msf towards 45 msf in Q4 2021.                                                                                                                                  -10,000,000
 The current level is still above the Q2 2020                                                                                                                               -20,000,000
 low point (34 msf). However, current levels
                                                                                                                                                                                                                                       2012 Q1
                                                                                                                                                                                                                                                 2012 Q4
                                                                                                                                                                                                                                                           2013 Q3
                                                                                                                                                                                                                                                                     2014 Q2
                                                                                                                                                                                                                                                                               2015 Q1
                                                                                                                                                                                                                                                                                         2015 Q4
                                                                                                                                                                                                                                                                                                   2016 Q3
                                                                                                                                                                                                                                                                                                             2017 Q2
                                                                                                                                                                                                                                                                                                                       2018 Q1
                                                                                                                                                                                                                                                                                                                                 2018 Q4
                                                                                                                                                                                                                                                                                                                                            2019 Q3
                                                                                                                                                                                                                                                                                                                                                      2020 Q2
                                                                                                                                                                                                                                                                                                                                                                2021 Q1
                                                                                                                                                                                                                                                                                                                                                                          2021 Q4
 remain below the 2012 to 2019 new leasing
 average of 59 msf. As of January 26, 2022, Q1
 2022, retail leasing activity totals 11.9 msf.                                                                                                                                                                                                               Net Absorption SF                                            Net Delivered SF

                                                                                                                                                                          Source: NAR analysis of CoStar data

                                                             Retail Leasing Activity SF as of January 26, 2022
                                         80
                                         70
       Leasing Activity SF in Millions

                                         60
                                         50
                                         40
                                         30
                                         20
                                         10
                                          0
                                              2012 Q1
                                                        2012 Q3
                                                                  2013 Q1
                                                                            2013 Q3
                                                                                      2014 Q1
                                                                                                2014 Q3
                                                                                                          2015 Q1
                                                                                                                    2015 Q3
                                                                                                                              2016 Q1
                                                                                                                                        2016 Q3
                                                                                                                                                  2017 Q1
                                                                                                                                                            2017 Q3
                                                                                                                                                                      2018 Q1
                                                                                                                                                                                2018 Q3
                                                                                                                                                                                                                   2019 Q1
                                                                                                                                                                                                                             2019 Q3
                                                                                                                                                                                                                                       2020 Q1
                                                                                                                                                                                                                                                 2020 Q3
                                                                                                                                                                                                                                                           2021 Q1
                                                                                                                                                                                                                                                                     2021 Q3
                                                                                                                                                                                                                                                                               2022 Q1

      Source: NAR analysis of CoStar data
Retail
 Florida retail market is hot with four metros in top ranks of
 fastest rent growth

  Retail asking rents continue to pick up in Q4                       Retail Y/Y Percent Change in Asking Rent
  2021. Asking rents reached 3.0% above last                                     as of January 26, 2022
  year where asking rents increased across all
                                                             4.0%
  of retail properties. Asking rents increased               3.5%                                                                                                                                        3.4%
  most in malls, up 1% from Q3 2021. Following               3.0%
  malls, rents picked up in regards to Q3 2021               2.5%
                                                             2.0%
  in power centers by (.09%), neighborhood                   1.5%
  centers (.09%), general retail (.08%) and strip            1.0%
  centers (.08%). As of January 26, 2022, retail             0.5%
                                                             0.0%
  rents are up by 3.4% year-over-year.                      -0.5%
                                                            -1.0%
  As of January 26, 2022, of the 390 market

                                                                     2012 Q1
                                                                               2012 Q4
                                                                                         2013 Q3
                                                                                                   2014 Q2
                                                                                                             2015 Q1
                                                                                                                       2015 Q4
                                                                                                                                 2016 Q3
                                                                                                                                           2017 Q2
                                                                                                                                                     2018 Q1
                                                                                                                                                               2018 Q4
                                                                                                                                                                         2019 Q3
                                                                                                                                                                                   2020 Q2
                                                                                                                                                                                             2021 Q1
                                                                                                                                                                                                       2021 Q4
  areas tracked by CoStar, retail rents are
  declining on a year-over-year basis in 7
  markets, including San Francisco (-5.1%),                 Source: NAR analysis of CoStar data
  Saint Louis (-2.8%), Portland (-0.5%),
  Richmond (-0.5%), Milwaukee (-0.2%),
  Stamford (-0.1%) and Pittsburgh (-0.1%).

  The leaders in asking rent growth on a year-               Florida has four of the eleven top metro areas
  over-year basis were Nashville and Las Vegas,              with the fastest rent growth, with rent up at
  where asking rents increased by double                     least 6.7% year-over-year: Tampa, Miami,
  digits towards 10.5% and 10.3% respectively.               Jacksonville and Fort Lauderdale.

       Positive Y/Y Percent Change in Asking Rents                               Negative Y/Y Percent Change in Asking
                   as of January 26, 2022                                            Rents as of January 26, 2022
       Nashville - TN                               10.5%
                                                                San Francisco - CA -5.1%
      Las Vegas - NV                                10.3%
                                                                    Saint Louis - MO                                                             -2.8%
 Fort Lauderdale - FL                          9.1%
     Jacksonville - FL                       8.6%                       Portland - OR                                                                                                   -0.5%
           Tulsa - OK                        8.6%
                                                                      Richmond - VA                                                                                                      -0.5%
   Salt Lake City - UT                       8.5%
                                                                    Milwaukee - WI                                                                                                            -0.2%
          Miami - FL                     7.9%
          Akron - OH                    7.4%                            Stamford - CT                                                                                                           -0.1%
    Owensboro - KY                     7.3%
                                                                     Pittsburgh - PA                                                                                                            -0.1%
  Inland Empire - CA                  6.8%
          Tampa - FL                  6.7%
Source: NAR analysis of CoStar data                             Source: NAR analysis of CoStar data
Retail
Vacancy continues to decrease, pushing up rent growth

    Retail vacancy steadily declined throughout 2021 before hitting a year low of 4.8% in
    Q4 2021, down from 5.1% in Q3 2021. As of January 26, 2022 Q1, retail vacancy continued
    its descent to 4.6% but with net deliveries increasing by 3.8 msf for Q4 2021, an
    additional 50 msf currently under production (Q4 2021), and net deliveries increasing
    by 16.5 msf as of January 26, 2022, vacancy bears watching. With vacancy steadily
    decreasing, upward pressure has been placed on asking rents.

    Of the 50 msf of retail space under construction, the largest retail construction activity
    is in the Houston metro area (3.9 msf), followed by Miami (3.5 msf), Dallas-Fort Worth
    (3.1 msf), New York (2.9 msf), Atlanta (2.2 msf), Chicago (1.7 msf), Washington DC (1.4
    msf), Inland Empire (1.4 msf), Los Angeles (1.2 msf), Las Vegas (1.0 msf) and Orlando (1.0
    msf), each with at least 1 msf under construction.

                                                                                    Retail Vacancy Rate as of January 26, 2022
       Retail Space Under Construction as of Q4
                        2021                                      8.0%
          Houston - TX                             3,947,500
                                                                  7.0%
             Miami - FL                         3,505,962
  Dallas-Fort Worth -…                        3,186,642           6.0%
         New York - NY                      2,911,657             5.0%
           Atlanta - GA                2,217,478                  4.0%                                                                                                                                                        4.6%
            Chicago - IL            1,735,258
                                                                  3.0%
     Washington - DC              1,498,300
   Inland Empire - CA             1,469,956                       2.0%
      Los Angeles - CA          1,220,272                         1.0%
        Las Vegas - NV         1,054,947                          0.0%
           Orlando - FL        1,017,512
                                                                                  2012 Q1
                                                                                            2012 Q4
                                                                                                      2013 Q3
                                                                                                                2014 Q2
                                                                                                                          2015 Q1
                                                                                                                                    2015 Q4
                                                                                                                                               2016 Q3
                                                                                                                                                         2017 Q2
                                                                                                                                                                       2018 Q1
                                                                                                                                                                                  2018 Q4
                                                                                                                                                                                             2019 Q3
                                                                                                                                                                                                       2020 Q2
                                                                                                                                                                                                                 2021 Q1
                                                                                                                                                                                                                           2021 Q4
             Austin - TX      988,424
           Phoenix - AZ       957,540
        Columbus - OH         950,785
     San Antonio - TX         919,932                           Source: NAR analysis of CoStar data
       Jacksonville - FL     819,009
           McAllen - TX      810,909
     Kansas City - MO        772,960
                                                                                  Retail Space Under Construction as of Q4
            Detroit - MI    728,271
                                                                                                   2021
           Denver - CO      659,892
           Boston - MA     582,776                                               100
    San Francisco - CA     582,098                                                90
                                                                                  80
                                                                in Millions SF

         Louisville - KY   578,985
                                                                                  70
          Portland - OR    565,780                                                60
      Long Island - NY     560,387                                                50
East Stroudsburg - PA      544,826                                                40
           Seattle - WA    539,974                                                30
                                                                                  20
         Nashville - TN    528,472
                                                                                  10
              Tulsa - OK   527,836                                                 0
         Portland - ME     525,000
                                                                                       2012 Q1
                                                                                                 2012 Q4
                                                                                                           2013 Q3
                                                                                                                     2014 Q2
                                                                                                                               2015 Q1
                                                                                                                                         2015 Q4
                                                                                                                                                   2016 Q3
                                                                                                                                                             2017 Q2
                                                                                                                                                                        2018 Q1
                                                                                                                                                                                   2018 Q4
                                                                                                                                                                                             2019 Q3
                                                                                                                                                                                                       2020 Q2
                                                                                                                                                                                                                 2021 Q1
                                                                                                                                                                                                                           2021 Q4

 Source: NAR analysis of CoStar data

                                                               Source: NAR analysis of CoStar data
Hotel
Rising occupancy and revenues as travel resumes

 With the progress on vaccination and the
 uptick in business and personal travel,
 hotel occupancy improved to 57.9% in
 December compared to the 3-month
 occupancy rate of 42% one year ago. The
 hotel industry’s revenue metrics― average
 daily rate (ADR) and revenue per available
 room (RevPAR) ― also improved. RevPAR
 rose to $77, or double the $39/room rate
 one year ago while the ADR rose to $133
 from $94 one year ago.

 The highest occupancy rates are in
 Portland (Maine), Southern Louisiana,
 Allenton/Reading, Gatlinburg, California,
 and Richmond, with hotel occupancy
 rates of at least 70%.

 ADR is the total revenue/number of rooms.
 RevPAR is ADR x occupancy rate.
COMMERCIAL MONTHLY INSIGHTS REPORT
January 2022

LAWRENCE YUN, PhD
Chief Economist & Senior Vice President for Research

GAY CORORATON
Senior Economist & Director of Housing and Commercial Research

BRANDON HARDIN
Research Economist

MEREDITH DUNN
Research Manager

Download report at https://www.nar.realtor/commercial-market-insights

Download other NAR Commercial reports at Commercial Research

©2022 National Association of REALTORS®
All Rights Reserved. May not be reprinted in whole or in part without permission of the National
Association of REALTORS®.

For questions about this report or reprint information, contact data@nar.realtor.
The National Association of REALTORS® is America’s largest trade association,
representing more than 1.5 million members, including NAR’s institutes, societies
and councils, involved in all aspects of the real estate industry. NAR membership
includes brokers, salespeople, property managers, appraisers, counselors and
others engaged in both residential and commercial real estate. The term
REALTOR® is a registered collective membership mark that identifies a real estate
professional who is a member of the National Association of REALTORS® and
subscribes to its strict Code of Ethics. Working for America's property owners, the
National Association provides a facility for professional development, research and
exchange of information among its members and to the public and government
for the purpose of preserving the free enterprise system and the right to own real
property.

NATIONAL ASSOCIATION OF REALTORS®
RESEARCH GROUP

The Mission of the NATIONAL ASSOCIATION OF REALTORS® Research Group is to
produce timely, data-driven market analysis and authoritative business intelligence
to serve members, and inform consumers, policymakers and the media in a
professional and accessible manner.

To find out about other products from NAR’s Research Group, visit
www.nar.realtor/research-and-statistics

500 New Jersey Avenue, NW
Washington, DC 20001
202.383.1000
You can also read