Clean Jobs Plan How 76,000 new jobs for Australians can help rebuild our economy now and tackle climate change - Climate Council
←
→
Page content transcription
If your browser does not render page correctly, please read the page content below

Clean Jobs Plan
How 76,000 new jobs for Australians
can help rebuild our economy now
and tackle climate change

                                      αlphaβeta   |   1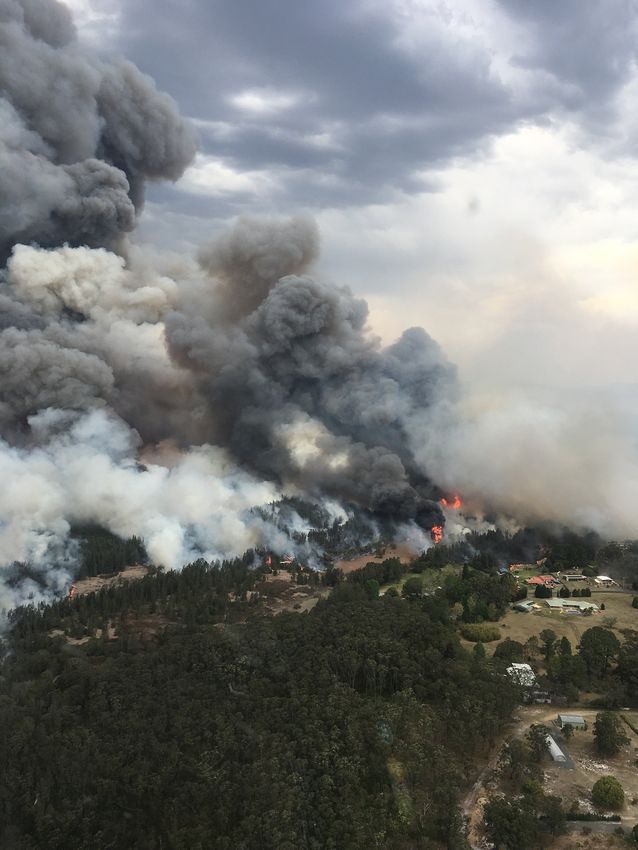
Contents

Introduction                                 03

Key findings                                 06

Chapter 1: The recovery opportunity          07

           i. Methodology                    11

Chapter 2: The Clean Jobs Plan               13

Chapter 3: Setting us up for the future      22

           i. State and territory profiles   24

           ii. Case studies                  33

Appendix: Detailed methodology               37

                                                  αlphaβeta   |   2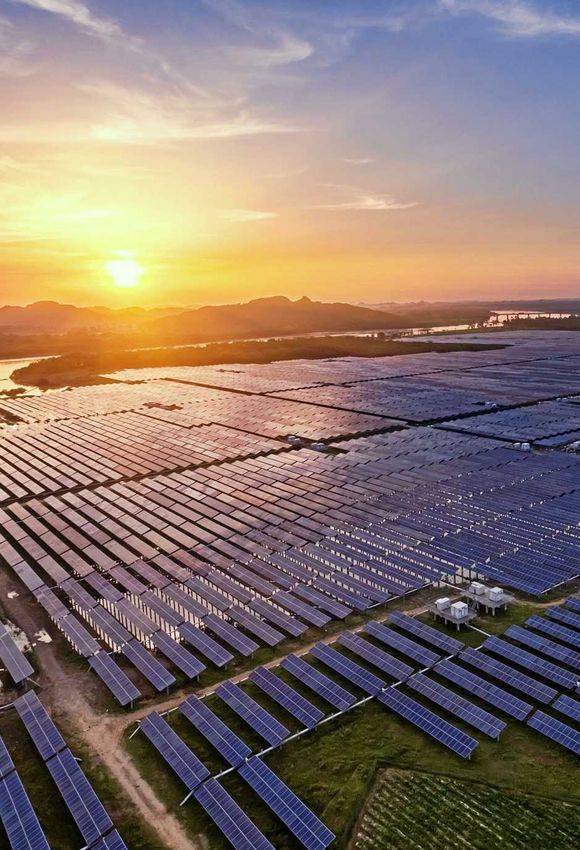
Introduction
Australia is facing twin crises. After last       opportunities represent 76,000 jobs. Job
summer’s climate change-fuelled bushfires         creation would start immediately and
many communities are still doing it tough,        continue over a three-year period.
and now, hundreds of thousands of other
Australians are out of work due to COVID-19.      Crucially, these opportunities are shovel
                                                  ready, deliberately targeted to regions and
Economic recovery is top of mind for              occupations hit hardest by job losses, and
Australians, and governments have a crucial       have the potential to grow the entire
role to play in making targeted investments       economy in the long term.
and implementing policies that can put
Australians back to work. In doing so             These are jobs for the many Australians who
governments can choose to invest in               need to get back to work now:
initiatives that set us up for the future,        §   Seventy percent of the jobs are in
creating win/win solutions that create jobs           construction and administrative services,
and tackle long-term problems at the same             sectors that have already seen 80,000
time.                                                 jobs lost to COVID-19;
                                                  §   Forty percent of the jobs are in regional
This Clean Jobs Plan provides a whole-of-             areas; and
economy solution. It identifies 12 major policy   §   A third of the jobs require minimal
opportunities to immediately kick-start               training.
economic growth. Collectively, these

                                                                                 αlphaβeta   ||   3
Introduction (continued)

The analysis does not identify every job that can be      investment; utility-scale renewable energy unlocks
created. Instead, it focuses on targeting regions and     $3 for every dollar invested; and investing in electric
occupations hit hardest by job losses and on              vehicle infrastructure, improving the collection and
programs that can create jobs quickly.                    processing of organic waste, and community scale
                                                          energy and storage, would all unlock $2 for every
The Clean Jobs Plan is based on detailed economic         dollar invested.
modelling. It provides specific analysis for each state
and territory, identifying five priority areas for each   A strong economy needs a healthy environment. By
that will generate large numbers of jobs quickly,         focusing on clean policy measures, governments can
while also complementing current economic plans.          build modern, resilient electricity systems, develop
                                                          new industries and restore and protect Australia’s
It provides excellent bang for buck. Analysis reveals     unique landscapes. This protects all of us from
that the Clean Jobs Plan is as cost-effective as, or      climate change, while investing in the growth
better than, similar Australian economic recovery         industries of the future.
programs. The Clean Jobs Plan is also highly focused
on maximising the value of public investment. The         Australia’s experience with the COVID-19 pandemic
proposed policy opportunities were found to be            has shown that we can work together, follow expert
highly efficient job creators due to their labour         advice and take decisive action to keep the virus
intensity. Most of the 12 options identified in the       contained. We must apply this same rigour to other
Plan offer significant opportunities to leverage          pressing issues and introduce smart, clean stimulus
private investment for the Australian economy.            measures to kick-start the economy, create jobs and
Investment in pilot-scale green hydrogen facilities       tackle climate change.
would unlock $4 for every dollar of public

                                                                                                 αlphaβeta   ||     4
Twelve policy opportunities to deliver 76,000 jobs that re-engineer our energy system,
renew industries and restore our environment
Restored ecosystems
Install additional utility-scale Prioritise targeted ecosystem Accelerate public and active transport
Cleaner cities
Clean energy
renewable energy restoration projects infrastructure investments
15,000 jobs 12,000 jobs 12,000 jobs
Install resilient community-scale grid Improve organic waste management Audit and retrofit public buildings to
systems including battery storage with better collection and processing improve energy efficiency
2,000 jobs 10,000 jobs 8,000 jobs
Pilot green hydrogen projects Expand coverage of urban and peri-
Support retrofitting of residential
urban gardens
buildings to improve energy efficiency
500 jobs 6,000 jobs 7,000 jobs
Cleaner futures
Fund public research to mitigate and respond Fund adult education and training to help Expand and improve the electric
to climate change transition workers to new roles vehicle charging network
2,000 jobs 1,000 jobs 500 jobs
αlphaβeta | 5Key findings
1 2 3 4
The Clean Jobs Plan shows how 12 policy Implementing the Clean Jobs Plan will help The Clean Jobs Plan identifies thousands of Economic stimulus can set Australia up for
opportunities can put 76,000 Australians to people and industries that have been hit job opportunities in every state and the future by creating jobs, kick-starting the
work, reboot the economy, and tackle long- hardest by the COVID-19 crisis, especially in hundreds in each territory. economy and tackling climate change
term challenges including climate change. regional Australia. simultaneously.
The 12 major opportunities, identified § Approximately 1 in 3 job openings would § The Clean Jobs Plan provides a top 5 § The Clean Jobs Plan can unlock significant
through granular economic modelling, require minimal training, meaning that priority list for economic stimulus in every private investment for the Australian
include: displaced workers, from hospitality state and territory, in alignment with each economy and further industry
§ 15,000 jobs installing utility-scale workers in Victoria to tourism operators in jurisdiction’s current priorities. development. For example, investment in
renewable energy, including solar and Cairns, could be rapidly employed. pilot-scale green hydrogen facilities would
§ For example, utility scale renewable
wind farms, transmission infrastructure unlock $4 of private investment for every
§ Seventy percent of job opportunities are energy in Victoria can create 3,000 - 4,000
and adding utility-scale batteries. dollar of public investment.
in construction and administrative, high and low skilled jobs and help the
support and logistics services – sectors state meet its Renewable Energy Target of § The Clean Jobs Plan will indirectly benefit
§ 12,000 jobs in targeted ecosystem where 80,000 workers have already lost 50% by 2030. other downstream industries such as
restoration, including more than 5,000 in their jobs. manufacturing, trade and hospitality in
Queensland. § States and territories can create jobs
delivering these projects.
§ Forty-two percent of the job opportunities where they are needed most. For
§ 12,000 jobs in public and active transport identified are for regional Australians. example, two of the 12 major policy § Investment in large and small-scale
construction, including 7,000 - 8,000 jobs opportunities, ecosystem restoration and renewable energy assets, transmission
§ The 12 policy opportunities can be
for New South Wales workers. utility-scale renewable energy, can infrastructure, and energy storage facilities
actioned by state and territory
significantly benefit regional areas with can reduce energy costs for households
governments right away. Job creation can
§ 37,000 jobs in other projects across high levels of unemployment. and businesses and provide clean, reliable
start immediately, and continue over the
Australia including in organic waste, power for the future.
three-year analysis period.
energy efficiency in buildings, urban green
spaces, community-scale storage and
more.
αlphaβeta | 6The recovery opportunity
1 A high-impact, targeted, and timely clean jobs plan can rebuild our economy
and tackle climate change
αlphaβeta | 7Climate action is needed for Australia to alleviate economic risks and Australian economic output is more emissions-
intensive than global peers
thrive in a low-emissions world CO2 emitted per $1m of GDP, tonnes6
Australia 322.8
Climate change is a major threat to Australian climate change a ‘systemic risk’, calling for
lives and livelihoods. Australia is over 1°C firms to include climate risks in their financial South Korea 322.5
warmer than it was 100 years ago.1 Extreme disclosure documents to ensure investors are
weather events, such as heatwaves and sufficiently informed.4 And the Australian Canada 317.4
dangerous bushfire conditions, are worsening. Prudential Regulation Authority has highlighted +43%
The Australian economy is vulnerable to these that the financial risks of climate change are USA 288.0
escalating climate risks, with property prices ‘foreseeable, material and actionable now’.5 243.6
Japan
liable to fall up to $571 billion and agricultural
and labour productivity by $19 billion in the The Australian economy can thrive in a low-
OECD 226.3
next decade.2 Flow-on effects will be felt across emissions world. Australian economic activity
the country, and will worsen unless emissions is more emissions-intensive than its OECD NZ 195.6
are lowered. peers (see chart). Transitioning to a low-
emissions economy is needed to contribute to EU 182.8
Economic authorities agree that the climate the global effort to alleviate the material
crisis threatens Australia’s economic well- economic risks cited above. Australia also Germany 175.1
being. The Reserve Bank of Australia has stated needs to transition to ensure that businesses 146.9
UK
that more severe, persistent climate-related and workers can thrive in a global economy
shocks could threaten the stability of the that demands low-emissions technology and Singapore 117.4
Australian economy.3 The Australian Securities services.
and Investments Commission has labelled France 105.9
1 CSIRO (2018) State of the Climate. 2 Climate Council (2019) Compound Costs: How Climate Change is damaging Australia’s economy. 3 RBA (2019) ‘Climate Change 6 Selectnations. Estimated based on latest global data (2014 – 2017). GDP adjusted on PPP
and the Economy’. 4 ASIC (2018) ‘Climate Change: Keynote address by John Price, Centre for Policy Development: Financing a Sustainable Economy’. 5 APRA terms. SOURCE: World Bank Open Data, data from Carbon Dioxide Information Analysis Center,
(2017) ‘Australia's new horizon: Climate change challenges and prudential risk’. Environmental Sciences Division, Oak Ridge National Laboratory, Tennessee, United States.
αlphaβeta | 8COVID-19 has created a new, urgent need for jobs to support Australian 838,000 jobs lost since COVID-19 outbreak
families and avoid long-term harm Change in count of employed people, 000s
12 19
-3
The Australian economy has already lost As businesses fail and people stop looking for
838,000 jobs to the COVID-19 crisis. Mid- work, job creation tends to return slowly.
March to mid-June saw the steepest rise in Even the most optimistic forecasts by the RBA -228
unemployment ever recorded in the Australian do not see jobs returning to pre-crisis levels
economy. Over half a million Australians have until 2022.2 These forecasts are supported by
stopped looking for work. Of the remaining job historical experience: studies of downturns in
seekers, one in five are ‘underutilised’ meaning 1982, 1991-92, and the Global Financial Crisis -607
they are either out of work or working fewer show that employment tends to fall quickly in Jan Feb Mar Apr May
hours than they seek.1 This represents recession but is slow to return to pre-crisis
significant hardship among Australian levels (see chart). Unprecedented pace of job loss and recovery
households and a threat to the long-term Change in Australian unemployment rate
productivity of our economy. Stimulus policies that spur public and private (percentage point)
investment are needed to hasten economic
Such steep job losses will likely cause long- recovery. Government investments can COVID-19
5
term harm if left unaddressed. Even short- provide the money needed to support business
term unemployment can create significant activity and jobs. Government investments can
household stress, as well as longer term flow- also encourage further private investment. 90s recession
on effects for the economy. Households facing Clear action from government can provide GFC 80s recession
financial hardship are likely to reduce businesses, workers, and investors the 0
spending, spurring further job losses. This certainty they need to take risks – to retrain, 0 20 40 60 80 100 120 140
dampens skills, business and consumer keep their businesses open, or make new Months since beginning
confidence, resulting in a slower economic investments. NOTE: Australia COVID-19 unemployment is based on RBA Governor forecast of
22 April 2020 that unemployment would be 10% by June. SOURCE: ABS (2020)
recovery for Australia. 6291.0.55.001 – Labour Force, Australia, Detailed, April 2020.
1ABS (2020) 6291.0.55.001 – Labour Force, Australia, Detailed, April 2020. 2 Ken Henry, The Guardian (2020) ‘The unemployment rate doesn’t go back to normal
after a recession – there are long-term effects’. αlphaβeta 9
|An effective stimulus program could deliver jobs quickly and address The national jobs shortfall is worsening
climate change while improving Australia’s long-term economic outlook Share of workforce looking for more work4
1985 3.3%
Australia faces a unique opportunity to rapidly funding and direction, a stimulus package
rebuild a low-emissions post-COVID economy. could unlock social benefits that would
Australian governments have already otherwise be unachievable on a smaller scale. 1990 4.5%
announced significant stimulus packages since
March, but economists and policymakers An effective stimulus program will diversify
recognise that more is needed to support the the economy, improving its long-term 1995 6.5%
economy as it recovers from COVID-19.1 A outlook. Even before the COVID-19 crisis, the
stimulus package that focuses on the creation Australian economy faced long-term risks. 2000 6.3%
of clean jobs could be pivotal in supporting Productivity growth has recently been at half
such a recovery whilst also growing new the long-term average, while
industries and encouraging existing businesses underemployment has grown significantly over 2005 6.7%
and workers to build the capabilities they need the past 35 years (see chart).2 Australia ranks
to thrive in a low-emissions world. far below its peers on international measures
of innovation and economic complexity, 2010 7.1%
The Clean Jobs Plan can also deliver social dampening its long-term competitiveness and
benefits. Projects that improve energy resilience.3 An effective stimulus program could
2015 8.5%
efficiency, modernise the power grid and improve Australia’s economic outlook by
create more green spaces benefit households encouraging the development of new
by enabling cheaper power and healthier industries, technologies and skills, while also 20201 10.6%
environments overall. Australia has so far been creating better job opportunities now and into
slow to make these investments due to the the future. 4Calendar-year average of monthly underemployment rate. Underemployed
upfront costs involved. By providing large-scale workers are employed people aged 15 years and over, who want, and are
available to work, more hours than they currently have. Jan-May 2020.
SOURCE: ABS 6202.0, Table 22.
1RBA (2020) ‘The Reserve Bank's Policy Actions and Balance Sheet’. 2 Productivity Commission (2020) Productivity Insights February 2020. Multi-factor productivity
growth was 1.5% from 1975 – 2019, but just 0.7% from 2014 – 2019; RBA (2019) ‘The Labour Market and Spare Capacity’ 3 Harvard’s Growth Lab (2019), Atlas of
Economic Complexity. Australia’s Economic Complexity Index (a measure of export diversity) is -0.6, ranking 93rd in the world and significantly behind neighbours
and peers like Singapore (1.8), UK (1.4) and Canada (0.7). αlphaβeta | 10METHODOLOGY
Methodology: the Clean Jobs Plan involves 12 policy opportunities that 3 key criteria for inclusion in Clean Jobs Plan
were chosen based on existing proposals and expert input
Does it maximise the jobs created
per dollar invested?
Step 1: A longlist of 30 options was identified Step 3: The longlist was evaluated against the Does it add investment to the
criteria to select a shortlist of 12 policy High economy?
The policies were identified based on a review opportunities
of current proposals from Australia and around impact
the world. This includes the European Green Our choice of policies was tested with Does it leverage funding from the
Deal,1 the UK Government’s recently policymakers and industry experts. private sector?
announced £3 billion ‘Plan for Jobs 2020’,2 and Stakeholders were consulted extensively
proposals from policy-makers, academics, throughout the preparation of this report.
investors and advocacy groups.3 These included policymakers in state and Are jobs being targeted at the right
territory governments as well as subject- industries and occupations?
Step 2: Selection criteria were identified based matter experts in industry, at universities and
on policy evaluations and economic research at peer advocacy organisations. Targeted Are jobs being targeted at the right
To be effective, stimulus policies should be The 12 policy opportunities highlighted in this regions?
high-impact, timely, and targeted. report demonstrate the ability of climate-
These criteria were chosen based on a review related policies to provide an efficient path to a Can the program be scaled rapidly for
of economic literature and policy evaluations. resilient economic recovery. It is recognised immediate job creation?
This includes broad reviews from the however that these are just some of the many
Organisation for Economic Co-operation and possible measures to support a transition to a
Timely Does the program create jobs in the
Development, International Monetary Fund, zero-emissions economy, and that other post-
COVID stimulus programs are needed to medium and long term?
Australian Treasury, and policy analyses from
the Australian National Audit Office. address priorities beyond the scope of the
policy opportunities in this report.
1European Commission (2019); Financial Times (2020) ‘Lagarde puts green policy top of agenda in ECB bond buying’. 2 HM Treasury (2020) A Plan for Jobs 2020.
3Several proposals for public clean stimulus programs have been made. See, for example, a review of policy options from the OECD (28 May 2020), a speech from
the IMF Managing Director (29 April 2020), an open letter by US academics (23 March 2020), analysis from McKinsey & Company (27 May 2020), and several others.
αlphaβeta | 11METHODOLOGY
Methodology: The jobs impact of each policy opportunity was estimated Illustrative analysis
based on the labour-intensity and potential scale of each option What sub-industries are used in this policy opportunity?
Labour intensity by relevant sub-industry
(Share of spending in policy by sub-industry in RHS bubble)
Step 4: Detailed economic analysis was Jobs = X1Y1 + X2Y2 + … + XnYn
conducted to estimate potential jobs impact
The formula above summarises the jobs impact
This report estimates the job creation potential calculation. For each industry relevant to a
of each policy opportunity by first identifying given policy opportunity (1 through to n), Xn Weighted
the industries that will be involved in delivering average, 2.5
represents the labour-intensity of each
it. Industries are identified from the goods and industry and Yn represents the scale of How much extra investment can be added in this sector?
services that would need to be directly investment. X was estimated based on ABS
Quarterly investments in Variable Renewable Energy (wind and
solar), by capacity (GW)
purchased to deliver each policy. For example, data showing the output and labour-intensity
a stimulus policy for installation of renewable of each detailed sub-industry in Australia.2 Y
energy will require buying goods and services was estimated based on the total amount of
(‘output’) from the construction, utilities, investment expected for each policy
professional services and other industries.1 The opportunity, which was in turn informed by
number of jobs created by each stimulus past experience and current capacity
option is a function of two things. constraints. For example, the rate of renewable
• First is the amount of additional goods and energy investments over the past few years
services that need to be purchased from together with recent rising costs and exchange- TOP: The labour intensity of each sub-industry is provided in ABS
relevant industries expressed in dollars rate risks informed our estimate of the
data. Imports are assumed to be 0 as there’s no direct domestic
(‘scale of investment’). employment. An average of this value across sub-industries,
potential rate of renewable energy investments weighted by their relevance to each policy opportunity, informed
• Second is the number of workers it takes over the next few years. The Appendix provides our estimates of the overall labour intensity of stimulus programs.
to produce a given quantity of goods and further detail on each policy opportunity. BOTTOM: The scope of investments possible for each policy was
services in that sector (‘labour intensity’). estimated based on historical experience, taking into account
current capacity constraints. See Appendix for detailed discussion
of scope estimates for each policy opportunity.
NOTE: The length of time any given job would last varies – for example, construction jobs tend to be temporary whilst operational jobs are ongoing. See Appendix
for a further discussion of how the quantification of jobs in this analysis compares to measures like “job years”. 1 Industries were defined in accordance with the
Australia New Zealand Standard Industry Classification (ANZSIC) system, as reported by the Australian Bureau of Statistics (ABS) at a sub-industry level. 2 ABS
(2020) 8155.0 Australian Industry, 2018-19, Australian industry by subdivision. This data source is used to estimate the number of workers required to produce a αlphaβeta 12
given level of output in each sub-industry. |The Clean Jobs Plan
2 12 policy opportunities that will put 76,000 Australians to work, reboot the
economy, and address long-term challenges
αlphaβeta || 13Twelve policy opportunities to deliver 76,000 jobs that re-engineer our energy system, renew industries and
restore our environment
Utility-scale renewable energy Ecosystem restoration Public and active transport
Install large-scale wind and solar generation Boost the ability of forest and wetland Accelerate construction of public and active
facilities, together with the associated ecosystems to absorb carbon through transport infrastructure, including new lines,
transmission upgrades and battery storage revegetation, amending irrigation systems, carriages, and system planning, along with
infrastructure. and changing usage patterns (e.g. through cycleways and walkways.
fencing).
Community-scale grid systems Organic waste management Retrofitting of public buildings
Build local energy infrastructure which can Expand the collection of food and garden Improve the energy efficiency of
generate, store and distribute energy organic waste, and build the processing government buildings by installing energy-
through independent local grids. facilities required to divert this waste from efficient devices and systems (e.g. heating,
landfill. ventilation and air-conditioning).
Green hydrogen Urban and peri-urban gardens Retrofitting of residential buildings
Fund pilot projects to install and test green Increase the amount of tree canopy cover in Improve the energy efficiency of households
hydrogen technology. urban areas, improve the usability of green by installing a combination of smart meters,
spaces, and fund urban agriculture projects. insulation, heat-pumps and glazing, along
with energy-efficient appliances.
Research Education and training Electric vehicle charging network
Directly fund research and development Enable the transition to a zero-emissions Install fast-charging ports in more locations,
which can enable long-term carbon economy by creating the required skills – including in new residential builds and on
abatement initiatives. through vocational education, workplace major highways to enable long-distance
training, and other adult re-skilling travel.
programs.
αlphaβeta | 14The Clean Jobs Plan prioritises high- Policy opportunity
High-
Targeted Timely
impact, targeted, and timely policies impact
Install additional utility-scale renewable energy
Install resilient community-scale grid systems
The Clean Jobs Plan prioritises a rapid, targeted recovery
from the economic impacts of COVID-19. A total of 12 Pilot green hydrogen projects
policy opportunities were selected based on their ability to
create jobs at scale (‘high-impact’), be targeted to those who Prioritise targeted ecosystem restoration projects
most need those jobs (‘targeted’) and delivered rapidly to
address Australia’s urgent need for jobs (‘timely’). These Expand coverage of urban and peri-urban gardens
three criteria ensure that the Clean Jobs Plan will quickly and
effectively create much needed jobs for Australia while Improve organic waste management
reducing emissions, lowering energy costs, protecting
ecosystems, and creating a healthier environment.1 Accelerate public and active transport infrastructure investments
Each of the proposed policies build on existing Australian Expand and improve the electric vehicle charging network
capabilities for ease of implementation. The Clean Jobs Plan
has been designed around practical opportunities, rather Retrofitting of public buildings to improve energy efficiency
than long-term, ‘blue sky’ proposals. Proposed policy
opportunities build on existing capabilities in Australia’s Retrofitting of residential buildings to improve energy efficiency
renewable energy, agricultural services, construction, and
professional services sectors. A conservative approach was Fund adult education and training to transition workers
taken to the selection and modelling of each option in order
to account for existing capacity constraints in the economy. Fund research to mitigate and respond to climate change
All 12 proposed policies may be implemented over the next
three years, beginning as soon as possible. Weak Strong
1See Appendix for discussion for why each of the policy opportunities was shortlisted for
evaluation, with a short rationale against each of the identified criteria.
αlphaβeta | 15HIGH IMPACT TARGETED TIMELY
The Clean Jobs Plan could create a Job creation potential of the Clean Jobs Plan
Estimated number of job openings created over three years, by opportunity
total of 76,000 jobs over three years
Utility-scale renewable energy 15,000
The 12 policy opportunities could generate 76,000 job
openings over three years. Large-scale infrastructure Ecosystem restoration 12,000
projects are expected to create the most jobs. These
include utility-scale renewable energy, public transport Public and active transport 12,000
and organic (food and garden) waste management.
Smaller-scale options such as research, training, and Organic waste management 10,000
select community-scale projects will create jobs rapidly 8,000
Retrofitting of public buildings
while also meeting long-term objectives of reducing
emissions and developing new industries. Job creation Retrofitting of residential buildings 7,000
would begin immediately and continue throughout the
three-year period.1 Urban and peri-urban gardens 6,000
The jobs creation potential is significant even
compared to pre-COVID levels of economic growth. Community-scale grid systems 2,000
The Clean Jobs Plan would create the equivalent of 1 in
Research 2,000
10 of all jobs produced even if the economy were to
grow at pre-crisis levels.2 This is a significant share, Education and training 1,000
especially considering that it counts only the direct
employment impacts. Even more jobs will be created Green hydrogen 500
through the indirect and induced effects of economic
stimulus.3 Electric vehicle charging network 500
NOTE: The number of jobs estimated to be created by each stimulus option is a function of (A) the labour-intensity of investments; and (B) the total scale of investments
1 See Appendix for discussion of estimated ‘job-years’ created. 2 Approximately 800,000 jobs were added in possible in each option. (A) was estimated based on ABS data (8155.0) which shows the labour-intensity of output at a detailed ANZSIC sub-industry level. The industry mix of
the three years to March 2020, see ABS 6202.0. 3 Indirect impacts flow through the supply chain in delivering each option is modelled based on the activity required to deliver the program. For example, the majority of work in the ‘Training and education’ category will be delivered by
each stimulus program. Induced impacts are the general rise in consumption as economic activity begets more ‘ANZSIC 82 Adult, community and other education’, which the ABS estimates needs 8.2 workers for every $1m of output. (B) are estimates based on publicly available data,
economic activity (e.g. someone employed by the stimulus chooses to spend more on entertainment). Such taking into account how much funding is needed and the potential supply constraints in delivering that funding. See next page and Appendix for further details.
impacts are difficult to establish with any great level of accuracy and have therefore been omitted from this
analysis. αlphaβeta | 16HIGH IMPACT TARGETED TIMELY
The Plan attracts on average an Investment by source for the Clean Jobs Plan
additional $1.10 in private investment Estimated total investment,1 public and private,2 $ billions
for every public dollar spent Public Private
The Clean Jobs Plan requires a modest level of public Utility-scale renewable energy 9.0
investment. In total, the 12 policy opportunities will
require less than 0.5% of Australian Gross Domestic Public and active transport 3.0
Product (GDP) in public funding. For comparison, total
Ecosystem restoration 2.0
stimulus following the Global Financial Crisis (GFC) was
~2% of GDP and currently announced COVID-19 Organic waste management 2.0
stimulus is already at ~3.5% of GDP.
Retrofitting of residential buildings 2.0
Policy opportunities would attract on average $1.10 in
private investment for every public dollar spent. This Retrofitting of public buildings 1.5
doubling of public investment is possible because
many initiatives are profitable to private businesses in Urban and peri-urban gardens 1.0
the long run. For example, private businesses will seek
Community-scale grid systems 0.5
to co-invest in profitable infrastructure projects (e.g.
renewable energy, organic waste processing) and add Research 0.3
their spending to partial subsidies (e.g. residential
retrofitting, training and education). Education and training 0.1
Specific levels of private funding will be determined Green hydrogen 0.2
by the design of each policy. Governments may
choose to contribute a larger share of funding for Electric vehicle charging network 0.1
certain policies – with access to historically low
borrowing costs, this may be a more cost-effective 1 The amount of investment for each option has been estimated by considering a range of factors, including the level of need or investment gap, the readiness of investment
design in many cases. options and capacity constraints (such as shortages in skilled labour or the lack of availability of the needed materials) that may limit supply in the economy. See Appendix for
details. 2 The share of financing provided by private-sector actors is estimated based off current financing mix for delivering similar policies. For example, private co-financing for
utility-scale renewable energy was estimated with reference to Australian Renewable Energy Agency (ARENA) and Clean Energy Finance Corporation (CEFC) projects.
αlphaβeta | 17HIGH IMPACT TARGETED TIMELY
The Plan creates jobs as efficiently as Job creation efficiency of select public direct expenditure programs
other direct expenditure programs Estimated direct jobs created per $1 million of public spending
High estimate Low estimate
The Clean Jobs Plan delivers an estimated 7.2 job Direct expenditure by governments can create
openings for every $1 million of public spending. Its jobs at different rates. An overview of recent
12 policy opportunities are relatively efficient job direct expenditure programs reveals that the
creators because they focus on labour-intensive Clean Jobs Plan would likely be of comparable
industries, leverage private co-financing, and avoid efficiency to available policy options.
capacity constraints – for example, skills or material
shortages – that may otherwise increase project costs. 9.0
Direct expenditure programs vary in how effectively 7.6 7.2
they create jobs. The wages of the newly employed
workers are not the only cost of stimulus programs. 5.2
4.3
They must also use funds to buy materials. Depending
on the nature of the project, this can be a significant
share of the total costs. The amount of ‘co-investment’
to multiply the impact of the public investment can
also vary. Direct Clean stimulus Clean Jobs Direct Direct
The job creation impact of the Clean Jobs Plan is expenditure (global Plan expenditure expenditure
comparable to that of other direct expenditure on social estimates)2 on local on large-scale
programs. It is difficult to directly compare stimulus services1 construction3 infrastructure4
outcomes due to the limited availability of reliable data 1 Estimates refer to National Disability Insurance Scheme. Calculation of job-creation efficiency was based on observing growth in ‘Aged and Disabled Carers’ and ‘Personal Care
and differences in timeframes, conditions and Workers’ (ABS 6291, EQ08 Employed persons by Occupation unit group of main job), along with growth in spending on the NDIS. 2 United Nations Environment Programme –
Global Green New Deal: an update for the G20 Pittsburgh Summit (2009); 1705 Loan program Mundaca and Richter (2015) Assessing ‘green energy economy’ stimulus packages:
objectives. However, a review of available robust data Evidence from the U.S. programs targeting renewable energy, Renewable and Sustainable Energy Reviews, vol. 42, February 2015; ILO – Stimulus Packages to Counter Global
Economic Crisis: A Review (2009). 3 Estimates refer to the Building the Education Revolution, a $16.2 billion stimulus program in Australia in response to the Global Financial Crisis.
suggests the Clean Jobs Plan would create jobs as Calculation of job-creation efficiency was based on project-level job creation reported in reviews of the program (see, for example, NSW Legislative Council (2010)) The Building
efficiently as comparable spending in Australia and the Education Revolution Program, and program evaluations (see Lewis, Dollery, and Kortt (2014)) Building the Education Revolution: Another Case of Australian Government
Failure?’, International Journal of Public Administration. 4 Average of projected job creation by project in state infrastructure plans.
overseas.
αlphaβeta | 18HIGH IMPACT TARGETED TIMELY
Jobs impact by industry
Job creation will focus on sectors hit hardest by the recent downturn Share of jobs created by proposed stimulus, %
RHS bubble: share of jobs lost from 14 March to 30
May, % 1
The proposed policy opportunities target suppliers to those that will be directly engaged Admin, support
37% -6.9
industries that have suffered steep job losses by the proposed policies. As a result, the Clean & logistics
from the COVID-19 crisis. Over one third of job Jobs Plan will support a wide range of
openings created by these stimulus options industries and a diverse range of workers: men
would be in administration, with an additional and women, young and old, and those with Construction 33% -5.8
third in construction. Since the outbreak of specialist and general skills.
COVID-19 in Australia, these industries have
lost 6.9% and 5.8% of jobs respectively (see Support for the administration and Engineering &
chart), representing ~80,000 workers in total. construction sectors will likely create 19% -3.6
prof. services
Without government support, these sectors significant flow-on effects. The two largest
are likely to experience further job losses as sectors of the Clean Jobs Plan represent a
business activity declines, and fewer new broad array of economic activity: from
projects begin. Agriculture 10% -9.5
managing supply chains to clerical data entry;
from residential electrical work to heavy civil
The stimulus will indirectly benefit other key engineering. These sectors tend to have long
industries such as manufacturing, retail and supply chains, meaning that each unit of Education 2% -4.4
hospitality. Jobs in the manufacturing, trade output needed from these sectors stimulates
(retail and wholesale) and hospitality sectors activity from other sectors across the
will be supported indirectly by the Clean Jobs economy.1
Plan. This is because firms in these sectors are SOURCE: ABS (2020) 6160.0 Weekly Payroll Jobs and Wages in Australia, 30 May 2020. NOTE:
The industry distribution of the jobs impact is modelled based on the activity required to deliver
the program. For example, the majority of work in the ‘Training and education’ category will be
delivered by ‘ANZSIC 82 Adult, community and other education’ workers. The above figures
reflect an average across all stimulus options.
1 ABS (2020) 5209, Table 5 Australian National Accounts: Input-Output Tables, 2017-18
αlphaβeta | 19HIGH IMPACT TARGETED TIMELY
Many new jobs will require minimal training, enabling rapid One in three job openings will require minimal
employment of COVID-impacted workers training
Share of job openings by average training
requirement of occupation, %
The Clean Jobs Plan prioritises work that can clerical roles. About a third of the job Under 12
20%
be deployed rapidly. A third of job openings openings will be for managers and months training
will be in occupations requiring either on-the- professional service workers. The remaining
job training or under 12 months of formal roles will be for machinery operators
education. This is not an estimate of training (including drivers), community workers and
requirements for implementing the stimulus salespeople.1 13%
On-the-job
as in many instances workers already
Training and careful transition will still be an
equipped with the relevant qualifications may
important part of successfully implementing
simply be hired. It does indicate however that
the Clean Jobs Plan. Historical experience in
the job openings from these stimulus options
Australia and elsewhere demonstrates that
will provide work for lower skilled workers. It Specialist roles 27%
the ability to transition workers to new sectors
also indicates that labour can be mobilised
and train them adequately is essential to the
rapidly where necessary.
success of stimulus polices.2 The scale and
content of the policies proposed in this Clean
The stimulus program will create jobs in a Jobs Plan is designed to avoid worker
broad range of occupations. Approximately shortages, and provide sufficient time for 1 - 3 years training 40%
half the jobs created will target labourers and training and effective transition.
NOTE: Estimates of training requirements are based on the occupation profile of the
industries in which the stimulus is being spent. They are not an estimate of the
operational requirements of the stimulus. For example, electrical systems engineers
1The occupation categories referred to here are according to the Australia and New Zealand Standard Classification of Occupations. 2 See, for example, the are classified as specialist roles as they require significant training – but existing
Australian National Audit Office review of the Home Insulation Program (2010) workers with those qualifications can be hired to deliver the relevant projects
without need for further qualification or training.
αlphaβeta | 20HIGH IMPACT TARGETED TIMELY
The proposed stimulus will have an equitable impact in cities, regions, Job openings by region
Share of job openings by location, %1
states and territories
The Clean Jobs Plan will create thousands of otherwise not exist, or may be slow to return. Regional
jobs in each state and territory. The Clean Jobs Regional areas may also have been particularly
Plan will provide a similar rate of job creation hard hit by COVID-19 due to their reliance on
across the country, creating between 2.5 and 4 the agricultural sector, which has shed ~9% of
jobs per 1,000 residents. Each of the 12 policy jobs since the start of the crisis.2
opportunities is able to be implemented in all 31,600
76,000 job
states and territories, and in many cases can be New jobs can be further targeted to local (42%)
openings
targeted to local areas. areas that need them most. Some policy from the Clean
opportunities can be locally targeted by rolling 44,400 Jobs Plan
The Clean Jobs Plan includes a strong focus on out in some areas before others. For example, Urban (58%)
regional areas that may otherwise not have a a state-wide organic waste collection and
private-sector led recovery. Approximately processing program could begin with pilot
four in ten (42%) job-openings created by the projects in certain local government areas first
Clean Jobs Plan will be in regional areas. This is if the economic need is highest there. Other
disproportionate in comparison to the share of policy opportunities can be locally targeted by
the workforce (a quarter) and households (a rolling out in some areas exclusively. For
third) in regional areas.1 Policy opportunities example, ecosystem restoration projects could
were selected deliberately to focus on these be limited to certain areas based on ecological
regions, where private investment may and economic need.
1 Estimate of geographical distribution of job openings based on distribution of
investment opportunity. Analysis accounts for the nature of the stimulus option (e.g.
urban gardens assumed to create jobs in urban areas only, ecosystem restoration
1 ABS (2020) 1410 Data by region, 2013 – 2018. 2 ABS (2020) 6160 Weekly Payroll Jobs and Wages in Australia, week ending 30 May 2020. assumed to be predominantly in regional areas etc.), the distribution of economic
activity and population by geography (e.g. a quarter of national workforce and third of
national households are outside capital cities).
αlphaβeta | 21Setting us up for the future
3 Clean jobs investments can be deployed rapidly and will set the stage for a
long-term, resilient recovery
αlphaβeta || 22The Clean Jobs Plan may be tailored to states and territories, Job losses by state
Share of jobs lost since COVID-19, %1
depending on local economic needs
Victoria -7.6%
All states and territories have seen steep job The set of 12 policy opportunities can be
losses of 4 – 8% since the onset of the COVID- tailored to meet different policy needs in each Tasmania -7.3%
19 crisis. The economic impact of COVID-19 state or territory. Some are high-impact job
has varied slightly across the country, creators which can be delivered at scale. For
Queensland -6.3%
depending on the scale of shutdowns required example, ecosystem restoration and organic
in each jurisdiction. However, no state or waste processing projects can hire large
territory has been spared from significant numbers of people into locally based -6.2%
ACT
economic disruption. programs. Some are more targeted but
financially efficient investments, either due to
The suitability of each policy opportunity will their potential to attract private funding (e.g. NSW -6.1%
depend on the circumstances of each state or residential retrofitting) or focus on labour-
territory. For example, ecosystem restoration is intensive activities (such as teaching and
more relevant in Queensland – with its large research). And some will be an especially good SA -5.7%
and diverse ecosystem and related industries fit for the policy priorities of each state or
like tourism – than, for example, in the territory.
Australian Capital Territory (ACT). The NT -4.7%
suitability of each policy opportunity also Governments can treat the Clean Jobs Plan as
varies according to how consistent it is with a starting point to consider practical and
current priorities in the state or territory. For immediate investments to create jobs and WA -4.4%
example, many states have already embraced mitigate climate risks. Governments across
urban greening projects which can be Australia can consider the Clean Jobs Plan as a
1 Calculated from 14 March till 13 June.
expanded through stimulus programs. starting point to design and develop an SOURCE: ABS (2020) 6160, Weekly Payroll Jobs and Wages in Australia, 30 June
effective stimulus program for their 2020.
jurisdictions.
αlphaβeta | 23Policy opportunities: New South Wales Top policy opportunities
Jobs & public
In New South Wales (NSW), the Clean Jobs Plan will Option Rationale
Investment
create an estimated 20,000 – 25,000 job openings across
its 12 policy opportunities.1 Major job creators include § High impact: Large job creation opportunity 7,000 – 8,000
building public and active transport infrastructure (7,000 Public and active
across skill levels in admin and construction, jobs
– 8000 job openings) and installing utility-scale transport
with abatement potential from a mode shift ($1.0b – 1.5b)
renewable energy (5,000 – 5,500).
Existing policies in NSW can strengthen the feasibility of Utility-scale § High impact: Large job creation opportunity 5,000 – 5,500
certain policy opportunities. For example, the NSW Net renewable in both low and high skill sectors, with an jobs
Zero Plan Stage 1 (2020 – 2030) prioritises interventions energy ability to leverage substantial private finance ($0.7b – 0.9b)
consistent with the policies in this report including the
diversion of organic waste from landfill, expanded R&D § Policy fit: Aligns with state’s target for net 2,500 – 3,000
Organic waste
funding, and installing renewable energy.2 zero emissions from organic waste by 2030, jobs
management
providing a substantial abatement benefit ($0.15b – 0.2b)
NSW has a pipeline of scoped infrastructure projects
which can help deliver some policy opportunities more
quickly. For example, the state has a large program of § Financially efficient: Able to rapidly mobilise 2,000 – 2,200
Ecosystem
public and active transport infrastructure which can be a large workforce including admin, forestry jobs
restoration
accelerated to create more jobs in the short-term.3 The and scientific services, at a low cost ($0.2b – 0.3b)
NSW Government has recently announced financial
support for Central West and New England Renewable § Financially efficient: Creates jobs at a 2,000 – 2,500
Residential
Energy Zones.4 relatively low cost in data collection, jobs
retrofitting
conducting energy audits and installation ($0.25b – 0.3b)
NSW also has a large and diverse workforce, making it
more feasible to deliver several of the identified policies.
1 Jobsimpact for states and territories were calculated based on modelling the nationwide job impacts of each policy
opportunity. A range, rounded to the nearest 100, is given to better represent the confidence of these more local
estimates. The extremes of the ranges do not sum to the national total since a high value in one state would be
consistent with a lower value in other states and vice versa. 2 NSW Government (14 March 2020), Net Zero Plan Stage αlphaβeta | 24
1: 2020 – 2030 3 NSW Government (2018) NSW Infrastructure Strategy 2018 – 2038. 4 NSW Government (2020)
Renewable Energy Zones.Policy opportunities: Victoria Top policy opportunities
Jobs & public
Option Rationale
In Victoria, the Clean Jobs Plan will create an estimated Investment
15,000 – 20,000 jobs across its 12 policy opportunities.
Major job creators include installing utility-scale Utility-scale § High impact: Large job creation opportunity 3,000 – 4,000
renewable energy (3,000 – 4,000) and organic waste renewable in both low and high skill sectors, with an jobs
management (2,000 – 2,500). energy ability to leverage substantial private finance ($0.5b – 0.6b)
Existing policies in Victoria can strengthen the feasibility
of certain policy opportunities. For example, the Zero § Policy fit: Aligns with state’s intention to 2,000 – 2,500
Organic waste
Net Carbon Homes pilot program is identifying ways to reduce waste to landfill and increase the jobs
management
improve residential energy efficiency through simple uptake of organic waste collection services ($0.1b – 0.15b)
retrofits such as installing smart meters as well as deeper
redesigns.1 Similarly, the City of Melbourne Green Our § High impact: Large job creation opportunity 2,000 – 2,200
Public and active
City Strategic Action Plan has made progress in across skill levels in admin and construction, jobs
transport
implementing urban and peri-urban gardens.2 The state’s with abatement potential from a mode shift ($0.3b – 0.4b)
ambitious Renewable Energy Target of 50% by 2030 can
be supported by installing additional renewable energy § Policy fit: Aligns with current ambition to 1,800 – 2,000
infrastructure. Urban and peri-
increase canopy cover and expand green jobs
urban gardens
Some large opportunities are less prominent in Victoria spaces to maintain health and liveability ($0.25b – 0.35b)
due to their geography. For example, there is less
opportunity for ecosystem restoration projects than in § Financially efficient: Able to create jobs at a
Education and 400 – 450 jobs
larger states like New South Wales, Queensland and very low cost in teaching and curriculum
training (< $0.05b)
Western Australia. However, Victoria has a large and development for climate-related fields
diverse workforce, making it more feasible to deliver
several of the identified policies.
1 SustainabilityVictoria (accessed May 2020), Zero Net Carbon Homes. 2 City of Melbourne (June 2017), Greening
our City Strategic Action Plan 2017 – 2021 αlphaβeta | 25Policy opportunities: Queensland Top policy opportunities
Jobs & public
Option Rationale
In Queensland, the Clean Jobs Plan will create an Investment
estimated 15,000 – 20,000 job openings across its 12
policy opportunities. Major job creators include § High impact: Creates jobs across skill levels 5,000 – 5,500
Ecosystem
ecosystem restoration and revegetation (5,000 – 5,500) in admin, forestry and scientific services and jobs
restoration
and installing utility-scale renewable energy (1,800 – has long-term abatement benefits ($0.5b – 0.6b)
2,200).
Utility-scale § High impact: Large job creation opportunity 1,800 – 2,200
Existing policies in Queensland can strengthen the
renewable in both low and high skill sectors, with an jobs
feasibility of certain policy opportunities. For example,
energy ability to leverage substantial private finance ($0.25b – 0.35b)
the Queensland Transition Strategy identifies ‘pathways
to a clean economy’ which leverage the state’s
reputation for innovation to deliver advances in § Financially efficient: Creates jobs for a 1,200 – 1,600
Residential
renewable energy innovation and adoption.1 relatively low cost in data collection, jobs
retrofitting
conducting energy audits and installation ($0.2b – 0.3b)
Queensland’s diverse ecosystems and large-scale carbon
sink – from old-growth forests and grasslands, to
complex marine ecosystems – all provide opportunities § Policy fit: Aligns with the Advance
150 – 200 jobs
for significant restoration and revegetation projects. Research funding Queensland initiative in support of climate-
(< $0.05b)
related R&D projects and solutions
The prominence of remote and regional communities in
the state may limit the effectiveness of some policies
§ Policy fit: Aligns with the state’s Hydrogen
due to localised skill shortages. Policies which can 100 – 150 jobs
Green hydrogen Industry Development Fund to create
therefore be locally tailored, such as residential (< $0.05b)
sustainable jobs in regional areas
retrofitting, or are targeted investments, such as green
hydrogen pilots, are more promising in this state.
1 Governmentof Queensland, Department of Environment and Heritage Protection (2018) Pathways to a clean
growth economy
αlphaβeta | 26Policy opportunities: Western Australia Top policy opportunities
Jobs & public
Option Rationale
In Western Australia (WA), the Clean Jobs Plan will create Investment
an estimated 8,000 – 10,000 job openings across its 12
policy opportunities. Major job creators include § Financially efficient: Able to rapidly mobilise 2,000 – 2,500
Ecosystem
ecosystem restoration (2,000 – 2,500) and installing a moderate workforce including admin, jobs
restoration
utility-scale renewable energy (1,000 – 1,500). forestry and scientific services, at a low cost ($0.2b – 0.3b)
Existing policies in WA can strengthen the feasibility of
Utility-scale § High impact: Moderate job creation 1,000 – 1,500
certain policy opportunities. For example, the
renewable opportunity in both low and high-skill jobs
Distributed Energy Resources (DER) Roadmap prioritises
energy sectors, with access to deep private finance ($0.15b – 0.2b)
creating an energy system that can adapt to the
increased prevalence of DER technologies like rooftop
solar and smart devices. Stimulus policies like expanding § High impact: Moderate job creation 1,000 – 1,200
Public and active
utility-scale renewable energy (including storage and opportunity across skill levels in admin, jobs
transport
transmission upgrades) and residential retrofitting can planning and heavy construction ($0.2b – 0.3b)
support the priorities identified in this roadmap.
WA also has a pipeline of scoped and announced large- § Financially efficient: Creates jobs for a
Residential 700 – 900 jobs
scale infrastructure investments which can be relatively low cost in data collection,
retrofitting ($0.05b – 0.1b)
accelerated to create more jobs in the short term. This conducting energy audits and installation
includes public transport upgrades to its rail cars and
extension of current lines.2 Australia’s biggest green § Policy fit: Aligns with the state’s Renewable
20 – 50 jobs
hydrogen plant was also recently announced in WA, Green hydrogen Hydrogen Fund to undertake capital works
(< $0.05b)
making the state a promising candidate for stimulus projects and further develop the industry.
programs that can leverage existing investments to
support the emergence of new industries.3
1 Government of Western Australia (December 2019) Distributed Energy Resources Roadmap
2 Government of Western Australia, Public Transport Authority (accessed May 2020) Projects 3 PV Magazine (29
April 2020), ‘Australia’s biggest green hydrogen plant secures initial investment’ αlphaβeta | 27Policy opportunities: South Australia Top policy opportunities
Jobs & public
Option Rationale
In South Australia (SA), the Clean Jobs Plan will create an Investment
estimated 5,000 – 7,000 job openings across the 12
policy opportunities. Major job creators include installing Utility-scale § High impact: Creates both low and high skill 2,000 – 2,500
utility-scale renewable energy (2,000 – 2,500) and renewable jobs and aligns with the state’s target to be jobs
ecosystem restoration (700 – 800). energy 100% renewable by 2030 ($0.3b – 0.4b)
Existing policies in SA can strengthen the feasibility of
§ Financially efficient: Creates jobs across skill
certain policy opportunities. For example, the Blue Ecosystem 700 – 800 jobs
levels in admin, agriculture and scientific
Carbon Strategy for South Australia aims to protect and restoration ($0.05b – 0.1b)
services for a relatively low cost
restore SA’s extensive coastal ecosystems and has
already identified a program of work which can be
accelerated with additional stimulus spending.1 The state § Financially efficient: Creates jobs at a
Residential 400 – 600 jobs
is currently developing an updated Climate Change relatively low public cost to address peak
retrofitting ($0.05b – 0.07b)
Strategy, due to be released in mid-2020. demand challenges faced by the state
South Australia has also been a prominent site of recent
innovative activity. For example, the state’s first super- § Policy fit: Capitalises on existing
Green hydrogen 100 – 200 jobs
fast electric vehicle (EV) charger was installed earlier this infrastructure to further existing competitive
facilities (< $0.05b)
year, an important addition to serve EV transport advantage and hydrogen strategy
between Melbourne and Adelaide.2 Similarly, SA has for
several years sought to position itself as a global hub for § Policy fit: Aligns with the state’s electric
EV charging 30 – 50 jobs
green hydrogen.3 vehicle strategy to shift transport energy
networks (< $0.05b)
demand and use abundant renewable energy
1 Government of South Australia, Department for Environment and Water (accessed June 2020), Climate
Change Change Strategy and Blue Carbon Strategy 2 Chargefox (2020), ‘Chargefox opens South Australia’s first
ever ultra rapid EV charging station in Keith’ 3Government of South Australia (August 2018), South Australia’s
Hydrogen Action Plan.
αlphaβeta | 28You can also read