China's 14th Five-Year Plan: First Impressions - NUS Research
←
→
Page content transcription
If your browser does not render page correctly, please read the page content below

EAI COMMENTARY                         No. 26     11 March 2021

  China’s 14th Five-Year Plan:
      First Impressions
                                                                              By Bert HOFMAN

T        he “Two Sessions” are the highlights of China’s politics. Postponed last year to
         May due to the coronavirus epidemic, this year it took place as usual in early March.
         There are not one but two congress meetings in the Great Hall of the People on
Tiananmen Square in Beijing, namely, the Chinese People’s Political Consultative Conference
and the National People’s Congress (NPC). The highlight was Premier Li Keqiang’s
Government Work Report, followed by The Planning Report and Budget Report delivered to
the NPC.

The most anticipated document was, however, the 14th Five-Year Plan (FYP), or to use the
full title, the “(Draft) Outline of the 14th Five-Year Plan (2021-2025) for National Economic
and Social Development and the Long-Range Objectives Through the Year 2035”. At its Fifth
Plenum of the 19th Party Congress last October, the Chinese Communist Party had provided
its guidelines for the Plan (I wrote about it here) so it was not a complete surprise what was in
the document released on 5 March 2021. The Draft Plan provides many more in its 140 pages,
15 main sections and 65 chapters of details to be exact. This was less than the 13th FYP, which
consisted of 20 sections and 80 chapters, a meaty read nevertheless. A quick glean of the main
objectives of the Plan is however provided in the form of a table (Table 1), which contains the
main indicators and targets of the Plan, and provided here in translation (the Plan is only
available in Chinese at this point).

First, what is starkly missing is the growth target for the five-year plan period. In the 13th FYP
the target was 6.5% per year on average. This target was, with some recent revision in historical
data, still achieved, despite the meagre 2.3% growth in 2020. Of course, the 2.3% GDP growth
was still stellar performance when compared with that of most other countries. The absence
of a growth target for the 14th FYP could reflect a trend towards de-emphasising growth, as
has happened in recent years. Growth targets, even if “indicative” can force policymakers to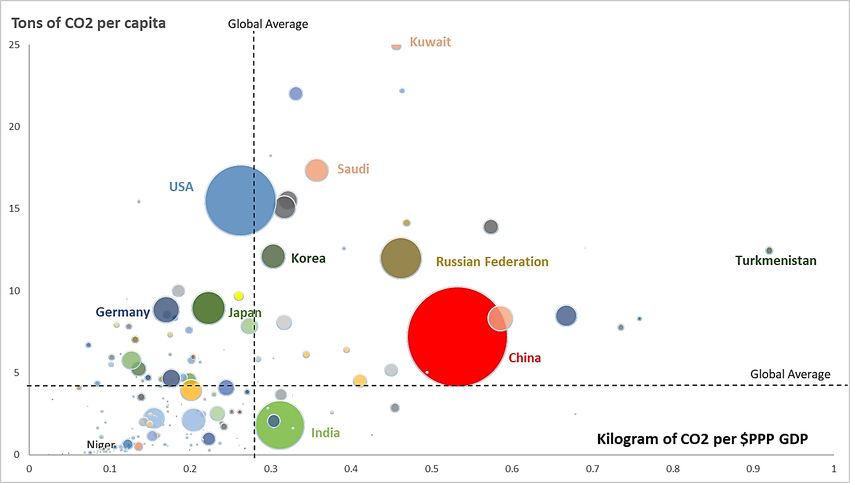
EAI COMMENTARY
    pursue too expansionist policies, which could lead to undue debt built up and risks in the
    financial system. It could also undermine the goal of rebalancing the economy as China’s
    policymakers are inclined to stimulate investment and exports rather than consumption, as was
    the case in the COVID-19 downturn last year.

     TABLE 1         MAIN INDICATORS OF ECONOMIC AND SOCIAL DEVELOPMENT
                       DURING THE "14TH FIVE-YEAR PLAN" PERIOD
  Category                    Indicator                 2020     2025      Annual average/ [cumulative]          Nature
                                                                          Keep it within reasonable
                  Gross domestic product (GDP)
                                                       2.3       --       Interval, each year depends on        Indicative
                  growth (%)
Economic                                                                  the situation
development       Labour productivity growth
                                                       2.5       --       Higher than GDP growth                Indicative
                  (%)
                  Urbanization rate (%)                60.6*     65                                             Indicative
                                                                          Growth > 7%. Aim for a higher
                  Growth in R&D spending               --        --       share in GDP than under the           Indicative
                                                                          13th Plan (2.2% of GDP)
Innovation        Number of innovation patents
                                                       6.3       12                                               Indicative
                  per 10,000 people
                  Digital Economy share of GDP 7.8               10                                               Indicative
                  Growth in disposable income          2.1       --       In line with GDP                        Indicative
                  Urban (survey) unemployment
                                                       5.2       650mn. tons                            Binding
 Security/        production capacity
 Safety           Comprehensive energy
                                                                          >4.6bn. tons of coal equivalent         Binding
                  production capacity
Source: Draft 14th Five-Year Plan, Note: ① [] is the cumulative number in five years. ②The data with * are for 2019. ③
Comprehensive energy production capacity refers to coal, petroleum, natural gas and non-fossil energy production
capacity. ④ The ratio of days with good air quality and surface water in cities at prefecture level and above in 2020. The
index value of the proportion of water bodies reaching or better than Class III is affected by factors such as the new crown
pneumonia epidemic, which is significantly higher than normal years. ⑤ All employees in 2020; labour productivity
growth of 2.5% is expected.
EAI COMMENTARY The absence of a target is also a reflection of an awareness that setting a growth target for the next five years may simply be too hard, or too politically risky at a time of uncertainties in the global economy still affected by COVID-19 and the Trump legacy which will take time to undo. Instead, the Plan promises a growth target for every year, “within a reasonable interval depending on the situation”. For next year, the Government Work Report did set a target—six per cent or more—but that already is in the bag: if China were to maintain its 2020 fourth- quarter GDP level it would reach six per cent growth for the year. Second, the number of indicators, and in particular the number of binding indicators, is down. The 12th FYP targeted 24 high-level objectives and the 13th FYP had 25, of which 14 were “obligatory” (binding) ones. The targets for the draft 14th FYP were down to 20, of which eight were binding. In particular, there was a cut-back in the number of indicators in the area of local environment as well as a cut-back from the 13th FYP in the level of local pollution reduction targets set for pre-existing ones. Granted that some targets of the 13th FYP are now redundant, such as the obligatory target on poverty reduction, which was fully met and celebrated with much fanfare last week, and in broadband access where the numbers are now so high that setting a target would hardly matter. In other areas of priority, though, the level of ambition seems modest—such as in Research and Development, an area in which the 2.5% of GDP spending for the 13th FYP was missed (it turned out 2.3%) and now replaced with a (presumably nominal) increase of seven per cent per year, which should be easily met. On climate change, the Plan was eagerly anticipated because it could provide a first glimpse into how China would plan to meet President Xi Jinping’s commitment to net zero emissions by 2060. Although the commitment was repeated in the Plan and the Government Work Report, the focus was still on the Paris Accord target to peak carbon by 2030 and to reduce carbon intensity of the economy by 18% in the coming five years, a target identical to that set under the 13th FYP. This means that total greenhouse gas emission will most likely continue to increase: assuming an average growth rate of five per cent in the coming five years, China would add a further 10% in emissions by 2025. While this is fully compatible with the Paris agreement, it remains to be seen whether this would be enough to get China on a net-zero track in time. China has been the largest greenhouse gas emitter in the world for some time now (Figure 1), emitting more than twice the volume of CO2 of the United States. In per capita terms, though, it is still well behind the United States, even though it is now above the average per capita emissions globally. In terms of emissions per unit of GDP, a measure of efficiency, China has been improving rapidly, in line with its nationally determined contribution to the Paris Agreement. Nevertheless, it is still higher than the global average at this stage. For the coming year, Premier Li Keqiang promised a plan for meeting the Paris Agreement goals, but not the net zero goal; the 14th FYP also gave no indication as to whether a plan for net zero is in the making. The only inkling was in the target for energy intensity, a main driver of greenhouse gas emissions, which was set a notch below that of the 13th FYP. Another upside was Xie Zhenhua, China’s official who helped broker the Paris agreement, who is back as China’s climate envoy, a move that could improve cooperation with the United States, the other big player that is back in the Paris Agreement. Another possible indicator could be the focus on carbon capture and storage, a critical technology to make the existing net zero commitments of many countries work, but one that needs innovation and scale to become economically viable.
EAI COMMENTARY
                                  FIGURE 1         GLOBAL CARBON EMISSIONS

  Source: World Development Indicators. Note: Size of bubble reflects total CO2 Emissions. Data for 2016 (the most recent year
  available).

A final area highly anticipated and of global importance is China’s plans for science,
technology and innovation. As part of the overarching “Dual Circulation” strategy, China has
announced its intentions to rely more on “indigenous innovation” and to aim for breakthroughs
in foundational technologies, an area in which it is more dependent on foreign knowledge. It
is in this area that Chinese companies proved to be most vulnerable to actions taken by the US
government under Trump—measures that have yet to be reversed. The 14th FYP doubles down
on efforts to reduce such dependence. While the target on increases in R&D spending is modest
(seven per cent growth, which should be easily met), the plans are not.

No doubt, more detail will be included in the forthcoming Medium to Long Term Plan for
Science and Technology 2021-35, but the 14th FYP document is already filled with initiatives,
policies and programmes to beef up research and development. This ranges from founding new
or improving existing national laboratories in critical areas, to supporting regions such as
Beijing, Shanghai and the Greater Bay Area to develop science and technology platforms, to
setting up centres for technology transfers from research centres to enterprises, to promoting
R&D talent and encouraging immigration of scientists, and to catalysing technology
cooperation among enterprises, and so on. In total, even with the exclusion of the chapter on
New Infrastructure (which is also innovation-filled) the Plan devotes seven chapters to Science,
Technology and Innovation, three more than the 13th FYP, plus another four on digital
development.

The Plan also pledges to increase spending on basic research, a traditionally weaker area for
China. By the end of the 14th FYP, China aims to spend eight per cent of its R&D on basic
research, up from some 5.5% currently according to the OECD. This is only one third the share
that the United States and Korea spend on basic research, and half that of Japan’s. Despite
recent increases in spending, China is still behind in other ways: R&D is not just a matter of
spending, but a matter of spending it well and delivering commensurate value. Figure 2
compares cumulative R&D spending of China with other countries. From this perspective,
EAI COMMENTARY
China still has a lot to catch up: in current dollars, it spends about half that of the United States
(which is close to equal amounts in comparable prices), but in cumulative terms it has spent
only about one-sixth.
Although the plan mentions the need for international cooperation in science and technology,
a move that would clearly benefit China and the rest of the world, China’s plans for indigenous
technology development are likely to be controversial internationally. Perhaps unnecessarily
so as China is one of the few countries that brings its plans together in one place. Countries
around the world have their own technology policies and a growing number has been pursuing
industrial policies in light of disappointing economic performance since the global financial
crisis, but these policies are often captured in a multitude of policies and programmes. The
challenge for China and other countries is to keep the instruments with which they pursue such
policies compatible with an open, market based on an international economic system. WTO
reforms, now under the excellent leadership of my former colleague at the World Bank, Ngozi
Okonjo Iwaela, would certainly help to regulate intensifying technological competition.
FIGURE 2 SPENDING ON RESEARCH AND DEVELOPMENT CUMULATIVE, 1996-2018
(CONSTANT 2010 USD BN.)
Source: World Bank World Development Indicators. Note: Spending is depreciated at five per cent per year, reflecting the gradual
outdating of acquired knowledge.
Bert HOFMAN is Director of the East Asian Institute and Professor in Practice of the Lee Kuan Yew School of
Public Policy at the National University of Singapore.
EAI commentaries serve to provide quick insights on current topics, based on ongoing research. The opinions expressed in the
commentaries are those of the authors and do not necessarily reflect those of the East Asian Institute, or its Board Members.You can also read