Cheniere Earnings Presentation - Fourth Quarter and Full Year 2021 - Amazon AWS
←
→
Page content transcription
If your browser does not render page correctly, please read the page content below

Cheniere Earnings Presentation
Fourth Quarter and Full Year 2021

February 24, 2022

NYSE American: LNG
Safe Harbor Statements
Forward-Looking Statements
This presentation contains certain statements that are, or may be deemed to be, “forward-looking                   •   statements that our Trains, when completed, will have certain characteristics, including amounts of liquefaction
statements” within the meaning of Section 27A of the Securities Act of 1933, as amended, and Section 21E               capacities;
of the Securities Exchange Act of 1934, as amended. All statements, other than statements of historical or         •   statements regarding our business strategy, our strengths, our business and operation plans or any other plans,
present facts or conditions, included or incorporated by reference herein are “forward-looking                         forecasts, projections or objectives, including anticipated revenues, capital expenditures, maintenance and operating
statements.” Included among “forward-looking statements” are, among other things:                                      costs, free cash flow, run rate SG&A estimates, cash flows, EBITDA, Consolidated Adjusted EBITDA, distributable cash
• statements regarding the ability of Cheniere Energy Partners, L.P. to pay or increase distributions to its           flow, distributable cash flow per share and unit, deconsolidated debt outstanding, and deconsolidated contracted
    unitholders or Cheniere Energy, Inc. to pay or increase dividends to its shareholders or participate in            EBITDA, any or all of which are subject to change;
    share or unit buybacks;                                                                                        •   statements regarding projections of revenues, expenses, earnings or losses, working capital or other financial items;
• statements regarding Cheniere Energy, Inc.’s or Cheniere Energy Partners, L.P.’s expected receipt of             •   statements regarding legislative, governmental, regulatory, administrative or other public body actions, approvals,
    cash distributions from their respective subsidiaries;                                                             requirements, permits, applications, filings, investigations, proceedings or decisions;
• statements that Cheniere Energy Partners, L.P. expects to commence or complete construction of its               •   statements regarding our anticipated LNG and natural gas marketing activities;
    proposed liquefied natural gas (“LNG”) terminals, liquefaction facilities, pipeline facilities or other        •   statements regarding the COVID-19 pandemic and its impact on our business and operating results, including any
    projects, or any expansions or portions thereof, by certain dates or at all;                                       customers not taking delivery of LNG cargoes, the ongoing creditworthiness of our contractual counterparties, any
• statements that Cheniere Energy, Inc. expects to commence or complete construction of its proposed                   disruptions in our operations or construction of our Trains and the health and safety of our employees, and on our
    LNG terminals, liquefaction facilities, pipeline facilities or other projects, or any expansions or portions       customers, the global economy and the demand for LNG; and
    thereof, by certain dates or at all;                                                                           •   any other statements that relate to non-historical or future information.
• statements regarding future levels of domestic and international natural gas production, supply or
    consumption or future levels of LNG imports into or exports from North America and other countries
                                                                                                                   These forward-looking statements are often identified by the use of terms and phrases such as “achieve,” “anticipate,”
    worldwide, or purchases of natural gas, regardless of the source of such information, or the
                                                                                                                   “believe,” “contemplate,” “continue,” “could,” “develop,” “estimate,” “example,” “expect,” “forecast,” “goals,” ”guidance,”
    transportation or other infrastructure, or demand for and prices related to natural gas, LNG or other
                                                                                                                   “intend,” “may,” “opportunities,” “plan,” “potential,” “predict,” “project,” “propose,” “pursue,” “should,” “subject to,”
    hydrocarbon products;
                                                                                                                   “strategy,” “target,” “will,” and similar terms and phrases, or by use of future tense. Although we believe that the
• statements regarding any financing transactions or arrangements, or ability to enter into such                   expectations reflected in these forward-looking statements are reasonable, they do involve assumptions, risks and
    transactions;                                                                                                  uncertainties, and these expectations may prove to be incorrect. You should not place undue reliance on these forward-
• statements relating to Cheniere’s capital deployment, including intent, ability, extent, and timing of           looking statements, which speak only as of the date of this presentation. Our actual results could differ materially from
    capital expenditures, debt repayment, dividends, and share repurchases;                                        those anticipated in these forward-looking statements as a result of a variety of factors, including those discussed in
• Statements regarding our future sources of liquidity and cash requirements;                                      “Risk Factors” in the Cheniere Energy, Inc. and Cheniere Energy Partners, L.P. Annual Reports on Form 10-K filed with the
• statements relating to the construction of our proposed liquefaction facilities and natural gas                  SEC on February 24, 2022, which are incorporated by reference into this presentation. All forward-looking statements
    liquefaction trains (“Trains”) and the construction of our pipelines, including statements concerning the      attributable to us or persons acting on our behalf are expressly qualified in their entirety by these ”Risk Factors.” These
    engagement of any engineering, procurement and construction ("EPC") contractor or other contractor             forward-looking statements are made as of the date of this presentation, and other than as required by law, we
    and the anticipated terms and provisions of any agreement with any EPC or other contractor, and                undertake no obligation to update or revise any forward-looking statement or provide reasons why actual results may
    anticipated costs related thereto;                                                                             differ, whether as a result of new information, future events or otherwise.
• statements regarding any agreement to be entered into or performed substantially in the future,
    including any revenues anticipated to be received and the anticipated timing thereof, and statements           Reconciliation to U.S. GAAP Financial Information
    regarding the amounts of total LNG regasification, natural gas, liquefaction or storage capacities that        The following presentation includes certain “non-GAAP financial measures” as defined in Regulation G under the
    are, or may become, subject to contracts;                                                                      Securities Exchange Act of 1934, as amended. Schedules are included in the appendix hereto that reconcile the non-
• statements regarding counterparties to our commercial contracts, construction contracts and other                GAAP financial measures included in the following presentation to the most directly comparable financial measures
    contracts;                                                                                                     calculated and presented in accordance with U.S. GAAP.
• statements regarding our planned development and construction of additional Trains or pipelines,
    including the financing of such Trains or pipelines;
         2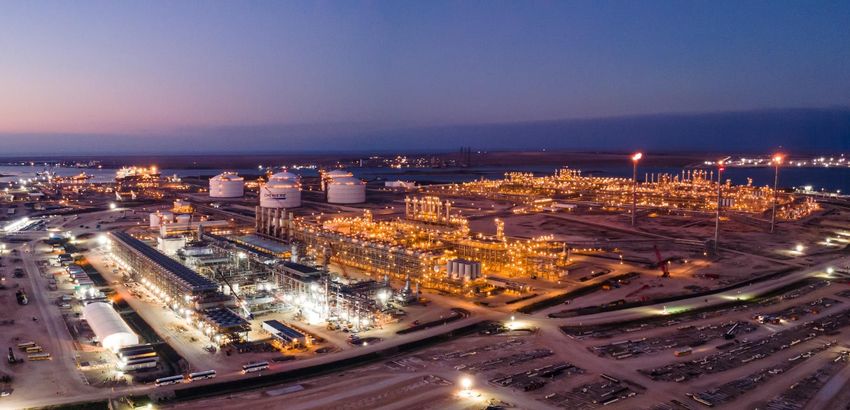
Agenda

    Introduction         Randy Bhatia
                         Vice President, Investor Relations

    Company Highlights   Jack Fusco
                         President and Chief Executive Officer

    Commercial Update    Anatol Feygin
                         Executive Vice President and Chief Commercial Officer

    Financial Review     Zach Davis
                         Executive Vice President and Chief Financial Officer

    Q&A

3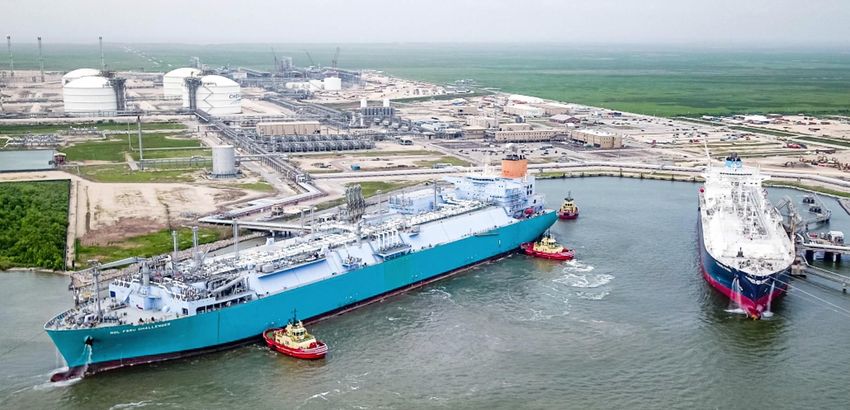
Operating and Financial Highlights
Jack Fusco, President and CEO
Fourth Quarter 2021 Highlights and 2022 Guidance Update
    Consolidated Adjusted EBITDA                                   Financial Guidance
                         Midpoint of initial
                                                                    ($ billions, except per unit data)
                                                                                                                                                       Initial FY 2022                                    Revised FY 2022
                         guidance range

                                                                    Consolidated Adjusted EBITDA                                                  $5.8          -            $6.3                    $7.0            -         $7.5
                                               $4,867
                                $3,961
                                                                    Distributable Cash Flow                                                       $3.1          -            $3.6                    $4.3            -         $4.8
    $1,052        $1,339
     4Q 20         4Q 21         FY 20          FY 21               CQP Distribution per Unit                                                   $3.00           -          $3.25                   $4.00             -        $4.25

         Distributable Cash Flow
                                                                                     Long-Term SPAs signed with                                                                   Executed on Comprehensive
                                                                                     Sinochem, Foran & EOG                                                                        Long-Term Capital Allocation Plan
                        Midpoint of initial
                        guidance range
                                                                                             0.9-1.8 MTPA on FOB basis for ~17.5                                    ✓ $1.2 billion of debt repayment in 2021
                                               ~$2,020                                       years beginning July 2022                                              ✓ $0.33/share inaugural quarterly dividend paid in
                               ~$1,350                                                                                                                                November
    ~$330         ~$540                                                                      0.3 MTPA on DES basis for ~20 years                                    ✓ Over 100,000 shares repurchased
                                                                                             beginning January 2023
      4Q 20        4Q 21         FY 20          FY 21                                                                                                               ✓ Corpus Christi Stage 3 FID expected in 2022
                      Net Loss                                                               2.55 MTPA IPM for ~15 years post                                       ✓ CQP Base + Variable Distribution starting 1Q’22
                                                                                             CCL Stage 3 completion
    ($194)                       ($85)                                                                                                                                            Substantial Completion of
                 ($1,323)                                                            153 Cargoes Exported
                                                                                                                                                                                  Sabine Pass Train 6
                                               ($2,343)
                                                                          Exported record number of cargoes during the                                              ✓ First LNG achieved on November 23, 2021
                                                                          fourth quarter from our liquefaction platform                                             ✓ First Cargo produced December 7, 2021
     4Q 20         4Q 21         FY 20          FY 21
                                                                                                                                                                    ✓ Substantial Completion achieved on February 4,
                                                                                                                                                                      2022

    Note: $ in millions unless otherwise noted. Net income as used herein refers to Net income attributable to common stockholders on our Statement of Operations. Consolidated Adjusted EBITDA and Distributable Cash Flow
5
    are non-GAAP measures. A definition of these non-GAAP measures and a reconciliation to Net income attributable to common stockholders, the most comparable U.S. GAAP measure, is included in the appendix.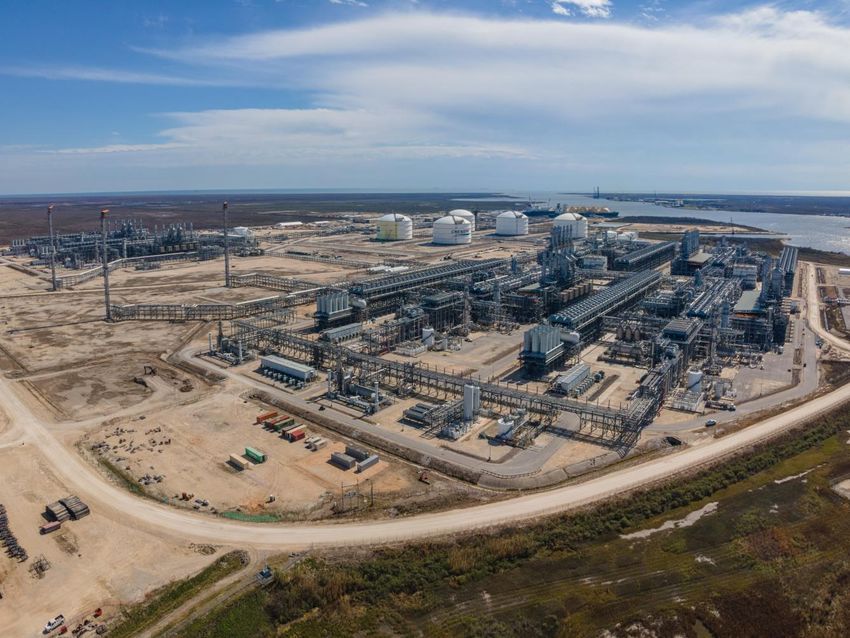
The Power of the Cheniere Platform
                                                                                                                                                                                                  Sabine Pass Train 6
                                                                            Construction                                         P       Corpus Christi Train 3
                                                                                                                                         Substantial Completion                          P        Substantial Completion
                                                                             Milestones
                                                                                                                                           All 9 trains completed ahead of schedule and within budget

                                                                                       2021                                     ~$4.9 Billion Adjusted EBITDA                          ~$2.0 Billion Distributable Cash Flow
                                                                                        Execution                               Record 566 cargoes & >2,000 Tbtu                       ~40% reduction in Total Reportable
                                                                                         Excellence                             exported                                               Incident Rate (TRIR)

                                                                                                                                                                               2021                                           2022

                                                                                          Commercial                           Long-Term
                                                                                                                               Contracts
                                                                                          Momentum                             Signed

                                                                                                                                $1.2 Billion debt paydown                                      BB+ ratings upgrades at CEI & CQP
                                                                                         Capital                                $1 billion 3-yr share repurchase authorization Stage 3 FID expected in 2022
                                                                                        Allocation                              $0.33/sh inaugural quarterly dividend                          CQP Base + Variable Distribution

                                                                                                                             P Published LCA                             P TCFD-aligned Climate Scenario Analysis
                                                                              Climate &
                                                                             Sustainability
                                                                                                                             P QMRV Collaboration                        P Announced Cargo Emissions Tags
                                                                                                                             P Carbon Neutral Cargo                      P CR Report
    Note: $ in millions unless otherwise noted. Net income as used herein refers to Net income attributable to common stockholders on our Statement of Operations. Consolidated Adjusted EBITDA and Distributable Cash Flow
6
    are non-GAAP measures. A definition of these non-GAAP measures and a reconciliation to Net income attributable to common stockholders, the most comparable U.S. GAAP measure, is included in the appendix.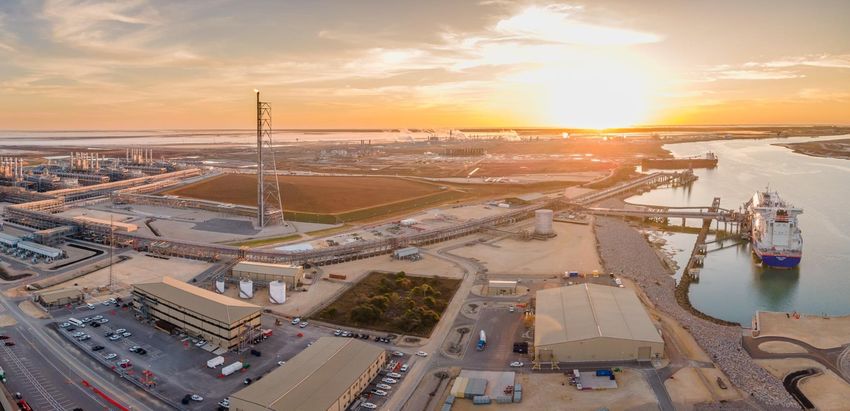
2022 Priority Goals

          DELIVER ON REVISED                                 FID CORPUS CHRISTI                             LEAD ON ACTIONABLE ESG
         FINANCIAL GUIDANCE                                        STAGE 3                                        INITIATIVES
    Continued operational excellence across platform   Finalize EPC contract with Bechtel                 Begin providing cargo emissions (“CE”) tags for
                                                                                                          each cargo produced at our facilities
    Manage volatility through CMI portfolio            Finalize Stage 3 long-term contract portfolio
    optimization                                                                                          Leverage size and scale to build upon initiatives
                                                       Arrange debt financing with lenders aligned with   to increase transparency of emissions across LNG
    Execute on capital allocation plan                 capital investment parameters                      value chain
                                                                                                          Continue to focus on DEI and community giving
                                                                                                          efforts

7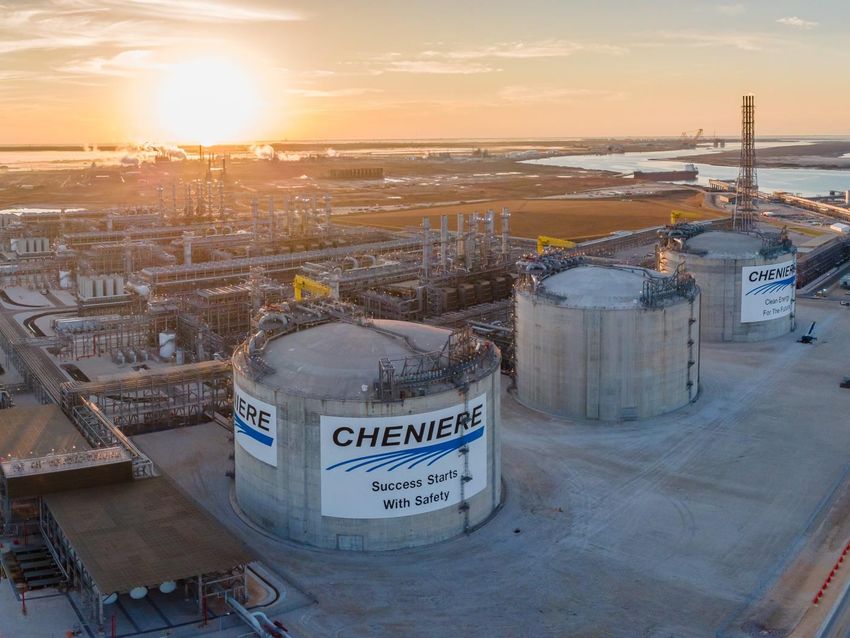
Commercial Update
Anatol Feygin, EVP and CCO
Global LNG Trade Exceeds Pre-Pandemic Levels
Global LNG Demand Global LNG Supply Annual Change (2021 – 2020) Monthly Price vs. Daily Move
Global LNG consumption rose ~5% in 2021, amid intense Annual global exports back to pre-pandemic levels, due JKM & TTF saw unprecedented spikes and volatility in Q4
regional competition and limited new supply availability primarily to US growth amid increased competition for cargoes
$/MMBtu
MT MT $40
+5.1% yoy
400 MENA Americas 25 $30
JKM Monthly Price TTF Monthly Price
374 JKM Daily Move TTF Daily Move
Europe Asia
356 356 -3% $20
20.8
350 +44% $10
20
317
$0
United States +~23.1 MT yoy
291 -9%
300 ($10)
263 Rest of World -2.3 MT yoy
15 ($20)
247
250 12.3
10.9
10
United States LNG Flows by Destination
200
Strong European demand drove US LNG exports to record
levels in December
MT
150 9 Asia
5
+8%
2.6
Europe
100 6
0
Americas
-0.3 3
50
Middle East – North Africa
0
(5) -4.5
0 1Q 2Q 3Q 4Q 1Q 2Q 3Q 4Q 1Q 2Q 3Q 4Q
Net Supply Cheniere Rest of US Australia Russia Rest of
2015 2016 2017 2018 2019 2020 2021
World 2019 2020 2021
9 Source: Cheniere Research, Kpler, Bloomberg
LNG Provides Relief to Tight Markets
Europe LNG Imports EU Gas Storage Surplus / Deficit vs. TTF Asia LNG Imports
European imports rebounded in Q4 as tight balances TTF prices reached new highs attracting cargoes away from While Q4 was flat yoy, Asian imports were up ~8% yoy in 2021
supported demand, while 2021 imports were down ~9% yoy Asia in Q4 to support demand as storage deficit widened as China resumed growth and cool temps stimulated demand
MT Bcm $/MMBtu MT
10 5-Yr Range 30
60 60 5-Yr Range
2021 Gas in Storage vs 5-Yr Avg 2020
8 2020 40 TTF Daily 40 25 2021
6 20 20
20
4 0 0
(20) (20) 15
2
(40) (40)
0 10
Jan Apr Jul 2020 Oct Jan Apr Jul 2021 Oct
Jan Feb Mar Apr May Jun Jul Aug Sep Oct Nov Dec Jan Feb Mar Apr May Jun Jul Aug Sep Oct Nov Dec
2020 2020 2020 2021 2021 2021
US Share of European Quarterly Imports Europe Gas Supply Variance 2021 vs. 2020 Asia LNG Imports 2021 vs. 2020
US became the top LNG supplier to Europe in 2021 Low Russian gas flows to Europe exacerbated the market China drove Asia’s LNG growth with support from S. Korea
imbalance amid tight global LNG supply for most of 2021 and S.E. Asia, amid a decline from price sensitive S. Asia
MT Share in % Bcf/d MT
US share of European LNG imports
25 31% 35% 2 280
28% 26% 1.2 1.4
30%
20 1 0.6 0.7
260
22%
25%
15 20% 0
240
273
10 15% (1) 254
-1.0 -0.9 220
10%
5 (2) -1.6
5%
Russia LNG Production Norway Azerbaijan Africa Gross 200
0 0% Pipe Imports Pipe Pipe Pipe Russia to 2020 China Japan South Taiwan India Other 2021
Q1 Q2 Q3 Q4 (ex Turkey) Turkey Korea Asia
10 Source: Cheniere Research, Kpler, BloombergLNG Market Environment Supports Long-Term Contracts
LNG Contracts Signed Annually Long-term Gulf Coast Margins
Contract activity picked up in 2021, with volume for mid- and long-term deals up ~80% Gulf Coast margins through 2024 have significantly increased since September 2021
mtpa Price assumed linked to Henry Hub or US Hub $30.00 Historical USGC Margin
60
Forward USGC Margin as of 9/30/21
50 $25.00
Forward USGC Margin as of 12/31/21
13.8
40 $20.00 Forward USGC Margin as of 2/18/22
$/mmbtu
30 $15.00
6.7
20 38.2 $10.00
10 22.3
$5.00
0
$0.00
2020 2021
Jan-21 Jul-21 Jan-22 Jul-22 Jan-23 Jul-23 Jan-24 Jul-24
2021 Contracts Breakdown by Supplier Long-term Contract Expiry 2021-30
Contract activity was dominated by the US with 45% of total global deals A significant portion of contracts expected to expire by 2030, supporting next cycle
mtpa US Contracts by Market mpta
60 100
Majors /
50 Portfolio
Portfolio/Other, 12.5 80
players
40
18% China 60
30 US= 45% Other US, 17.0 Other 38%
of total 15% 40
20 Cheniere, 6.4 Trading
Houses 20
10
Qatar, 16.0
29%
0 0
Supplier Asian Buyers Aggregators & Others European Buyers
Source: Cheniere Research
11 Contracts include firm SPAs with minimum tenors of 5 years or more.Financial Update Zach Davis, EVP and CFO
Fourth Quarter and Full Year 2021 Financial Highlights
Summary Results
                                                                                                                                                   ✓ Record ~$4.9 billion of Consolidated Adjusted EBITDA
($ millions, except per share and LNG data)                               4Q 2021           3Q 2021           FY 2021           FY 2020            ✓ Record ~$2.0 billion of Distributable Cash Flow
Revenues                                                                    $6,557            $3,200          $15,864            $9,358            ✓ Record 2,000+ tbtu volumes exported

Income (Loss) from Operations                                                  $439         $(2,350)            $(701)           $2,631
                                                                                                                                                   Key Financial Transactions and Updates
Net Loss 1                                                                $(1,323)          $(1,084)         $(2,343)               $(85)
                                                                                                                                                   • In February 2022, S&P upgraded CEI & CQP to BB+ and maintained
Consolidated Adjusted EBITDA                                                $1,339            $1,053            $4,867           $3,961              Positive Outlook

Distributable Cash Flow                                                      ~$540            ~$390          ~$2,020           ~$1,350             • In FY 2021, we repaid $1.2 billion of consolidated indebtedness and
                                                                                                                                                     repurchased an aggregate of 101,944 shares of common stock for
LNG Exported                                                                                                                                         ~$9 million
                                                                                                                                                   • In December 2021, SPL issued $482 million in aggregate principal
     LNG Volumes Exported (TBtu)                                                 542               500            2,018            1,381
                                                                                                                                                     of Senior Secured Notes due 2037 on a private placement basis, net
                                                                                                                                                     proceeds of which were used to redeem a portion of the 2022 SPL
     LNG Cargoes Exported                                                        153               141               566              391
                                                                                                                                                     Senior Notes. The remaining balance of the 2022 SPL Senior Notes
                                                                                                                                                     was redeemed with cash on hand
LNG Volumes Recognized in Income (TBtu)
                                                                                                                                                   • In December 2021, we issued a notice of redemption for all $625
     LNG Volumes from Liquefaction Projects                                      513               489            1,952            1,385             million aggregate principal amount outstanding of our 4.25%
                                                                                                                                                     Convertible Senior notes due 2045, which were redeemed on
     Third-Party LNG Volumes                                                         7               10                45               24           January 5, 2022

     Note: Consolidated Adjusted EBITDA and Distributable Cash Flow are non-GAAP measures. A definition of these non-GAAP measures and a reconciliation to Net income attributable to common stockholders, the most comparable U.S. GAAP measure, is
13   included in the appendix. Total margins as used herein refers to total revenues less cost of sales.
     1.    Reported as Net income attributable to common stockholders and Net income per share attributable to common stockholders – diluted on our Consolidated Statement of Operations.
Raising Full Year 2022 Financial Guidance
Full Year 2022 Guidance • FY 2022 forecast improved due to the early substantial
completion of Sabine Pass Train 6, higher market margins and
Initial FY 2022 Revised FY 2022 timing of year-end 2021 cargoes; remains subject to volatility
($ billions, except per unit data)
of global gas market prices and year-end 2022 cargo timing
Consolidated Adjusted EBITDA $5.8 - $6.3 $7.0 - $7.5
• Initiating CQP distribution expected to consist of a base
amount plus a variable component in 1Q’22
Distributable Cash Flow $3.1 - $3.6 $4.3 - $4.8
•Cheniere Earnings Presentation Fourth Quarter and Full Year 2021 February 24, 2022 NYSE American: LNG
Appendix
Cheniere LNG Exports
More than 2,000 Cargoes Exported from our Liquefaction Projects
Cheniere LNG Exports by Destination
MT
12
10
8
6
4
2
0
1Q 2Q 3Q 4Q 1Q 2Q 3Q 4Q
2020 2021
Europe Asia Latin America MENA
Cheniere Destinations
Sources: Cheniere Research, Kpler
17
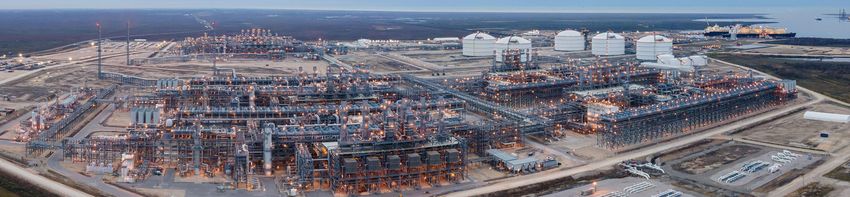
Note: Cumulative cargoes and volumes as of February 18, 2022. MENA – Middle East & North AfricaIndustry Leading U.S. LNG Export Platform
Corpus Christi LNG Terminal Sabine Pass Liquefaction
~15 mtpa Total Production Capacity ~30 mtpa Total Production Capacity
Trains 1-3 operating, contracts with long-term buyers Trains 1-6 operating, most contracts with long-term
commenced buyers commenced
>1,500 Employees
6 Offices Worldwide Trains 1-3 delivered ahead of schedule and within budget Trains 1-6 delivered ahead of schedule and within
Houston | London | Washington D.C. budget
~10+ mtpa Stage 3 expansion project shovel-ready
Singapore | Beijing | Tokyo
18Sabine Pass Update
Liquefaction Operations
6 Trains in operation
Increased production via maintenance
optimization and debottlenecking
>1,550 cargoes produced and exported
Growth
3rd berth expansion 73.4% complete
Evaluating CCUS opportunities
Own/control ~500 acres of adjacent land for
potential future development opportunities
Sabine Pass Train 6 in foreground
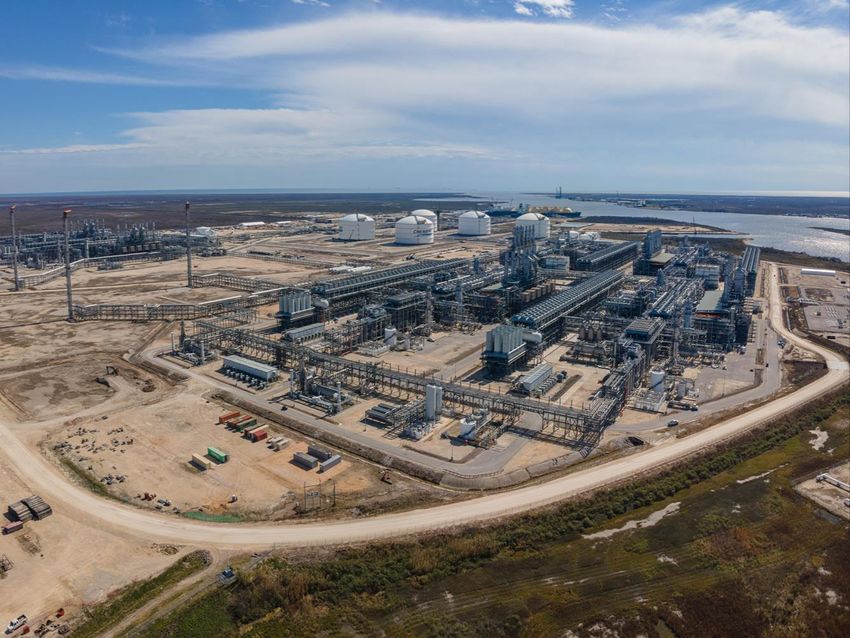
19 Note: Cumulative cargoes as of February 18, 2022. Project completion percentage as of December 31, 2021.Corpus Christi Update
Liquefaction Operations
3 Trains in operation
Increased production via maintenance
optimization and debottlenecking
~450 cargoes produced and exported
Growth
~10+ mtpa Stage 3 expansion project fully
permitted
20 Note: Cumulative cargoes as of February 18, 2022.Cheniere Corporate Structure
Cheniere Energy, Inc.
(NYSE American: LNG)
CQP GP Cheniere Corpus
Cheniere Marketing
(& IDRs) Christi Holdings
Cheniere Energy
Corpus Christi Cheniere Corpus
Partners, L.P.
Liquefaction Christi Pipeline
(NYSE American: CQP)
Cheniere Creole Sabine Pass
Sabine Pass LNG
Trail Pipeline Liquefaction
Publicly Traded Equity
Operating Entity
Non-Operating Entity
21 Note: This organizational chart is provided for illustrative purposes only, is not and does not purport to be a complete organizational chart of Cheniere.Run Rate Guidance
9 Trains
(Full Year)
SPL T1-6
($billions, except per share and per unit amounts or unless otherwise noted) CCL T1-3
CEI Consolidated Adjusted EBITDA $5.3 - $5.7
Less: Distributions to CQP Non-Controlling Interest ($0.9) – ($1.0)
Less: CQP Interest Expense / SPL Interest Expense / Other ($1.0)
Less: CEI Interest Expense / CCH Interest Expense / Other ($0.8)
CEI Distributable Cash Flow $2.6 - $3.0
CEI Distributable Cash Flow per Share1 $10.25 - $11.75
CQP Distributable Cash Flow per Unit $3.75 - $3.95
Note: Numbers may not foot due to rounding. Range driven by production range of 4.9 – 5.1 MTPA per train and marketing margin of $2.00 - $2.50 / MMBtu. Additional assumptions include 80/20 profit-sharing tariff with SPL/CCH projects,
$3.00 / MMBtu Henry Hub, and 5.00% interest rates for refinancings. Average tax rate as percentage of pre-tax cash flow expected to be 0-5% in the 2020s and 15-20% in the 2030s. Consolidated Adjusted EBITDA, Distributable Cash Flow,
Distributable Cash Flow per Share and Distributable Cash Flow per Unit are non- GAAP measures. A definition of these non-GAAP measures is included in the appendix. We have not made any forecast of net income on a run rate basis, which
would be the most directly comparable measure under GAAP, in part because net income includes the impact of derivative transactions, which cannot be determined at this time, and we are unable to reconcile differences between these run rate
forecasts and net income.
1. Assumed share count of ~255mm shares.
22Cheniere Debt Summary
Cash Balance: ~$1.4B1
Cheniere Energy, Inc.
Cheniere Energy, Inc.
~$0.63B Convertible Notes due 2045 (4.250%)4 (NYSE American: LNG)
$2.0B Senior Notes due 2028 (4.625%)
Cheniere Corpus Christi Holdings, LLC
$1.25B Senior Secured Revolving Credit Facility due 2026
$1.25B Notes due 2024 (7.000%)
$1.5B Notes due 2025 (5.875%)
$1.5B Notes due 2027 (5.125%)
$1.5B Notes due 2029 (3.700%)
CQP GP Cheniere Corpus
Cheniere Marketing ~$2.7B Notes due 20392
(& IDRs) Christi Holdings $1.2B Working Capital Facility due 2023
~$1.7B Credit Facility due 2024
Cheniere Energy Partners, L.P.
$1.5B Notes due 2029 (4.500%)
$1.5B Notes due 2031 (4.000%) Cheniere Energy
$1.2B Notes due 2032 (3.250%) Corpus Christi Cheniere Corpus
Partners, L.P.
$0.75B Senior Secured Revolving Credit Liquefaction Christi Pipeline
Facility due 2024 (NYSE American: CQP)
Sabine Pass Liquefaction, LLC
Cheniere Creole Sabine Pass $1.5B Notes due 2023 (5.625%)
Sabine Pass LNG $2.0B Notes due 2024 (5.750%)
Trail Pipeline Liquefaction $2.0B Notes due 2025 (5.625%)
$1.5B Notes due 2026 (5.875%)
$1.5B Notes due 2027 (5.000%)
$1.35B Notes due 2028 (4.200%) Publicly Traded Equity
$2.0B Notes due 2030 (4.500%)
Note: This organizational chart is provided for illustrative purposes only, is not and does not purport to be a complete organizational chart of Cheniere. $1.3B Notes due 20373 Operating Entity
Total commitments for Term Loan, Credit, and Working Capital facilities are shown above and are inclusive of undrawn balances. $1.2B Working Capital Facility due 2025
1. Unrestricted cash balance as of December 31, 2021. Includes unrestricted cash of $0.9 billion held by Cheniere Energy Partners, L.P. Non-Operating Entity
2. Includes 4 separate tranches of notes reflecting a weighted-average interest rate of 3.718%.
3. Includes 6 separate tranches of notes reflecting a weighted-average interest rate of 4.275%.
4. In January 2022, the Convertible Notes due 2045 were redeemed.
23Reconciliation to Non-GAAP Measures
Regulation G Reconciliations
This presentation contains non-GAAP financial measures. Consolidated Adjusted EBITDA, Distributable Cash Flow, Distributable Cash Flow per Share, and
Distributable Cash Flow per Unit are non-GAAP financial measures that we use to facilitate comparisons of operating performance across periods. These non-
GAAP measures should be viewed as a supplement to and not a substitute for our U.S. GAAP measures of performance and the financial results calculated in
accordance with U.S. GAAP and reconciliations from these results should be carefully evaluated.
Consolidated Adjusted EBITDA is commonly used as a supplemental financial measure by our management and external users of our consolidated financial
statements to assess the financial performance of our assets without regard to financing methods, capital structures, or historical cost basis. Consolidated
Adjusted EBITDA is not intended to represent cash flows from operations or net income as defined by U.S. GAAP and is not necessarily comparable to similarly
titled measures reported by other companies.
We believe Consolidated Adjusted EBITDA provides relevant and useful information to management, investors and other users of our financial information in
evaluating the effectiveness of our operating performance in a manner that is consistent with management’s evaluation of financial and operating performance.
Consolidated Adjusted EBITDA is calculated by taking net loss attributable to common stockholders before net income attributable to non-controlling interest,
interest expense, net of capitalized interest, changes in the fair value and settlement of our interest rate derivatives, taxes, depreciation and amortization, and
adjusting for the effects of certain non-cash items, other non-operating income or expense items, and other items not otherwise predictive or indicative of
ongoing operating performance, including the effects of modification or extinguishment of debt, impairment expense and loss on disposal of assets, changes
in the fair value of our commodity and FX derivatives prior to contractual delivery or termination, non-cash compensation expense, and non-recurring costs
related to our response to the COVID-19 outbreak which are incremental to and separable from normal operations. The change in fair value of commodity and
FX derivatives is considered in determining Consolidated Adjusted EBITDA given that the timing of recognizing gains and losses on these derivative contracts
differs from the recognition of the related item economically hedged. We believe the exclusion of these items enables investors and other users of our financial
information to assess our sequential and year-over-year performance and operating trends on a more comparable basis and is consistent with management’s
own evaluation of performance.
Distributable Cash Flow in 2021 is defined as cash received, or expected to be received, from Cheniere’s ownership and interests in CQP and Cheniere Corpus
Christi Holdings, LLC, cash received (used) by Cheniere’s integrated marketing function (other than cash for capital expenditures) less interest, taxes and
maintenance capital expenditures associated with Cheniere and not the underlying entities. Management uses this measure and believes it provides users of
our financial statements a useful measure reflective of our business’s ability to generate cash earnings to supplement the comparable GAAP measure.
CQP Distributable Cash Flow is defined as CQP Adjusted EBITDA adjusted for taxes, maintenance capital expenditures, interest expense net of capitalized
interest, interest income, and changes in the fair value and non-recurring settlement of interest rate derivatives.
Distributable Cash Flow per Share and Distributable Cash Flow per Unit are calculated by dividing Distributable Cash Flow by the weighted average number of
common shares or units outstanding.
We believe Distributable Cash Flow is a useful performance measure for management, investors and other users of our financial information to evaluate our
performance and to measure and estimate the ability of our assets to generate cash earnings after servicing our debt, paying cash taxes and expending
sustaining capital, that could be used for discretionary purposes such as common stock dividends, stock repurchases, retirement of debt, or expansion capital
expenditures.
Distributable Cash Flow is not intended to represent cash flows from operations or net income (loss) as defined by U.S. GAAP and is not necessarily comparable
to similarly titled measures reported by other companies.
Non-GAAP measures have limitations as an analytical tool and should not be considered in isolation or in lieu of an analysis of our results as reported under
GAAP and should be evaluated only on a supplementary basis.
Note:
We have not made any forecast of net income on a run rate basis, which would be the most directly comparable financial measure under GAAP, in part because
net income includes the impact of derivative transactions, which cannot be determined at this time, and we are unable to reconcile differences between run rate
Consolidated Adjusted EBITDA and Distributable Cash Flow and income.
24Reconciliation to Non-GAAP Measures (continued)
Regulation G Reconciliations (continued)
Beginning with our 2022 financial guidance, we have adopted a revised definition for Distributable Cash Flow, which aims to more accurately reflect
the consolidated distributable cash flow of each of our subsidiaries, including Cheniere Partners. The revised definition reflects the distributable
cash flow of Cheniere Partners before the impacts from capital allocation, less amounts attributable to minority interests. There is no change to our
run-rate distributable cash flow guidance as a result of this definition change.
Distributable Cash Flow for 2022 and going forward is defined as cash generated from the operations of Cheniere and its subsidiaries and adjusted
for non-controlling interest. The Distributable Cash Flow of Cheniere’s subsidiaries is calculated by taking the subsidiaries’ EBITDA less interest
expense, net of capitalized interest, interest rate derivatives, taxes, maintenance capital expenditures and other non-operating income or expense
items, and adjusting for the effect of certain non-cash items and other items not otherwise predictive or indicative of ongoing operating
performance, including the effects of modification or extinguishment of debt, amortization of debt issue costs, premiums or discounts, changes in
fair value of interest rate derivatives, impairment of equity method investment and deferred taxes. Cheniere’s Distributable Cash Flow includes 100%
of the Distributable Cash Flow of Cheniere’s wholly-owned subsidiaries. For subsidiaries with non-controlling investors, our share of Distributable
Cash Flow is calculated as the Distributable Cash Flow of the subsidiary reduced by the economic interest of the non-controlling investors as if
100% of the Distributable Cash Flow were distributed in order to reflect our ownership interests and our incentive distribution rights, if applicable.
The Distributable Cash Flow attributable to non-controlling interest is calculated in the same method as Distributions to non-controlling interest as
presented on Statements of Stockholders’ Equity. This amount may differ from the actual distributions paid to non-controlling investors by the
subsidiary for a particular period.
CQP Distributable Cash Flow is defined as CQP Adjusted EBITDA adjusted for taxes, maintenance capital expenditures, interest expense net of
capitalized interest, interest income, and changes in the fair value and non-recurring settlement of interest rate derivatives.
Distributable Cash Flow per Share and Distributable Cash Flow per Unit are calculated by dividing Distributable Cash Flow by the weighted average
number of common shares or units outstanding.
We believe Distributable Cash Flow is a useful performance measure for management, investors and other users of our financial information to
evaluate our performance and to measure and estimate the ability of our assets to generate cash earnings after servicing our debt, paying cash
taxes and expending sustaining capital, that could be used for discretionary purposes such as common stock dividends, stock repurchases,
retirement of debt, or expansion capital expenditures.
Distributable Cash Flow is not intended to represent cash flows from operations or net income (loss) as defined by U.S. GAAP and is not necessarily
comparable to similarly titled measures reported by other companies.
Non-GAAP measures have limitations as an analytical tool and should not be considered in isolation or in lieu of an analysis of our results as
reported under GAAP and should be evaluated only on a supplementary basis.
25Investor Relations Contacts Randy Bhatia Vice President, Investor Relations – (713) 375-5479, randy.bhatia@cheniere.com Frances Smith Manager, Investor Relations – (713) 375-5753, frances.smith@cheniere.com © 2021 Cheniere Energy, Inc. All Rights Reserved
You can also read