CFA Institute Research Challenge - CFA Society of Thailand Thammasat University Hosted by - CFA Institute ...
←
→
Page content transcription
If your browser does not render page correctly, please read the page content below

CFA Institute Research Challenge
 Hosted by
 CFA Society of Thailand
 Thammasat University

Industry: Property Construction
 Thammasat University Student Research Sector: Construction Material
 This report is published for educational purposes only by students
 competing on the CFA Institute Research Challenge. DYNASTY CERAMIC PCL
 Date: 21/12/2014 Current Price: THB 55.75 Target Price: THB 41.50
 Ticker: DCC (SET) USD 1.00: THB 32.85 Recommendation: SELL (25.6% Downside)
Company Overview Investment Highlights
Founded in 1989, Dynasty Ceramic PCL
 We place a “SELL” recommendation. Despite the high Return on Equity (“ROE”) and solid financial
(“DCC” or the “Company”) is one of the
 position, the absence of future growth opportunities as well as the intensifying competition
largest tile manufacturers and distributors
of ceramic tiles in Thailand. Listed on the
 implies that past stellar performance is unlikely to repeat again. With our valuation using
Stock Exchange of Thailand in 1992. As of Dividend Discount Model (“DDM”) and Free Cash Flow to Firm (“FCFF”) model, the one-year
December 2014, DCC operates 195 outlets target price is THB 41.50, which leads to our final recommendation.
nationwide targeting low-to middle-income
 Limited ability to drive sales through store expansion leads to greater reliance on same store
customer segments mainly in provincial
areas. sales growth: With 195 stores covering almost all 77 provinces throughout Thailand, the
 Company is likely to experience difficulties in expanding its branch network. The declining trend
 DCC Relative to SET Index in the number of new stores opened annually from 10 stores in 2012 to only 4 stores in 2013
 15% indicates deteriorating expansion opportunity. In fact, in year-to-date 2014, 1 store was closed
 10%
 5% while no stores were opened. This reflects management’s failure to meet the initially set 5 new
 0% stores. Even in the scenario in which the company successfully achieves the expansion target, the
 -5%
-10% impact on top line would be immaterial because of the current large store network. Going
-15% forward, DCC is unlikely to achieve substantial growth of its existing business purely through
-20%
 opening new stores as it used to experience in the past.
 Aug-13

 Dec-13
 Oct-13

 Feb-14

 May-14

 Jul-14
 Aug-14
 Nov-13

 Jan-14

 Apr-14

 Oct-14
 Nov-14
 Sep-13

 Mar-14

 Jun-14

 Sep-14

 Weak economic outlook implies low potential to boost same store sales: DCC’s main target
 DCC SET market is in upcountry areas, where the demand is closely tied to the agricultural products. With
 Source: Bloomberg
 the continuous declining in both farm income and agricultural price index by -7.7% YoY and
 -7.2% YoY in 3Q2014, the recovery of sales growth appears difficult. In addition, the level of
 DCC VS. SET Holding Period Return
 household debt has reached the record high of 84% of Thailand’s GDP, as of June 30, 2014. This
 Time horizon SET DCC can potentially slowdown house renovation market which is DCC’s key market. Combining these
 1-year 26.63% 21.23% unfavorable macroeconomic indicators, the turnaround of same store sales growth is unlikely to
 3-year 71.08% 9.36% take place in the near future.
 5-year 160.02% 145.57%
 Intensifying competition adds risk to future growth prospect: The lower cost of imported tiles,
 Source: Bloomberg
 especially from China and Vietnam, has incentivized both local tile manufacturers and other home
 improvement retailers to outsource the production activities. It allows importers to sell their
 High ROE is offset by high P/BV products at 10-15% below market Average Selling Price (“ASP”). As a result, tiles imported value
 ROE has been increasing with the CAGR of 28% during 2009 to 2013. In addition, other competing
 (%) DCC TB
50.00 home improvement retailers, namely Global House and Thai Watsadu, have aggressively
 Average

 expanded their stores in both urban and provincial areas with number of stores increasing from
40.00
 12 to 66 stores within last 5 years. The competitive advantage of DCC as being a low-cost
30.00 manufacturer and having the extensive store network is now being threatened. This changing
 SCC TB Average competitive landscape reflects in a gradual decrease in DCC market share from 24% in 2009 to
20.00 TTC VN
 21% in 2013. DCC’s sales volume continues declining from -4.9% in 2013 and -5.2% in 2014.
 TGCI TB
10.00
 GLOBAL TB Future plan to grow remains questionable: After domestic sales saturates, the clarity of the
 0.00 next growth strategies is crucial to drive DCC forward. At the moment, international expansion
 0.00 2.00 4.00 6.00 8.00 10.00
 seems to be very attractive. However, the management has decided to put the expansion strategy
 P/BV (Times)
 Note: The label represents Bloomberg ticker on hold due to many uncertainties and risks involved. Therefore, the international expansion is
 Source: Bloomberg expected not to happen in the near future. An absence of the next growth engine makes DCC
 become less attractive.

 Relative
 DCC
 Peers Relative Valuations also indicate overprice for no growth company: The indicative valuation
 Multiples Average multiples obtained from the relative valuation, covering both local and regional comparable
 P/E 18.90 14.51 companies further confirms that DCC’s stock price is not justified by its growth outlook. Although
 PEG 7.43 3.00 DCC’s P/E ratio of 18.9x is considered in line with peers’ average P/E ratio at 14.5x, when the
 P/B 8.58 2.30
 EV/EBITDA 13.68 10.17
 Company’s growth is incorporated into multiple analysis, DCC’s PEG ratio of over 7.4x is, in fact,
 significantly higher than peers’, which is only 3.0x. With the expected growth rate of 2-3% per
 Source: Bloomberg and Team’s Estimates
 annum, the results from all valuation methods confirm that the current price of THB 55.75 per
 share is overvalued.
 Market Profile
 52 weeks price range Key Financial Ratios 2012 2013 2014F 2015F 2016F 2017F 2018F 2019F
 (THB/share) 48-61 Sales Growth 5.5% -0.7% -4.4% 2.4% 2.8% 2.4% 2.4% 2.3%
 Average daily volume (Shares) 306,100
 Beta 0.57 Earning per Share Growth 1.8% 2.6% -7.9% 3.6% -2.8% -8.9% 21.5% 22.6%
 Dividend yield 5.76% Gross Profit Margin 39.2% 41.1% 40.5% 40.5% 40.5% 40.5% 40.4% 40.3%
 Market capitalization (Mn THB) 23,358
 Net Profit Margin 16.7% 17.2% 16.6% 16.6% 16.5% 16.4% 16.3% 16.2%
 Share outstanding (Mn Shares) 408
 Free float 36.07% Return on Equity 45.8% 46.8% 43.1% 43.5% 44.4% 45.0% 45.7% 46.3%
 Foreign limit 35.00% Debt-to-Equity Ratio 0.30 0.43 0.47 0.54 0.61 0.63 0.65 0.65
 Source: Bloomberg Earning per Share (THB) 3.08 3.18 2.93 2.99 3.06 3.12 3.18 3.23
 1

Figure 1: Sales by distribution channels
 Export
 Business Description
 Franchise
 2%
 Real Estate 3% Founded in 1989, Dynasty Ceramic Public Company Limited (“DCC” or the “Company”) is one
 Developers
 10% of the largest ceramic tile manufacturers in Thailand. The Company manufactures and sells a great
 variety of ceramic wall/floor tiles as well as other tile-related products under its own brands
 Home
 (Appendix 1 & 2). DCC targets low to lower-middle income customer segments mainly in
 Improvemen provincial areas. The Company distributes its products through various sales channels; however,
 Outlet Stores
 t Centers
 67%
 the main sales channel is DCC’s own outlet stores (Figure 1). As of December 2014, DCC has 195
 18%
 outlet stores located nationwide and 2 factories in Saraburi with total annual production capacity
 of 69 Mn sq.m.

 In June 2014, DCC has conducted a group restructuring by Entire Business Transfer of three of the
Source: Company Data and Team’s Estimates,
 Company’s subsidiaries, with an intention to reduce interrelated work process and general and
Average 9M2014
 administrative expenses, leaving Tile Top Industry Public Co., Ltd as DCC’s only subsidiary
 company with 97% controlling stake (Appendix 3).
 Product Types Description
 Low-price
 products
 16x16” tiles and smaller Company Strategies
 High-price Hybrid and rectified
 products 16x16” tiles and larger Product line extension: Aiming to capture the higher market segment, DCC has recently launched
 the high-price products, i.e. Digital and larger-sized tiles. And to further ensure the success of new
 Figure 2: Average selling price and market penetration, DCC has been renovating its outlet stores hand-in-hand with the launch of
 sales contribution by product types new products.
THB/Sq.m
 225
 88% 12% Distribution channel expansion: DCC has been continuously expanding through its new outlet
 200 stores. This allows the Company to further reduce its reliance on other distributors. However,
 after the slowdown in sales from outlet stores, it also aims to expand the distribution channels by
 175 187.7
 focusing on other markets such as; new home market, wholesale, and construction projects in
 150 Overall ASP order to expand its customer base. Nevertheless, this might still be questionable whether it is
 125
 136.9 going to benefit DCC enough because it may lead to the decrease in margin and increase in
 128.2
 accounts receivable days.
 100
 Low-price products High-price products
 Cost reduction: In order to achieve gross margin target of 43% in 2014, DCC has been trying to
 ASP Sales Contribution
 reduce the cost of production. Both natural gas and chemicals, the main cost components (Figure
 Source: Company data and Team’s estimates, As
 of September 2014 3), were reduced through the production process adjustments. In addition, the company also
 improves kilns in order to increase the production efficiency and capability.
 Figure 3: Cost structure
 Shareholders Structure
 Others The Saengsastra family and some of the Board of Directors (“BOD”) own and control 47% of total
 Gas
 27% 30% common shares. Other major shareholders are institutional and individual investors who own
 17% (Figure 4). As of December 19, 2014, free float is accounted for 36% with the daily turnover
 rate of 0.075% or 306,100 shares per day.
 Labor
 7%
 Chemicals
 Corporate Management
 Materials
 16% 20%
 Mr. Roongroj Saengsastra became the Chairman of DCC since 2001 (Appendix 4). Under his
 leadership, the Company has been going through many strategic changes, expanding its own
 Source: Company data, As of September 2014 outlet stores, and has built up its scale to become the leader in tiles manufacturing business.
 Figure 4: Shareholders structure DCC’s operating performance has improved significantly with earning growth stands at
 approximately 14% CAGR since year 2008. Despite well-planned business strategy, the
 management has failed to achieve their plan. This can be proved by the under-targeted number of
 new outlet stores opened over the past years.

 Public Saengsastra
 36% Family & Board
 of directors Corporate Governance and Social Responsibility
 47%

 Corporate Governance
 Other major
 shareholders
 17% DCC has been implementing good corporate governance practices by organizing its Code of
 Conduct to fight against corruptions as well as verifying its working procedure to be in
 Source: Company data, As of November 2014 accordance with established corporate governance policies. Apart from the Annual General
 Meeting, the Company regularly holds the Opportunity Day and company presentation, in order
 Figure 5: Corporate governance score to keep investors and other concerned parties being updated. However, we observe that recently
 ranking among listed companies the Company provides less information in detail than before causing more difficulty for investors
 No. of Cumulative to analyze the company data. DCC is a family-run company, with 3 out of 9 seats in BOD come
 Rating
 companies ranking from Saengsastra family aligning with the management positions and shareholders structure. The
 Excellent 29 29 rest of BOD are professionals and independent directors. In terms of CG rating, DCC has been
 Very good 108 137
 Good 171 308
 evaluated as “Good” by Thai Institute of Directors Association (Appendix 5). This rating
 Satisfactory & below 242 550 represents the average CG rating score of all companies listed on SET index (Figure 5).
 Total 550 550
 Source: Thai Institute of Directors Association (IOD),
 As of December 2014

 2

Figure 6: Quarterly GDP and Growth Corporate Social Responsibility
 GDP Growth DCC has been actively seeking opportunities to give back to the society. The Company has
 (Bn THB) (% YoY)
1,300 30 organized the official committee and set rigorous policy towards becoming a socially responsible
1,250 19.1
 20 company. DCC initiated various CSR activities aiming to improve the local community such as
1,200
1,150 2.9 2.7 10 donating tiles to rural schools and sponsoring vocational training session to prisoners.
1,100 0.6 -0.5 0.4 0.6
 3.1 5.4 0
1,050
1,000 -10
 Industry Overview and Competitive Positioning
 Quaterly GDP GDP Growth (YoY)
 Macro-economic Analysis
 Source: National Economic and Development Board
 The overall Thai economy is still under pressure
 Figure 7: Debt Service Ratio by Income
 DSR (%) The GDP growth is forecasted to be 1.5%-2% in 2014 and 3.5%-4.5% in 2015 resulted from a
 60 49 slower-than-expected economic recovery. In order to achieve the forecast of 2014, it will require
 50
 40 29 25 23 23 Average a substantial growth of approximately 7% in 4Q2014, which tends to be unachievable by many
 30 DSR constraints (Figure 6). First, Thai exports is experiencing a low growth due to vulnerable global
 20 28 economy. Manufacturing Production Index (MPI) is still at low level indicating by -3.9 in
 10
 0 3Q2014. Moreover, government policy to stimulate economy has still not been taken into action
 as much as targeted. Currently, there is only THB 55 Bn from the total budget of THB 365 Bn
 Household being injected into the system.
 Income
 (THB/month)
 Source: SCB Economic Intelligence Center, As of
 Vigorous recovery of household consumption is unlikely
 October 2014
 Household debt is already at high: Household debt has been continuously expanding in terms of
 Figure 8: Change in Farm Income Index both absolute and relative. In 2Q2014, the most recent updates, household debt had increased to
 and Agricultural Price Index 84% of GDP which is accumulated up to the all-time-high of THB 10bn with a growth of 8.1% YoY.
 (Appendix6). At this level, low-income people are crucially in concern, due to lower debt
 % YoY
 5 3.3 repayment ability indicated by high debt service ratio (Figure 7).
 1.2 2.9
 0
 -0.8 Agricultural prices remain at low level: Thailand is now facing low agricultural product prices,
 0.9
 -4.6 -3 particularly the main products: such as rice, rubber, and palm oil. Each contributed to a drop in
 -0.9
 -5 -4
 overall agricultural price index. This has caused an effect to more than 30% of Thai labor that are
 -7.2 farmers. The problem is crucially driven by market mechanism, an oversupply, and the
 -7.1 -6.9 -6.9 -7.7
-10 competition from other countries. This low price level has caused a direct effect to farm income
 1Q2013 2Q2013 3Q2013 4Q2013 1Q2014 2Q2014 3Q2014
 that had experienced a slump of -7.7% YoY in 3Q2014 (Figure 8).
 Farm Income Index
 Agricultural Price Index Stagnant Consumer Confidence Index (“CCI”) signals weak purchasing demand: After a
 Source: Office of Agricultural Economic
 continuous increase in CCI, it has ceased in 3Q2014 and remains at around 80. This number
 below 100, the 125th consecutive month, indicates outlook of overall economic directions that has
 Figure 9: Stable Consumer Price Index not yet been fully recovered (Figure9).
 90
 85 80.1 79.2 These unfavorable economic indicators are expected to lessen the purchasing power of low-
 80
 75 71.5
 69.9 68.8 78.2 80.178.9 income people who are DCC’s main target customers. This could also pass on the pressure to
 70 75.1 home renovation market, since it is not a daily necessary cost. Thus, the sales turnaround
 70.7
 65 67.8 will be difficult to achieve (Appendix 7).
 60
 55
 50 Industry Analysis
 In the ceramic tile industry, there are six key domestic players including DCC competing head-to-
 Source: University of Thai Chamber of Commerce head with one another in terms of design, brand presence, and price (Appendix 8). DCC, however,
 positions itself as the leader in low-price market and is able to gain the largest share based on
 Figure 10: Increasing in imported tiles domestic sales. The barrier to entry is relatively high, as the business requires large amount of
 market value capital investment (Appendix9). Also, the industry seems to be matured with slightly growth and
 Bn THB
 10 8.7 limited demand. On the other hand, the competition within the industry itself has become more
 7.3 intense after a coming of imported tiles, mainly from China and Vietnam. These tiles are being
 8
 sold at highly competitive selling price.
 6 5.3
 4.8

 4 3.3 Industry Highlights
 2
 Low demand for tiles resulted from a slowdown in property sector: The property sector is
 - expected to encounter a downward trend reflected by the decline in number of approved
 2009 2010 2011 2012 2013
 construction areas by 1.5% YoY in 9M2014. This is caused by the massive amount of unsold
 Source: The Customs Department and Team’s properties from real estate boom in 2012-2013. Also, slow recovery of overall economy will likely
 Estimates to pass on pressure to new project developments. Hence, we see a direct negative effect on DCC’s
 sales to developers.

 More intense competition highlighted by imported tiles and house brand: The industry can
 observe the growing trend of imported tiles from low-cost producers in China and Vietnam. The
 tiles are imported and sold by local manufacturers and modern trades under house brand. With
 an average selling price of THB 125 per sq. m. compared to those local ones of THB 137 per sq. m.,
 these imports have been gaining the market share from 13% in 2009 to 24% in 2013 (Figure10).
 This implies that the overall domestic tile market has been growing on an expense of the local
 3
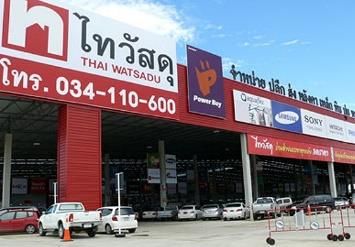
manufacturers including DCC. Moreover, modern trade, especially specialty store, has been
 continuously growing by 4.5% in 1H2014 despite the economic slowdown. This is considered as a
 threat to DCC due to a change in competitive landscape and a difficulty to attract customers to
 shop at DCC outlet stores (Appendix 10).

Figure 11: Domestic Manufacturers
 Competitors Analysis
Market Share by Sales
 Local Tiles Manufacturers
 RCI-Rci
 TGCI- 4%
 Campana The Siam Cement (SCC): SCC has introduced its tiles into the market under the brand “Cotto”
 Casa
 9% with premium quality aiming to capture middle-to-high income people. After an investment in
 DCC-
 Dynasty Prime Group Ceramic, the production capacity could reach over 100 Mn sq.m. per year,
 28%
 UMI-
 Dulagres
 comparing to 69 Mn sq.m. of DCC. With the leading position of premium tiles of SCC, the strategy
 14%
 of DCC to expand product line to capture high-price is crucially hardened.

 SCC-Cotto Sosuco Ceramics: Sosuco is one of the leading tiles manufacturers with a strategy to retain its top
 SOSUCO
 28%
 17% 3 domestic market shares and increase proportion of exports. Currently, the company has an
 annual production capacity of 58 Mn sq.m. Sosuco offers wide range of product to broad customer
 segments, which could potentially be a threat to DCC.
 Source: Company Data
 Union Mosaic Industry (UMI): UMI is one of the key players in local tiles manufacturer market
 with the tiles product being sold under the brand “Duragres”. The company can produce up to
 16.8 Mn sq.m. per year. For the distribution, it is mainly focusing on agents. Even though UMI
 does not own any outlet stores, the threat to DCC could be in terms of targeted customers.
 Previously, UMI has bought a stake in TT Ceramic, allowing the company to expand its product
 lines to cover all segments including low-price market. With an active strategy, UMI could share
 the pie and pass on pressure on future DCC’s sales.
 Thai-German Ceramic Industry (TGCI): TGCI is considered a direct competitor to DCC since both
 their product offerings and target customer segment are exactly the same. The only difference is
 that TGCI distributes the tiles mainly to agents under the brand “Casa” and “Campana”; whereas
 DCC mainly distributed via its own outlet stores. For the capacity, the tiles could be produced up
 to 20 Mn sq.m per year.
 Royal Ceramic Industry (RCI): The tiles product of RCI includes glazed tiles, clayed tiles and
 porcelains with an aim to capture middle-income people. Currently, the company distributes the
 tiles through agents and own only 2 outlet stores. For the production side, it could reach the
 maximum level of only 6.8 Mn sq.m. per year. By combining low capacity and different target
 customer, RCI could pass on a minimal effect on DCC.

 High
 Note: size represents the
 COTTO
 production capacity and
 (SCC)
 color represents the level
 DCC of threat to DCC
 Target
 UMI SOSUCO
 Aiming to capture RCI
 High Low
 Market middle-to-high
 segment

 TGCI
 Low DCC

 Own retail stores Dealer / modern trade
 Concentration of Distribution Channel
 Source: Team’s Estimates

Figure 12: Number of stores and sales Local home improvement retailers
growth (2014F)
 Siam Global House (GLOBAL): Global House operates as a building materials and home
 Number of Sales Growth
 Stores (2014F)
 improvement retailer, with 27 branches located most in North-East of Thailand. The company
 DCC 195 -4.40% mainly targets home contractors and homeowners. The growth of GLOBAL would adversely affect
 DCC as the Company is planning to increase sales from developers.
 GLOBAL 27 16%
 Thai Thai Watsadu: The company offers wide variety of products relate to construction materials. It
 39 15-20%
 Watsadu
 targets a range of customers such as real estate contractors and homeowners with total of 39
Source: Company Data, Team’s Estimates, branches concentrate largely in Central and North-East of Thailand. The company also imports
Finansia Syrus Research
 tiles and sells under its own house brand. Both store expansion and house brand would be a
 threat to DCC that mainly sell the products through its own outlet stores.

 4

Figure 13: DCC failed to meet target Investment Summary
 expansion plan
 # Stores We place a “SELL” recommendation. Despite the high Return on Equity (“ROE”) and solid financial
20
 15 15 position, the absence of future growth opportunities as well as the intensifying competition
15 13 12
 10 10 implies that past stellar performance is unlikely to repeat again. With our valuation methods of
10 7 7
 5 5 Dividend Discount Model (“DDM”) and Free Cash Flow to Firm (“FCFF”) model, the one-year
 4
 5
 0
 target price is THB 41.50, which leads to our final recommendation.
 0
 2009 2010 2011 2012 2013 2014F Limited ability to drive sales through store expansion leads to greater reliance on same store
 Target Actual
 sales growth: With 195 stores covering almost all 77 provinces throughout Thailand, the
 Source: Company Data and Team’s Estimates
 Company is likely to experience difficulties in expanding its branch network. The declining trend
 in the number of new stores opened annually from 10 stores in 2012 to only 4 stores in 2013
 Figure 14: Declining sales volume and indicates deteriorating expansion opportunity. In fact, in year-to-date 2014, 1 store was closed
 growth
 (In Thousands Sq.m.)
 while no stores were opened. This reflects management’s failure to meet the initially set 5 new
 60,000 20.0% stores (Figure13). Even in the scenario in which the company successfully achieves the expansion
 58,000 target, the impact on top line would be immaterial because of the current large store network.
 10.0%
 56,000 Going forward, DCC is unlikely to achieve substantial growth of its existing business purely
 54,000
 0.0% through opening new stores as it used to experience in the past.
 52,000
 50,000 -10.0% Weak economic outlook implies low potential to boost same store sales: DCC’s main target
 2011 2012 2013 2014E market is in upcountry area, where the demand is closely tied to the agricultural products. With
 Total Sales volume (LHS) the continuous declining in both farm income and agricultural price index by -7.7% YoY and -
 YoY Volume growth (RHS)
 7.2% YoY in 3Q2014, the recovery of sales growth appears difficult. In addition, the level of
 Source: Company Data
 household debt has reached the record high of 84% of Thailand’s GDP as of June 30, 2014. This
 can potentially slowdown house renovation market which is DCC’s key market. Combining these
 Figure 15: Higher sales contribution from
 unfavorable macroeconomic indicators, the turnaround of same store sales growth is unlikely to
 high-price product take place in the near future (Figure 14).
30 138 140
 137
 135 136 Product line extension has little impact on profit: The launch of high-price products confirms
 134 133 136
20
 the weak market conditions in low-price market segment. Despite higher contribution of high-
 14 132
 13 price product sales from 9% in 1Q2014 to 14% in 3Q2014, the ASP of the Company has not
 9
10
 7 128 picked up as expected to reflect the higher contribution of such product sales. In addition, during
 4.3 4.7
 124 the same period, overall gross margin remained flat at 40%. Thus, we believe that DCC’s ongoing
 0 120
 efforts in promoting its high-price products are unlikely to have immaterial impact on overall
 profitability of the Company (Figure 15).
 ASP (RHS)

 Sales contribution from high-end product (LHS) Intensifying competition adds risk to future growth prospect: The lower cost of imported tiles,
 especially from China and Vietnam, has incentivized both local tile manufacturers and other home
 Source: Company Data
 improvement retailers to outsource the production activities. It allows importers to sell their
 products at 10-15% below market Average Selling Price (“ASP”). As a result, tiles imported value
 has been increasing with the CAGR of 28% during 2009 to 2013 (Appendix 11). In addition, other
 Figure 16: Declining DCC market share competing home improvement retailers, namely Global House and Thai Watsadu, have
 through 2019 aggressively expanded their stores in both urban and provincial areas with number of stores
 %
 22
 increasing from 12 to 66 stores within last 5 years. The competitive advantage of DCC as being a
 21
 low-cost manufacturer and having the extensive store network is now being threatened
 20
 (Appendix 12-14). This changing competitive landscape reflects in a gradual decrease in DCC
 -2.2
 18
 -0.5
 markets share from 24% in 2009 to 21% in 2013 (Figure 16). DCC’s sales volume also continues
 -0.6
 16 -0.7 15.2 declining from -4.9% in 2013 and -5.2% in 2014.
 -0.8
 14
 Future plan to grow remains questionable: After domestic sales saturates, the clarity of the
 12 next growth strategies is crucial to drive DCC forward. At the moment, international expansion
 10 seems to be very attractive. However, the management has decided to put the expansion strategy
 2013 2014F 2015F 2016F 2017F 2018F 2019F
 on hold due to many uncertainties and risks involved. Therefore, the international expansion is
 Source: Kasikorn Research Center, Team’s
 Estimates expected not to happen in the near future. An absence of the next growth engine makes DCC
 become less attractive

 Figure 17: Market recovery from Relative Valuations also indicate overprice for no growth company: The indicative valuation
 Thailand’s political unrest multiples obtained from the relative valuation covering selected comparable companies further
 15% confirms that DCC’s stock price is not justified by its growth outlook. Although DCC’s P/E ratio of
 10%
 5%
 18.9x is considered in line with peers’ whose average P/E ratio currently stands at 17.0x, when
 0% the Company’s growth is incorporated into multiple analysis, DCC’s PEG ratio of over 7.5x is, in
 -5%
 -10%
 fact, significantly higher than peers’ whose average PEG ratio is only 3.5x. With the expected
 -15% growth rate of 2-3% per annum, the results from all valuation methods confirm that the current
 -20% price of THB 55.75 per share is overvalued.
 Aug-13

 Dec-13

 Feb-14

 Apr-14
 May-14

 Jul-14
 Aug-14
 Oct-13
 Nov-13

 Jan-14

 Oct-14
 Nov-14
 Sep-13

 Mar-14

 Jun-14

 Sep-14

 Low beta does not lead to expected diversification benefit: Despite DCC’s low beta of 0.57
 DCC SET relative to SET Index, we found the high discrepancy between the beta during the bullish market
 Source: Bloomberg
 5

(0.48) and that during the bearish one (0.73). This indicates that DCC has limited upside during the bullish period and yields low diversification benefit in the bearish market (Figure 17), just simply the time when the investors need such benefit most. Thus, DCC might not be a good investment choice for investors who want to reduce their portfolio risk through diversification (Appendix 15). Event Analysis Share Price (THB) 80 Household debt reached to 84% of GDP 70 First announced 100% 60 dividend payout 50 50% Decrease in natural 40 gas price during Continuous drop 30 Sept 08- May 09 in agricultural Thailand Great product price 20 Flood 10 0 Jan-08 Jul-08 Jan-09 Jul-09 Jan-10 Jul-10 Jan-11 Jul-11 Jan-12 Jul-12 Jan-13 Jul-13 Jan-14 Jul-14 DCC stock price significantly skyrocketed in year 2008-2011 due to the huge drop in natural gas price, the continuous store expansion, and the announcement of 100% dividend payout. The great flood in Thailand was also a big event that drove the demand in home improvement market in 2011. However, in recent years the stock price has been sideway reflecting the impact from consumption problem in low-price segment e.g. household debt and the huge drop in agricultural product price. Valuation As a single business company with stable cash flow streams, we use Discounted Cash Flow (DCF) method in arriving the target price for DCC. The Company is perceived as a dividend stock from investor perspectives since it has been consistently paying stable and high dividend with the payout ratio of 100%. Hence, Dividend Discount Model (DDM) is used for the valuation of DCC. However, to better reflect intrinsic value of the Company, we also include Free Cash Flow to Firm (FCFF) method in our valuation in order to capture the controlling aspect of the largest group of shareholders, the family owner and the board of directors. Five-Year Projected Cash Flow Assumptions Figure 18: Sales growth drops during the forecast period Expected decline in sales growth: Sales for DCC is forecasted by distribution channel, with ASP Mn THB and volume as the key drivers. 12,000 CAGR Outlet Sales: DCC’s main revenues are from sales through its own outlet stores, 10,000 1.29% approximately 70% of total revenue, which are driven by expected number of stores 8,000 8.20% and same store sales for each region. The assumptions are estimated based on economic 6,000 outlook and store coverage in the areas. As the store expansion opportunity becomes 4,000 limited and higher competition is expected, we estimate the SSS to slightly decline. 2,000 Other distribution channels: Selling prices are discounted by 3-5% from the outlet - selling prices. We expect 1-4% growth of sales volume for wholesale customers such as 2008 2013 2019F home improvement retailers and real estate contractors. Source: Company Data and Team’s Estimates With all factors combined, sales growth is estimated to drop to 1.29% CAGR during the forecast period, compared to 8.20% in the past five years (Figure 18). Figure 19: COGS driven by Gas price Millions THB/M Costs of production driven by natural gas price: Cost of goods sold (COGS) consists of three THB MBTU main components: Natural gas cost, other variable costs and fixed costs. Natural gas is the main 6,000 500 cost of production with approximately 30% contribution to the total cost. It is calculated from (1) 5,000 400 Natural gas usage per unit, which is expected to remain constant at 0.06 MMBTU per sq.m. and 4,000 300 (2) Natural gas price per MMBTU, expected to increase by 3.5% annually (Figure 19). 3,000 2,000 200 Net profit grows slower than sales: Other income and SG&A expenses are expected to increase 1,000 100 proportionately to sales. Cost of financing for DCC is based on the Company’s historical short- 0 0 term borrowing rate of 2.85%. With the increase in COGS and SG&A, which are driven by higher depreciation and expected natural gas price, DCC’s net profit margin is estimated to decline from 17.25% in 2013 to 16.24% in 2019. Gas cost Variable costs Fixed costs Gas Price Capital Expenditures on store expansion and production capacity maximization: The annual Source: Company Data and Team’s Estimates CAPEX is forecasted to range between THB 336Mn to 441Mn during 2014 to 2019 and invested in 6
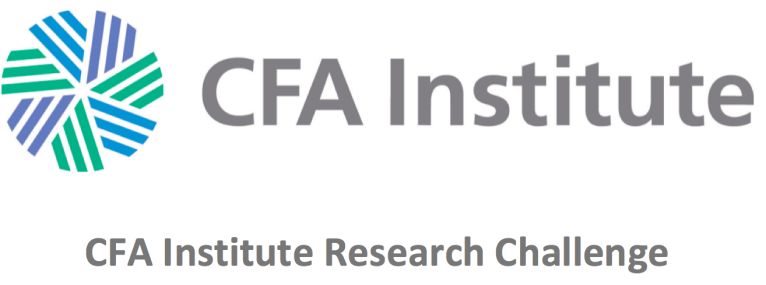
Figure 20: DCC Cost of Capital Estimates 3 main activities: (1) Store expansion and relocation, expected at 10 relocations with 1-3 new
 stores each year; (2) Store renovation, to maintain the quality and meet customers’ need; (3)
 WACC Computation Production capacity maximization, targeted at 2 kilns modification per year. The assumptions are
 Risk-Free Rate 2.86% estimated based on management’s target announcement and past achievements.
 Market Return 11.98%
 Country Risk Premium 2.50% Unsustainable high dividend payout: DCC can maintain its dividend payout ratio at 100% for
 Beta 0.57 the past years and it is expected continue throughout the forecast period, in accordance with the
 Cost of Equity 9.48% management’s intention to be a high dividend payout stock. However, to maintain the debt level
 Cost of Debt 3.38% in long run, the Company is likely to retain the earnings at a level that is sufficient for operation.
 Marginal Tax Rate 20.00%
 Terminal growth assumption determined by target earning retention: The sustainable
 Cost of Debt, post tax 2.71%
 retention rate is estimated to be 5%, which is the level that the Company will be able to maintain
 Effective WACC 8.99% its capital structure. Using the sustainable growth formula, the perpetual growth rates are
 Source: Bloomberg and Team’s Estimates derived in 2 stages, 2.32% and 1.31%, with the assumption that the Company will be able to
 maintain ROE at 46.32% in the first stage, and reduce down to 26.24% as profit margin will
 Figure 21: Target Price converge to industry average in the long run (Appendix 16).
 Weight Price Additional country risk premium added to reflect political instability: The cost of equity is
 FCFF 47% 40.64 calculated using CAPM with 10-year Thai government bond risk-free rate of 2.86%. Market return
 DDM 53% 42.14 of 11.98% and beta of 0.57 are derived from 10-year weekly data. With additional country risk
 Target Price 41.50 premium to reflect the higher risk during political and economic instability, the final cost of
 equity is 9.48% (Figure 20).
 Source: Team’s Estimates
 Weighted average cost of capital: The cost of debt of 3.38% is derived from company’s historical
 short-term borrowing rate, and 20% tax rate is applied. As the capital structure changes during
 the forecast period, we calculate different WACC for each forecasted year to include the effect of
 Figure 22: Valuation Range DCC higher leverage (Appendix 17 & 18). With all components combined, we arrive the effective
 WACC of 8.99% (Figure 20).
 DDM

 FCFF Weighting of Valuation Models
 PE
 The shareholder structure serves as a good proxy for the allocated weights to the models. 47% is
 PE Band assigned to FCFF representing the portion owned by the family and board of directors whereas
 EV/EBIT… the remaining 53% reflects the minor shareholders. The long-term holding period reflects the
 20 30 40 50 60
 investment for dividend purpose. Hence, DDM is used to value DCC for this group of investors,
 Price (THB) representing 53% of the firm’s value. By combining both valuation methods, the fair price for DCC
 Target Price THB 41.50 is THB 41.50 (Figure 21).
 Current Price THB 55.75
 Target Price Relative valuation also confirms: Apart from DCF methods, we also consider relative valuation
 Relative Valuation by using P/E, P/E Band and EV/EBITDA multiple analyses in order to reflect better market view
 (THB/share)
 P/E Band 39.13 on DCC. DCC fundamentally has exposure in both manufacturing and retailing businesses. Since
 P/E 43.33 there are no perfect comparable companies, cross-sectional peers were chosen for better
 comparison. All the chosen comparable companies can be classified into 3 tiers based on their
 EV/EBITDA 45.64
 business fundamentals: (1) local construction material manufactures (2) local home
 Source: Team’s Estimates
 improvement retailers (3) regional tile manufacturers (Appendix 19 - 22).

 Valuation confirms stock overvalued: Both DCF and relative valuation give the target price
 estimates that are in line with each other (Figure 22). However, we choose DDM and FCFF for our
 Figure 23: High ROE is offset by high P/BV
 ROE
 valuation of DCC as it best suits the nature of Company’s stock. At the current price of THB 55.75,
 (%) DCC TB DCC is overvalued with the potential downside of 25.56% by the end of 2015. Hence, we ground
50.00
 for the “SELL” recommendation with the target price of THB 41.50.
 Average

40.00
 In addition, the indicative valuation multiples obtained from PEG further confirms that DCC’s
30.00 stock price is not justified by its growth outlook. After incorporate the Company’s growth, DCC
 SCC TB Average has PEG ratio of 7.4x, which significantly higher than peer’s average of 3.0x. Hence, with the
20.00 TTC VN
 expected growth rate of 2-3% per annum, the results from all valuation methods confirm that the
 TGCI TB
10.00 current price of THB 55.75 per share is overvalued.
 GLOBAL TB P/BV
 0.00
 0.00 2.00 4.00 6.00 8.00
 (Times)
 10.00
 Current price implies unobtainable growth rate
 PBV
 Based on the current market price of THB 55.75, it implied the sustainable growth rate of 4.12%.
 Note: The label is Bloomberg ticker This data reflects an over-expectation from the market since DCC is a matured company, and
 Source: Bloomberg expected to be threatened by many external factors. With the changing competitive landscape
 and having no clear growth drivers, achieving such ambitious growth expectation might be
 Figure 24: DCC P/E Band challenging for DCC.
 PER (Times)
 25

 20
 +2.0 SD Market view on DCC
 +1.0 SD
 15 +0.5 SD
 LT average As of December 2014, DCC is trading at current P/E Ratio of 18.9x, which is higher than historical
 10 -0.5 SD
 -1 SD long-term average P/E Ratio +1 SD, and higher than current PER of SET which is 16.9x (Figure
 5 24). Therefore, current trading price of DCC is quite expensive while the Company is in mature
 0 stage with slowing down trend leading to less attractive in terms of current valuation. In addition,
 2001
 2002
 2003
 2004
 2005
 2006
 2007
 2008
 2009
 2010
 2011
 2012
 2013
 2014

 recently DCC’s daily trading volume is only 17 million Baht indicating the low daily turnover of
 Source: Bloomberg 0.075%. Furthermore, comparing DCC to SET in the bullish trend in the past, DCC tends to
 underperform SET (Appendix 23 & 24).
 7
Financial Analysis
 2012 2013 2014 F 2015 F 2016 F 2017 F 2018 F 2019 F
 LIQUIDITY RATIOS
 Current Ratio 1.01 0.89 0.87 0.82 0.79 0.78 0.78 0.78
 Quick Ratio 0.17 0.13 0.13 0.12 0.12 0.12 0.12 0.12
 Cash Ratio 0.10 0.08 0.08 0.07 0.07 0.07 0.07 0.07
 PROFITABILITY RATIOS
 Gross Profit Margin 39.17% 41.06% 40.51% 40.49% 40.51% 40.46% 40.39% 40.29%
 Operating Profit Margin 21.89% 22.00% 21.28% 21.21% 21.20% 21.13% 21.05% 20.95%
 Net Profit Margin 16.70% 17.25% 16.65% 16.57% 16.50% 16.40% 16.33% 16.24%
 Return on Equity 45.79% 46.83% 43.12% 43.52% 44.40% 45.03% 45.71% 46.32%
 Return on Assets 27.42% 25.99% 22.90% 22.41% 21.93% 21.61% 21.54% 21.57%
 LEVERAGE RATIOS
 Debt-to-Equity Ratio 0.30 0.43 0.47 0.54 0.61 0.63 0.65 0.65
 Interest Coverage Ratio 105.34 69.54 45.43 41.91 37.16 33.70 33.02 32.17
 Cash Flow to Debt Ratio 1.35 1.22 1.08 0.94 0.87 0.88 0.83 0.89
 Debt-to-EBITDA Ratio 0.46 0.63 0.74 0.83 0.91 0.92 0.94 0.92
 EFFICIENCY ACTIVITY RATIOS
 Assets Turnover 1.64 1.51 1.38 1.35 1.33 1.32 1.32 1.33
 Inventory Days 111.13 129.45 138.50 139.50 142.00 143.00 143.50 144.00
 Accounts Receivable Days 6.43 5.87 5.90 6.30 6.50 6.70 6.90 7.00
 Accounts Payable Days 53.68 52.41 52.41 53.00 53.00 53.50 53.50 54.00
 Cash Conversion Cycle 63.88 82.91 91.99 92.80 95.50 96.20 96.90 97.00
 Earnings per Share (THB) 3.10 3.18 2.93 2.99 3.06 3.12 3.18 3.23
 Dividend per Share (THB) 3.08 3.18 2.93 2.99 3.06 3.12 3.18 3.23

 Figure 25: Decreasing in sale growth
 Earnings: With the slower-than-expected Thai economic recovery as well as the increasing in
 Mn THB % YoY
10,000 8.0 competition in the tile market, we expect DCC’s earnings growth to slow down with the revenue
8,000 4.0
 and net income CAGR of 1.29% and 0.27% during 2013-2019, respectively (Figure 25).
6,000 0.0
 Slowdown in store expansion: From past aggressive store expansion, we are convinced that the
4,000 -4.0 Company has already captured the opportunity both in Bangkok and provincial areas. An
2,000 -8.0 international expansion is also unlikely to take place, thus, the decreasing trend in store
 - -12.0 expansion is expected to continue. In year 2014, we expect number of stores to remain
 unchanged, at 195 stores, due to weak demand in upcountry area. Afterward, the number of new
 Sales(LHS) Net Income(LHS) stores open is expected to decline; from 3 new stores in 2015 to only 1 store by 2019, with the
 Sales growth(RHS) NI growth(RHS) total of 206 stores by the end of 2019 (Figure 26).
 Source: Company Data and Team’s Estimates
 Unsustainable same store sales growth: Looking forward, there will be less opportunity to
 capture new market since DCC has already had an extensive store coverage throughout Thailand.
 Figure 26: Slowdown in store expansion
 Moreover, the weak economic condition is expected to pressure SSS growth down to -5.75% in
Stores
210 2014 due to lower purchasing power of DCC’s target customers. With a slow effect from
 1
 2 government continuous attempt to boost the economy, we expect the recovery to start in 2015
 2
200
 -1 3
 3 and 2016. This will lead to a slight SSS growth of 1.31% YoY. However, the increasing SSS growth
 4 is unlikely to remain throughout the forecast period due to cannibalization from store expansion
190
 192
 as well as the change in competitive landscape of tile market. We expect a slowdown in SSS
 195 195 198 201 203 205
180
 growth from 1.56% in 2016 to 0.91% in 2019.

 Slight decrease in profit margin: DCC has already enjoyed the benefits from the reduction in
 Existing stores New stores
 amount of natural gas used in production. However, the further improvement might be limited.
 Source: Company Data and Team’s Estimates According to Ministry of Energy, looking forward natural gas supply will be lower which will lead
 to the increase in imported natural gas that is sold at higher price. Hence, we expect the gross
 Figure 27: Increasing in Cash Conversion profit margin to slightly decrease from 41.06% in 2013 to 40.29% in 2019 due to the increase in
 Cycle
 natural gas price. Also, operating profit margin and net profit margin are expected to slightly
 2019F drop.
 2018F
 2017F
 Cash Flows: The Company has planned to expand sales by capturing more wholesales customers:
 such as real estate contractors and home improvement retailers, and increasing the product lines
 2016F
 offered. These ongoing strategies are expected to result in the longer accounts receivable and
 2015F
 inventory days. Cash conversion cycle is expected to increase from 83 days in 2013 to 97 days in
 2014F
 2019 (Figure 27).
 2013
 2012 High potential of increasing in debt financing: In previous years, the Company has financed its
 Days
 -40 10 60 110 160
 operation mainly through equity and short-term debt. As the cash conversion cycle increases,
 Account Payable Days more funding is needed. We expect the incurring of short-term debt to support company
 Operating Cycle (Days)
 Cash Conversion Cycle (Days) operation. Debt-to-equity ratio is expected to increase from 0.43 in 2013 to 0.65 times in 2019
 Source: Company Data and Team’s Estimates
 (Figure 28). The ability to pay interest will decline as interest expense increases, supported by

 8
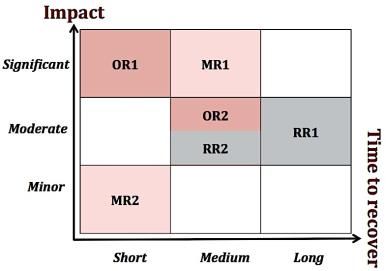
Figure 28: Rise in Debt-to-Equity ratio the decrease in interest coverage ratio from 69.54 in 2013 to 32.17 times at the end of forecast
0.80
 0.61 0.63
 0.65 0.65 period, 2019.
0.60 0.54
 0.47
 0.43 Du Pont Analysis: DCC has historically been able to maintain its ROE within the range of 40-
0.40 0.30
 46%. Throughout our forecast period, DCC is expected to retain its ROE at around the same level,
0.20
 with a slight decline from 46.8% in year 2013 to 46.3% in year 2019. However, our Du Pont
 - analysis indicates that the key drivers for such high ROE is an increase in leverage, as reflected by
 a higher equity multiplier (“EQM”) of 1.80 in 2013 to 2.15 times in 2019 (Figure 29). Hence, the
Source: Company Data and Team’s Estimates higher return on equity doesn’t necessarily caused by the margin improvements. (Appendix 25).
Figure 29: Du Pont Analysis indicates
rise in ROE Investment Risks
 Regulatory Risks
 RR1: Increase in rule and regulations for imported tiles
 Tax charged and regulation for imported tiles still remain a key factor to prevent Thai companies
 to outsource from low cost tile manufacturers oversea. The success of Quality Assurance
 introduced by Thai government will help decrease the amount of imported tile due to higher
 quality control. This will reduce competition in local tile market and enhance DCC’s future growth
 opportunity.
Source: Team’s Estimates
Figure 30: Risk Analysis Matrix RR2: Success on government stimulus packages
 Thai government has been trying to reduce the effect on household debt from the past policy of
 first car, first house, as well as rice subsidy scheme. The success of reducing household debt will
 help enhance purchasing power of Thai people, mainly low-to-middle income segment who are
 DCC’s main target customers.

 Macro Risks (Market Risks)
 MR1: Early economic recovery results in increase in DCC sales
 DCC’s sales are highly correlated with Thai GDP at the correlation of 0.97. The faster-than-
 expected economic recovery and stable political situation will help enhance overall sales. The rise
 in volume to 58.73 million sq.m. will increase our target price to THB 47.39 and change our
 Regulatory Macro Operational
 risks risks risks recommendation to hold, while, further increase to 72.90 million sq.m. will change our
 recommendation to buy.
Source: Team’s Estimates

Figure 31: Impact-Recovery Matrix
 MR2: Possibility of foreign fund flow coming into Thai equity market
 Given the current global economy, we believe that there might be some foreign funds flowing into
 Thailand’s equity market. Despite the high possibility of equity market booming, we believe that
 the fund flow will likely to be a selective buy due to the high valuation of SET. In addition, DCC
 tends to receive less benefit from fund flows because it has just been taken out of SET100 Index,
 which represents the top 100 listed companies on SET in terms of large market capitalization
 with high liquidity. This indicates characteristics of DCC that will be some fund limitations: small
 market capitalization and low trading liquidity. Hence, the impact from fund flows on DCC stock
 price may be very limited.

 Operational Risks
 Regulatory Macro Operational
 risks risks risks
 OR1: Decrease in gas price results in better profit
Note: Time to recover is the time we expect One of the main manufacturing costs is coming from natural gas, with contribution of 30% to
the effect from risk factors to last.
Source: Team’s Estimates
 overall cost of production. Natural gas price has been fluctuating and unpredictable (Figure 32);
 however, the decrease in gas price will help reduce cost of product. The reduction in natural gas
Figure 32: Company’s historical Natural price to THB 354.6 will change our recommendation from sell to hold and further fall to THB
Gas cost
THB/MM
 227.7 for a buy recommendation.
 BTU
500 OR2: Success on the introduction of digital and larger-sized tiles
400 By successfully increasing larger-sized and digital tile sales, it will help increase Company average
300 selling price (ASP) since these tiles are sold at 40-50% higher than normal tile price. Instead of
 seeing an increase in sales contribution, we would like to see more effect on average selling price
200
 since the contribution can be misleading if there is any sales promotion. The ASP needs to
100
 increase to THB 142.7 to change our recommendation to hold and increase to THB 154.8 to result
 - in buy recommendation.

 Valuation Risk
Source: Company data
 To test the effect of the macro and operational risks on our recommendation, we perform
Figure 33: Scenario Analysis scenario analysis of changes in sales volume, ASP, and natural gas price. The better and best cases
 Scenario Analysis
 will change our target price to THB 51.25 and THB 60.50 respectively and result in hold
 recommendation. Please see Appendix 28 for more detail on the analysis (Figure 33). In addition,
 Base Better Best we run Monte Carlo Simulation to further examine the probability of changing our
 41.50 51.25 60.50 recommendation. Using 5-year historical standard deviation, the simulation analysis shows that
 there is only a 4% chance that would trigger a change in our recommendation from sell to buy
 Source: Team’s estimates
 and 28% to hold. On the other hands, the possibility of a downside is as high as 68% (Figure 34).
 9
Sensitivity Analysis
 Since Terminal value accounts for the major part of the DCF model, we perform sensitivity
Figure 34: Monte Carlo Simulation
 analysis of changes in perpetual growth rates to our target price. Dividend payout ratio and ROE
 68% 28% 4%
 are used as the sensitive variables as they are the main components of the terminal growth
 SELL HOLD BUY
 (Appendix 29). The upper and lower bounds of long-term ROE are the forecast ratio of last period
 and WACC respectively, while the range of dividend payout ratio is estimated based on the ability
 to payback debt of the company.

 Terminal ROE
 41.43 9.48% 17.86% 26.24% 36.28% 46.32%
 Terminal 90.0% 43.45 46.19 49.64 55.13 63.03
 Dividend 92.5% 41.27 43.05 45.15 48.20 52.04
Source: Team’s Estimates Payout 95.0% 39.25 40.29 41.50 42.98 44.75
 Ratio 97.5% 37.39 37.84 38.31 38.91 39.55
 100.0% 35.66 35.66 35.66 35.66 35.66

Figure 35: Real Option Valuation Other Upside Potentials
Summary
 Announcement of international expansion plan
 Real Option Summary (In Mn THB)
 The opening of AEC will present an opportunity for DCC to expand its business oversea. This can
 Spot Value 1,459 be done by both expanding the production base and establishing Company’s own outlet stores.
 However, from the statement made by DCC’s management team, the most likely case is to open its
 Strike Value 1,614
 own outlet stores. We see this opportunity as an option to expand internationally whose
 Volatility (%) 50% characteristic is similar to call option. This can be valued using Black-Scholes option pricing
 3-Y Risk free rate (%) 2.3% model (Appendix 30). The real option value is THB 473.1 million or THB 1.16 on per share basis
 (Figure 35). The option is currently out-of-the-money due to the riskiness of entering into new
 Real Option Value 473
 market that has no prove of success.
 Number of shares outstanding (Mn) 408
 DCC as a potential target acquisition company
 Real Option Value/share (THB) 1.16
 Construction material industry in Thailand has been growing toward the consolidation trend.
Source: Team’s estimates
 SCC, the largest cement-building material company in Thailand, has been acquiring various
 companies in the industry. It partially staked in TGCI, a tile manufacturer, in 2008 and also in
 GLOBAL, a one-stop shopping home center, in 2012. Those target companies help enhance and
 strengthen business of SCC. By looking at both side of the acquisition, being an acquirer as well as
 being a target company, we believe that there is low chance for DCC to be an acquirer due to its
 excess production capacity throughout the forecast period (Appendix 31). On the other hand, as
 one of the leader in tile market with a large production capacity and strong brand reputation in
 particular market; DCC can potentially be a target company for acquisition. Observing from past
 transactions, the company is likely to be bought at premium of around 6.70% to 26.44% at a price
 range of 60.12 to 70.10 Baht per share (Appendix 32).

 Additional Downside Risk
 Probable increase in Value-Added Tax will slow down the consumption
 The government is considering increasing the Value-Added Tax or VAT, which is planned to be
 lifted from current 7% to 8% next year and to 10% in following years. This could potentially
 slowdown the recovery of economy as observed from Japan. Especially in low-price segment,
 DCC’s main customers, tend to have less incentive to spend because they are more sensitive to the
 change in VAT. Given the increase in VAT take place, we expect the money to be spent mostly on
 daily necessities with a small leftover spared for home renovation as necessary.

 10
Appendix Index
Financial Statements Page
Appendix A: Income Statement 13
Appendix B: Income Statement (Common-Size) 13
Appendix C: Balance Sheet 14
Appendix D: Balance Sheet (Common-Size) 15
Appendix E: Statement of Cash Flow 16

Business Description
Appendix 1: Brands under DCC 17
Appendix 2: Product Types 18
Appendix 3: Business Structure and Subsidiaries 19
Appendix 4: Key Management Personnel 21
Corporate Governance
Appendix 5: Corporate Governance 27

Industry analysis
Appendix 6: Absolute and Relative Increase in Household Debt 28
Appendix 7: Growth of Renovation Market 28
Appendix 8: Domestic Manufacturers Market 29
Appendix 9: DCC’s Five Forces Analysis 30
Appendix 10: Growth of Specialty Store and Overall Modern Trade
 31
Investment summary
Appendix 11: Imported Tiles 32
Appendix 12: Home improvement centers (modern trade) 33
Appendix 13: Comparison among DCC and other improvement centers 34
Appendix 14: Home Improvement Centers store footprint 34
Appendix 15: Calculations of upside and downside beta between DCC stock price and SET 100
index
 35
Valuation
Appendix 16: DCF Assumptions 36
Appendix 17: WACC Assumptions 41
Appendix 18: DCF Analysis 42
Appendix 19: Relative Valuation 43
Appendix 20: DCC Expected Return-to-Beta comparison 45
Appendix 21: DCC Price-to-Earnings Ratio to Earning Growth Comparison 46
Appendix 22: DCC Return on Equity to Price-to-Book Value Comparison 47
Appendix 23: PE Band 48
Appendix 24: DCC underperforms SET over the past 3 years 48

Financial Analysis
Appendix 25: Du Pont Analysis 49

Investment Risks

 11
Appendix 26: Impact-Probability Risk Analysis Matrix 50
Appendix 27: Impact-Time to recover Risk Analysis Matrix 50
Appendix 28: Scenario Analysis 51
Appendix 29: Sensitivity Analysis 51
Appendix 30: Real Option Valuation 52
Appendix 31: Production Capacity Analysis 53
Appendix 32: Comparable M&A Transaction 55

Others
Appendix 33: Management Structure 56
Appendix 34: Tile manufacturing factories 57
Appendix 35: Major shareholders structure 58

 12
Appendix A: Income Statement
Income Statement (Mn THB) 2012 2013 2014F 2015F 2016F 2017F 2018F 2019F
Revenue from sales 7,603 7,546 7,211 7,388 7,595 7,779 7,963 8,148

Costs of goods sold
 (4,625) (4,447) (4,290) (4,396) (4,518) (4,632) (4,747) (4,865)
Gross income 2,978 3,099 2,921 2,991 3,077 3,148 3,216 3,283
Other income 35 18 21 22 22 23 24 24
Selling expenses (761) (755) (721) (739) (760) (778) (796) (815)
Administrative expenses (588) (701) (687) (707) (729) (749) (767) (785)
Income before finance costs income tax 1,664 1,661 1,534 1,567 1,610 1,644 1,676 1,707
Finance costs (16) (24) (34) (37) (43) (49) (51) (53)
Income before income tax 1,648 1,637 1,500 1,530 1,567 1,595 1,625 1,654
Income tax (379) (335) (300) (306) (313) (319) (325) (331)
Net Income 1,270 1,302 1,200 1,224 1,253 1,276 1,300 1,323

Appendix B: Income Statement (Common-Size)
Income Statement (Common-Size) 2012 2013 2014F 2015F 2016F 2017F 2018F 2019F
Revenue from sales 100.0% 100.0% 100.0% 100.0% 100.0% 100.0% 100.0% 100.0%
Costs of goods sold 61% 59% 59% 60% 59% 60% 60% 60%
Gross income 39.2% 41.1% 40.5% 40.5% 40.5% 40.5% 40.4% 40.3%
Other income 0.5% 0.2% 0.3% 0.3% 0.3% 0.3% 0.3% 0.3%
Selling expenses 10.0% 10.0% 10.0% 10.0% 10.0% 10.0% 10.0% 10.0%
Administrative expenses 7.7% 9.3% 9.5% 9.6% 9.6% 9.6% 9.6% 9.6%
Income before finance costs income tax 21.9% 22.0% 21.3% 21.2% 21.2% 21.1% 21.1% 20.9%
Finance costs 0.2% 0.3% 0.5% 0.5% 0.6% 0.6% 0.6% 0.7%
Income before income tax 21.7% 21.7% 20.8% 20.7% 20.6% 20.5% 20.4% 20.3%
Income tax 5.0% 4.4% 4.2% 4.1% 4.1% 4.1% 4.1% 4.1%
Net Income 16.7% 17.2% 16.6% 16.6% 16.5% 16.4% 16.3% 16.2%

 13
Appendix C: Balance Sheet
Balance Sheet (Mn THB) 2012 2013 2014F 2015F 2016F 2017F 2018F 2019F
ASSETS
 Cash and cash equivalents 189 169 180 185 190 194 199 204
 Trade accounts and notes receivable - net 137 106 127 128 143 143 158 154
 Inventories - net 1,550 1,605 1,651 1,709 1,806 1,823 1,910 1,929
 Other current assets 36 35 35 36 37 38 39 40
Total Current Assets 1,911 1,915 1,994 2,058 2,176 2,198 2,306 2,326
 Other investment - net
 Property, plant and equipment - net 2,701 2,942 3,073 3,238 3,392 3,472 3,512 3,529
 Goodwill 104 104 104 104 104 104 104 104
 Intangible assets - net 7 15 16 16 17 17 17 17
 Deferred income tax - asset 119 127 122 125 128 131 134 137
 Other non - current assets 37 38 35 36 37 38 39 40
Total Non - Current Assets 2,967 3,226 3,350 3,519 3,678 3,762 3,807 3,827

TOTAL ASSETS 4,877 5,141 5,343 5,577 5,854 5,960 6,112 6,154

LIABILITIES AND SHAREHOLDERS' EQUITY
LIABILITIES
 Short - term loans from financial institutions 840 1,185 1,312 1,520 1,712 1,781 1,861 1,852
 Trade accounts and notes payable 689 588 644 633 679 678 713 726
 Accrued income tax 183 148 141 145 149 153 156 160
 Other current liabilities 176 236 201 206 212 217 222 227
Total Current Liabilities 1,887 2,157 2,298 2,504 2,752 2,829 2,953 2,965
 Unfunded provident fund 51 53 55 57 59 61 63 65
 Employee benefits obligation 118 136 151 166 181 196 211 226
 Deferred income tax - liability 23 33 32 33 34 34 35 36
Total Non - Current Liabilities 193 222 238 255 273 291 309 327

TOTAL LIABILITIES 2,080 2,379 2,536 2,760 3,025 3,120 3,262 3,292

SHAREHOLDERS’ EQUITY
 Issued and paid - up - 408,000,000 shares 408 408 408 408 408 408 408 408
 Premium on share capital 506 506 506 506 506 506 506 506
 Retained earnings
 - Appropriated for legal reserve 41 41 41 41 41 41 41 41
 - Unappropriated 1,797 1,757 1,799 1,804 1,812 1,817 1,823 1,829
Shareholders' equity of the Company 2,752 2,711 2,753 2,759 2,767 2,772 2,778 2,784
 Non-controlling interests in subsidiaries 46 50 54 58 62 67 72 78
TOTAL SHAREHOLDERS' EQUITY 2,798 2,761 2,807 2,817 2,829 2,839 2,851 2,862

TOTAL LIABILITIES AND SHAREHOLDERS' EQUITY 4,877 5,141 5,343 5,577 5,854 5,960 6,112 6,154

 14
You can also read