Central Queensland Coal Project Chapter 19A - Economic - Central Queensland Coal CQC SEIS, Version 3 October 2020
←
→
Page content transcription
If your browser does not render page correctly, please read the page content below
Central Queensland Coal Project
Chapter 19A - Economic

Central Queensland Coal

CQC SEIS, Version 3

October 2020
Central Queensland Coal Project
Chapter 19A - Economic

Contents
19A          Economic .................................................................................. 19A-1
19A.1        Introduction .................................................................................................................... 19A-1
      19A.1.1 Environmental Objectives Outcomes ..................................................................... 19A-1
      19A.1.2 Terms of Reference Addressed in this Chapter ...................................................... 19A-2
      19A.1.3 Relevant Legislation and Policy Instruments .......................................................... 19A-2
      19A.1.4 Terminology ............................................................................................................ 19A-3
19A.2        Assessment Methodology............................................................................................... 19A-3
      19A.2.1 Terms of Reference Requirements ......................................................................... 19A-3
      19A.2.2 Economic Impact Assessment ................................................................................ 19A-4
19A.3        Description of Existing Economic Environment ............................................................ 19A-10
      19A.3.1 Size and Structure of the Existing Economy ......................................................... 19A-11
      19A.3.2 Industry Analysis ................................................................................................... 19A-12
      19A.3.3 Other Project relevant to the Economic Assessment........................................... 19A-21
      19A.3.4 Agricultural Production ........................................................................................ 19A-22
      19A.3.5 Socio-Economic Index for Areas ........................................................................... 19A-24
19A.4        Potential Impacts .......................................................................................................... 19A-24
      19A.4.1 Project Expenditures ............................................................................................ 19A-24
      19A.4.2 Construction Impacts............................................................................................ 19A-26
      19A.4.3 Operation Impacts ................................................................................................ 19A-28
      19A.4.4 Value of Coal Exported ......................................................................................... 19A-32
      19A.4.5 Opportunity Cost of the Project ........................................................................... 19A-44
19A.5        Mitigation Measures ..................................................................................................... 19A-45
      19A.5.1 Potential Localised Inflation ................................................................................. 19A-45
      19A.5.2 Increased Labour Costs......................................................................................... 19A-45
      19A.5.3 Local and Regional Infrastructure......................................................................... 19A-46
19A.6        Dispute Resolution ........................................................................................................ 19A-46
19A.7        Cumulative Impact Assessment .................................................................................... 19A-46
      19A.7.1 Beneficial Cumulative Impacts ............................................................................. 19A-46
      19A.7.2 Adverse Cumulative Impacts ................................................................................ 19A-47
19A.8        Qualitative Risk Assessment ......................................................................................... 19A-48
19A.9        Conclusion ..................................................................................................................... 19A-53

CQC SEIS, Version 3, October 2020                                                                                                             19A-i
Central Queensland Coal Project
Chapter 19A - Economic

19A.10         Commitments ............................................................................................................... 19A-53

Figures
Figure 19A-1: Economic impact assessment local study area ....................................................... 19A-5
Figure 19A-2: Economic impact assessment regional study area................................................... 19A-6
Figure 19A-3: Unemployment rate in Livingstone Shire, Central Queensland SA4 and Queensland
...................................................................................................................................................... 19A-14
Figure 19A-4: Labour force participation rate .............................................................................. 19A-15
Figure 19A-5: Employment by occupation type ........................................................................... 19A-17
Figure 19A-6: Proportion of persons with a post school qualification ......................................... 19A-17
Figure 19A-7: Direct and indirect contribution to output ($m), project operational phase ........ 19A-29
Figure 19A-8: Direct and indirect contribution to household income ($m), project operational phase
 ...................................................................................................................................................... 19A-30
Figure 19A-9: Direct and indirect contribution to employment (ftes), project operational phase….
 ...................................................................................................................................................... 19A-31
Figure 19A-10: Direct and indirect contribution to value added ($m), project operational phase….
...................................................................................................................................................... 19A-32
Figure 19A-11: Hard coking coal prices free on board (FOB), US$/t ............................................ 19A-35
Figure 19A-12: Semi soft coking coal prices FOB, US$/t ....................................................................... 36
Figure 19A-13: Hard coking coal versus semi-soft coking coal prices, US$/t ............................... 19A-36
Figure 19A-14: Hard coking coal price forecast, US$/t ................................................................. 19A-38
Figure 19A-15: Hard coking coal price forecast, US$/t (including SEIS forecast) ......................... 19A-38
Figure 19A-16: Average monthly prices of Newcastle benchmark thermal coal, US$/t .............. 19A-40
Figure 19A-17: Average monthly prices of Newcastle benchmark thermal coal, US$/t .............. 19A-41
Figure 19A-18: Thermal coal price forecast, US$/t (including SEIS forecast) ............................... 19A-42

Tables
Table 19A-1: ToR cross-reference ................................................................................................... 19A-2
Table 19A-2: Economic impact assessment study areas ................................................................ 19A-3
Table 19A-3: Measures of economic impact .................................................................................. 19A-7
Table 19A-4: Population projections 2016-2036 .......................................................................... 19A-11
Table 19A-5: Nominal gross regional product by industry for Central Queensland and Queensland
...................................................................................................................................................... 19A-12

CQC SEIS, Version 3, October 2020                                                                                                                      19A-ii
Central Queensland Coal Project
Chapter 19A - Economic

Table 19A-6: Labour force size ...................................................................................................... 19A-13
Table 19A-7: Unemployment rate ................................................................................................ 19A-14
Table 19A-8: Labour force participation rate ............................................................................... 19A-15
Table 19A-9: Employment by industry.......................................................................................... 19A-16
Table 19A-10: Counts of Australian businesses LSC and LGA February 2017............................... 19A-18
Table 19A-11: Counts of Australian businesses, Broadsound – Nebo SA2, February 2017 ......... 19A-19
Table 19A-12: Counts of Australian businesses, Central Queensland SA4, February 2017.......... 19A-20
Table 19A-13: Total businesses by industry section, regional comparison, 2017 ........................ 19A-21
Table 19A-14: Projects with the potential to contribute to cumulative economic impacts ........ 19A-22
Table 19A-15: Population by index of relative socio-economic disadvantage as at 2016 census 19A-24
Table 19A-16: Anticipated total construction costs ($m) by origin of purchase .......................... 19A-25
Table 19A-17: Anticipated operational costs ($m) by origin of purchase, Central Queensland .. 19A-26
Table 19A-18: Anticipated production, export value and Queensland Government coal mining
royalties......................................................................................................................................... 19A-34
Table 19A-19: Semi-soft coking coal price forecast ...................................................................... 19A-34
Table 19A-20: High quality thermal coal price forecast ............................................................... 19A-34
Table 19A-21: Semi-soft coking coal price forecast, 2018-43....................................................... 19A-37
Table 19A-22: Relative coal quality semi soft coking coal ............................................................ 19A-39
Table 19A-23: Price forecast for Newcastle benchmark thermal coal, US$/t .............................. 19A-40
Table 19A-24: Relative coal quality thermal coal ......................................................................... 19A-42
Table 19A-25: Thermal coal and semi-soft coking coal price forecast, 2018-2037 ...................... 19A-43
Table 19A-26: Production, export value and Queensland Government coal mining royalties,
commodity insights coal price forecast ........................................................................................ 19A-44
Table 19A-27: Qualitative measure of likelihood ......................................................................... 19A-48
Table 19A-28: Qualitative measures of consequence .................................................................. 19A-49
Table 19A-29: Qualitative impact assessment matrix .................................................................. 19A-49
Table 19A-30: Assessment of positive economic impacts ............................................................ 19A-50
Table 19A-31: Qualitative risk assessment of negative economic impacts .................................. 19A-52
Table 19A-32: Commitments - Economic ..................................................................................... 19A-53

CQC SEIS, Version 3, October 2020                                                                                                                 19A-iii
Central Queensland Coal Project
Chapter 19A - Economic

Terms and Abbreviations

 $m                               In millions of dollars

 ABS                              Australian Bureau of Statistics

 AUD                              Australian Dollars

 EIS                              Environmental Impact Statement

 FOB                              Free on Board

 FTE                              Full Time Equivalent

 GRP                              Gross Regional Product

 HCC                              Hard Coking Coal

 HGTC                             High Grade Thermal Coal

 kcal/kg                          kilocalorie/kilogram (1000 calories per kilogram)

 LGA                              Local Government Area

 LSC                              Livingstone Shire Council

 NAR                              Net As Received

 PCI                              Pulverised Coal Injection

 SA                               Statistical Area

 SEIS                             Supplementary Environmental Impact Statement

 SPP                              State Planning Policy

 SSCC                             Semi Soft Coking Coal

 t                                tonnes

 ToR                              Terms of Reference

 US                               United States

CQC SEIS, Version 3, October 2020                                                     19A-iv
Central Queensland Coal Project
Chapter 19A - Economic

19A Economic
19A.1 Introduction

This chapter describes the existing economic environment relevant to the Central Queensland Coal
Project. The chapter includes methods of assessment, relevant regulatory framework, existing
economic environment including an economic baseline assessment, potential beneficial and
adverse impacts, and proposed mitigation measures to minimise social and economic impacts to
the region and more broadly.
This chapter has been updated since the original Environmental Impact Statement (EIS) to
incorporate all of the work with reference to economic impact assessment into one consolidated
chapter and associated appendix (Appendix 14A). That is, the original technical Economic
Assessment report that was previously provided as Appendix 10A to the EIS has now been
updated and incorporated within this chapter, along with other work that has been undertaken as
part of the SEIS process. The updated data tables that support this chapter are included at
Appendix 14A to this SEIS (v3), and the original Economic Assessment Technical Report can still be
found at Appendix 10A of the EIS.
Chapter 3 provides responses to agency comments on the economic assessment in relation to SEIS
v2.
The Central Queensland Coal Project will provide significant positive contributions to the
Queensland economy, with the projected total value of exports expected to be in the order of $7.8
billion (AUD) to $8.2 billion (AUD) and the resulting Queensland Government royalties generated
being between $703.3 million (AUD) and $766.0 million (AUD).
The Project is anticipated to produce an estimated 51.0 million tonnes of semi-soft coking and
high-grade thermal coal over the life of the Project. The vast majority of coal produced is
anticipated to be semi-soft coking coal, with high grade thermal coal to be produced only during
2033 and 2035 of the Project.
The exchange rate outlook for the Australian dollar is anticipated to remain, at least in the
medium term, at approximately ~US$0.76 (Economy Forecast Agency 2020). The price of semi-soft
coking coal is anticipated to decrease marginally from US$130 per tonne to approximately US$125
per tonne (or AUD$171 per tonne to approximately AUD$164 per tonne) in the short to medium
term. The price of high grade thermal coal is anticipated to remain at approximately US$95 per
tonne (or AUD$125 per tonne) in the medium term.
Based on the assumed coal prices and exchange rate, the total export value of the coal produced is
estimated to be AUD$8.2 billion over the life of the project. Assuming Queensland coal mining
royalty rates remain unchanged throughout the life of the Project, this will yield royalties of
approximately AUD$766.0 million over the life of the Project.

19A.1.1         Environmental Objectives Outcomes
Objectives and outcomes for social and economic matters that are specific to the Project are given
in Table 1 of the Project ToR. The overarching objective for social matters is to operate the Project
in a way that avoids or mitigates adverse social impacts and capitalises on opportunities for local
industries and communities. This objective is aligned with the Strong and Sustainable Resource

CQC SEIS, Version 3, October 2020                                                                19A-1
Central Queensland Coal Project
Chapter 19A - Economic

Communities Act, section 3(1) which states that the object of the Act is to ensure that “residents of
communities in the vicinity of large resource projects benefit from the construction and operation
of the projects”.
Specifically, the environmental objectives and outcomes relevant to Social and Economic Matters
are as follows:
•       The construction and operation of the project should aim to:
        -     Avoid or mitigate adverse social and economic impacts arising from the project and
        -     Capitalise on opportunities potentially available for local industries and communities.

19A.1.2             Terms of Reference Addressed in this Chapter
Table 19A-1 summarises the requirements from the ToR for the Project, and where in this chapter
they are addressed.
Table 19A-1: ToR cross-reference
    Terms of Reference                                                                      Section of the EIS
    8.15 Social and Economic
    Assess the potential adverse and beneficial economic impacts of the project.            Section 19A.4
    Separately address the major stages of the project (e.g. construction, operation,       Section 19A.4.2;
    decommissioning).                                                                       Section 19A.4.3
    Quantify economic impacts where suitable data and methodology can be applied;           Section 19A.4
    otherwise, qualitatively assess the impacts.
    The EIS should at least address:                                                        Refer to Chapter
    •       labour demand, including the ability for labour to be drawn from the existing   19B – Social
            local workforce; and the potential effects this may have on local businesses    Section
            and
    •       relevant prices, which might include wages, input costs and/or household
            goods and services.

19A.1.3             Relevant Legislation and Policy Instruments
Whilst there are no specific Commonwealth and State legislative requirements relating to the
economic environment, the following documents are relevant when considering the economic
impacts to the region because of the Project:
•       Planning Act 2016
•       Regional Planning Interests Act 2014
•       Queensland State Planning Policy (SPP)
•       Environmental Protection Act 1994
•       Queensland Resources and Energy Sector Code of Practice for Local Content 2013 and
•       Central Queensland Regional Plan
The following Local Government plans and schemes refine the strategic intentions of the Central
Queensland Regional Plan and set out desired economic outcomes that may be relevant to the
project:
•       Livingstone Planning Scheme 2018
•       Livingstone Shire Council Corporate Plan 2014 – 2019

CQC SEIS, Version 3, October 2020                                                                              19A-2
Central Queensland Coal Project
Chapter 19A - Economic
• Rockhampton Region Planning Scheme 2015
• Rockhampton Regional Council Corporate Plan 2017 – 2022
• Isaac Regional Council - Broadsound Shire Council Planning Scheme 2005
• Isaac Regional Council Community Strategic Plan 2015-2035
• Isaac Regional Council Corporate Plan 2015-2020 and
• Mackay Isaac Whitsunday Regional Plan
These are described in Chapter 2 – Project Approvals.
19A.1.4 Terminology
19A.1.4.1 Study Area
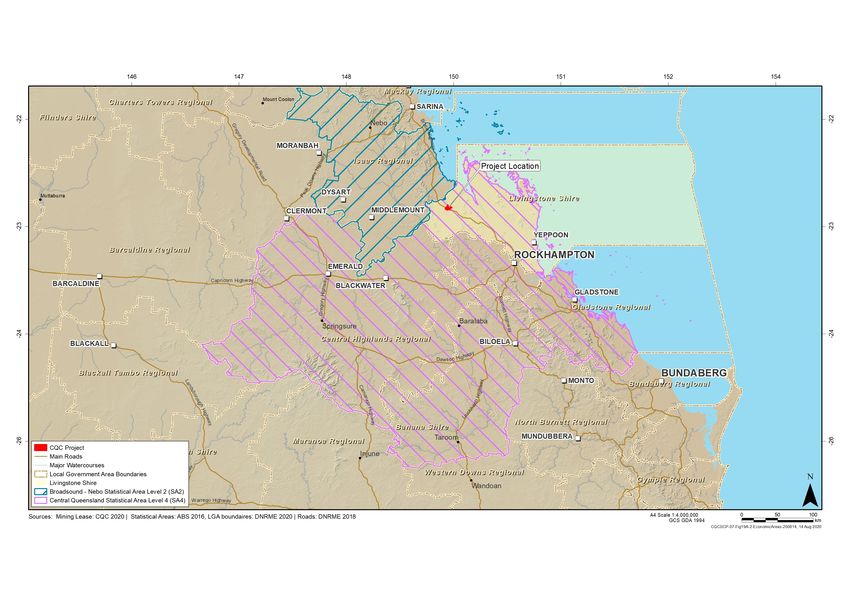
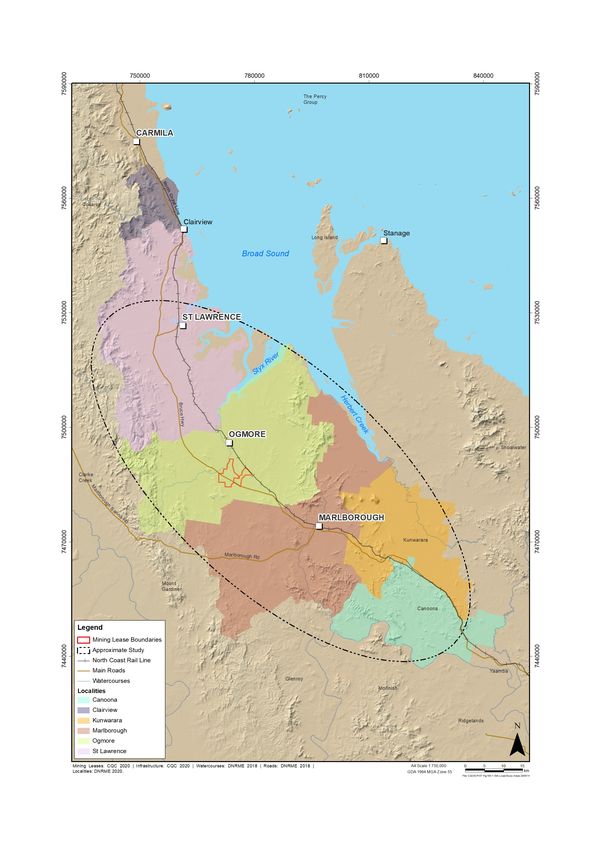
Three study areas have been defined for the Economic Impact Assessment, described in Table
19A-2 below. The local study area is shown in Figure 19A-1 and the regional study area is shown in
Figure 19A-2.
Table 19A-2: Economic impact assessment study areas
Study area Geography Rationale
Local Study Area The state suburbs of Clairview, St Communities within approximately
Lawrence, Ogmore, Marlborough, one hour drive of the project, most
Canoona and Kunwarara. likely to experience direct impacts.
Regional Study Area The Central Queensland Statistical The broader region, most likely to
Area (SA)4 and Broadsound – Nebo experience indirect socio-economic
SA2. impacts and opportunities.
State The State of Queensland. State data provided as comparison.
19A.2 Assessment Methodology
19A.2.1 Terms of Reference Requirements
The Queensland Government has formulated an assessment framework for the exploitation of
energy and mineral resources developed over many years and by successive government
administrations in consultation with the community. This framework allows for the extraction of
energy and mineral resources subject to acceptable mitigation of impacts and the payment of
Queensland Government mining royalties. The assessment framework is, in effect, a large multi-
criteria assessment of proposed projects, included in which is economic assessment. As such, the
EIS is the basis for decision making in relation to an approval.
The economic assessment approach adopted for the Central Queensland Coal Project EIS was
directed by the specific requirements of the EIS ToR. The ToR for the EIS were prepared in draft
and finalised subject to community feedback.
19A.2.1.1 Applied Method Vs Cost Benefit Analysis
The EIS ToR requires an assessment of Project impacts on both the regional and state economies
and supplier markets. As such, a cost benefit analysis would not address the requirements of the
ToR. The approach adopted by the economic assessment is an approach commonly adopted to
assess a range of resource focused proposals. In considering the matter of Project financial
viability, the ToR does not require an assessment of the Project’s viability or the quantum of
return on investment received by the Project proponent. The EIS seeks to assess the spectrum of
CQC SEIS, Version 3, October 2020 19A-3Central Queensland Coal Project
Chapter 19A - Economic
impacts of the Project based on the maximum footprint of development on the environment in
which the Project is undertaken.
19A.2.2 Economic Impact Assessment
19A.2.2.1 Existing Economic Environment
The economic assessment (also referred to as the baseline assessment) provides a baseline to
assess the significance of potential impacts. The baseline assessment used data from the following
sources:
• various Australian Bureau of Statistics (ABS) catalogues, including the Census of Population
and Housing, Labour Force Survey, Regional Population Growth, Australian Business Register
and Agricultural Commodities publications
• office of Economic and Statistical Research
• various local and Queensland Government agencies and
• proprietary models owned by CDM Smith.
CQC SEIS, Version 3, October 2020 19A-4Central Queensland Coal Project Chapter 19A - Economic Figure 19A-1: Economic impact assessment local study area CQC SEIS, Version 3, October 2020 19A-5
Central Queensland Coal Project
Chapter 19A - Economic

Figure 19A-2: Economic impact assessment regional study area
CQC SEIS, Version 3, October 2020                              19A-6
Central Queensland Coal Project
Chapter 19A - Economic

19A.2.2.2          Measures of Economic Impact
The economic contribution and impact assessment utilised a regional input-output approach. This
approach provides indicative results relating to the total demand generated by the Project during
both the construction and operational phases in terms of:
•     output
•     household incomes
•     employment and
•     value added.
These four different measures of economic impact are discussed in Table 19A-3.
Table 19A-3: Measures of economic impact
    Impact Measure                  Description
    Output                          The output impact measures the increase in gross sales throughout the entire
                                    economy by aggregating all individual transactions (direct and indirect)
                                    resulting from the economic stimulus. The output impact provides an
                                    indication of the degree of structural dependence between sectors of the
                                    economy. However, output impacts are regarded as overstating the impact on
                                    the economy as they count all goods and services used in one stage of
                                    production as an input to later stages of production, hence counting their
                                    contribution more than once.
    Household Incomes               The household income impact measures the additional wages, salaries and
                                    supplements paid to households associated with the industry under
                                    consideration and with other industries benefiting from the stimulus to the
                                    economy.
    Employment                      The employment impact measures the number of full-time equivalent (FTE)
                                    positions for one year created directly and indirectly by the stimulus 1.
                                    However, the short-term response to increased demand may be that existing
                                    employees work overtime. Consequently, actual levels of employment
                                    generated (in terms of persons employed) will tend to be lower than those
                                    estimated by the input-output analysis. This short-term employment response
                                    (of working additional overtime) will be more prevalent where the demand
                                    stimulus is likely to be temporary and short lived, or where there is limited
                                    spare capacity in the economy (that is, when the economy is at or near full
                                    employment).
    Value Added                     The value added or Gross Regional Product (GRP) impact measures only the
                                    net activity at each stage of production resulting from a stimulus. GRP is
                                    defined as the addition of consumption, investment and government
                                    expenditure, plus net exports (exports minus imports) from a region. The
                                    value added (or GRP) impact is the preferred measure for the assessment of
                                    contribution to the economy from a stimulus or impact, and as such should be
                                    used to describe the net impact of the event. Value added is the measure of
                                    economic impact resulting from a stimulus that is preferred by economists.
Source: Jensen, R. and West, G. (2002) Community Economic Analysis, Department of Primary Industries: Brisbane, Qld

1Therefore, if impacts are to be spread over a number of years, the FTE estimate (which relates to the annual equivalent) should be
divided by the number of years over which the impact will be spread (in the absence of a clearly defined staging program) to provide an
indicative ongoing employment estimate over the life of the impact.

CQC SEIS, Version 3, October 2020                                                                                                19A-7
Central Queensland Coal Project
Chapter 19A - Economic
The total economic impact of a stimulus or activity comprises the following effects:
• direct or initial effect, being the stimulus for the economic impact. This is typically described as
the change in sales or contribution to final demand by the stimulus or activity and
• flow on effects, comprising production induced effects and consumption induced effects,
these being:
- first round production effects: purchases of inputs required from other industry sectors in
the economy to produce the additional output generated by the stimulus or activity
- industrial support production effects: second, third and subsequent round industrial flow
on effects stimulated by the purchases made in the first round
- consumption induced effects: purchases made by households upon receiving additional
income from labour payments stemming from the production of additional output
generated by the stimulus or activity under assessment.
The extent of these impacts can be represented by multipliers calculated in aggregate for various
regional, state or national economies. There are commonly four multipliers used to measure
impact, being output, household income, employment and value added.
Two sets of multipliers can be generated, namely:
• Type 1 Multipliers, which estimate the direct and production induced impacts of a stimulus or
activity.
• Type 2 Multipliers, which estimate the direct, production induced, and consumption induced
impacts of a stimulus or activity.
Type 1 Multipliers are used in the analysis of this Project. Queensland Treasury’s preference is for
use of only Type 1 Multipliers, given that Type 2 Multipliers typically overstate the extent of
consumption-induced impacts of any given stimulus or activity.
The regional input-output approach has a number of limitations, which may result in
overestimation of impacts, including:
• The absence of capacity constraints such that the supply of each good is perfectly elastic,
implying that each industry can supply whatever quantity is demanded of it and there are no
budget constraints.
• The assumed linearity and homogeneity of the input function, which implies constant returns
to scale and no substitution between inputs. This occurs because the approach assumes
inputs purchased by each industry are a function only of the level of output of that industry.
• Each commodity, or type of commodity, is supplied by a single industry sector, implying there
is only one method used to produce each commodity and each sector has only a single
primary output.
• The assumption that the economy is in equilibrium at given prices and that the economy is not
subject to other external influences.
• The additivity assumption suggests the total effect of carrying on several types of production is
the sum of the separate effects, which is not a true reflection of economic systems.
The limitations are typically most relevant when introducing a wholly new economic driver to a
State or regional economy that may result in significant structural change. However, it is
considered that the introduction of a new coal mine (such as the Central Queensland Coal Project)
to the mature coal and coal logistics sector in Queensland does not fit this criterion.
CQC SEIS, Version 3, October 2020 19A-8Central Queensland Coal Project
Chapter 19A - Economic
19A.2.2.3 Potential Overstatement of Economic Impacts
The approach adopted to assess the economic impacts of the Project mitigates much of the risks.
The assessment presented in the EIS focussed on the stimulus generated by direct supply chain
and the consequent flow-on effects as opposed to assuming an increase in coal production.
As outlined in Section 19A.2.2.2, the potential overstatement of economic impacts when utilising
the input output modelling approach is highest when introducing a wholly new economic driver to
the regional or State economy. However, the introduction of the Central Queensland Coal Project
is not considered as being representative of a new economic driver given the established coal
mining and coal logistics sector in Queensland.
19A.2.2.4 Marginal Vs General Change and Relevance of Assessment Approach
All economic modelling and analytical approaches have limitations. While it is correct to say that
regional impact (or input-output) models implicitly assume there is no constraint on the supply of
inputs, it is also pertinent to consider the context of what the model is being used to assess.
Regional impact models are useful to understand changes in demand for input resulting from a
project, where that project represents a marginal change. Within economics, changes can be
characterised as marginal (unlikely to have a material impact on the structure of the economy) or
general (change that is almost certain to have a major structural impact).
The Queensland economy is characterised by a significant and mature resource industry, with a
major part of that being the coal industry. Put another way, Queensland has a mature coal
industry. The Central Queensland Coal Project represents an incremental addition to an already
established coal industry and is unlikely to represent a major structural change to the Queensland
economy. Hence, the change to regional and local economies resulting from the Central
Queensland Coal Project would be characterised as a marginal change. Given the scale of the
Central Queensland Coal Project and the size of the regional and state economies it is reasonable
to assume that supply markets could be augmented to meet incremental changes in demand
resulting from the Project.
The issue of the appropriateness or otherwise of regional impact models was dealt with in
Hancock Galilee Pty Ltd v Currie and Ors [2017] QLC 35, in which His Honour Cochrane WL (at
paragraph 333 and 334 of his decision) determined that notwithstanding the limitations of the
modelling approach adopted in that resource application that:
“I am satisfied that the analysis done by Mr Brown demonstrates economic benefits
accruing to the Queensland economy including, but not limited to, the potential generation
of substantial revenue in the form of royalties.
Accordingly, so far as the matter of economics is concerned, I am of the view that on
balance the evidence justified recommending granting of the lease and I am further
satisfied that no proper basis has been demonstrated for refusing to grant the lease
premised upon a demonstrable lack of economic benefit.”
In summary, the approach adopted in the economic assessment for the Project is considered
appropriate for the assessment of the proposed resource development and provides sufficient
information to determine the Project generates significant positive economic impacts.
19A.2.2.5 Potential Impact on Other Industries
The issue of the potential for the Project to have negative impacts on other industries was also
addressed within Hancock Galilee Pty Ltd v Currie and Ors [2017] decision. The Project will not
CQC SEIS, Version 3, October 2020 19A-9Central Queensland Coal Project Chapter 19A - Economic have any material impact on the structure of regional and state economies and represents a marginal or incremental increase in resource activity within the region. The most significant potential negative impact on other industries is the withdrawal of the land area associated with the mining lease from grazing, which has been assessed in the economic assessment. Even when considering the potential structural impacts of the resources boom between 2004 and 2012, the extent of purported adverse impacts on other sectors was typically overstated, because issues such as trade and tariff reforms, drought, global monetary policies and the general transitioning of the Australian economy towards a knowledge intense services economy were ignored. 19A.2.2.6 Assessment Methodology and if the Project Proceeds It is noted that some submissions to the EIS raised concerns regarding the veracity of the economic assessment approach adopted because the approach cannot predict if the Project will ultimately proceed or when the Project might proceed. This is true of all analytical approaches, as the timeframe for the Project proceeding, or if the Project proceeds, depends on factors outside the scope of any economic assessment. For example, the Australia Institute submission states that the economic assessment approach adopted for the Kevin’s Corner Coal project anticipated the project would commence in 2014; however, because the project is yet to commence the Australia Institute consider this a failure of the economic assessment methodology, without pointing out that delays in project commencement were largely attributable to a number of appeals relating to the granting of approvals for the project. The Australia Institute similarly cite other examples where projects have not proceeded and claimed that this in some way reflects negatively on the analytical approach adopted. However, delays do not invalidate the economic assessment as no economic analytical approach would be able to predict the appeal of approvals or other similar external influences. This Project has experienced delays and the commencement date, thought at the time of the economic assessment to be 2019 (with a finish date of 2037) is now anticipated to be 2021, and the finish date 2039. However, it was not considered necessary to update the economic model, as the changes in dates are not considered to be material to the overall conclusions drawn with reference to the economic impacts. 19A.3 Description of Existing Economic Environment This section describes the existing local, regional, state and national economies that may be affected by the Project. The following aspects are considered: • size and structure of the existing economy • industry analysis • development pipeline • agricultural production and • socio-economic index for areas. CQC SEIS, Version 3, October 2020 19A-10
Central Queensland Coal Project
Chapter 19A - Economic

19A.3.1           Size and Structure of the Existing Economy
19A.3.1.1           Population Size and Projected Growth
The population of the LSC LGA is projected to increase from 37,954 persons in 2016, to 57,042
persons in 2036, or by 2.1% per annum. The population of Broadsound-Nebo Statistical Area is
projected to increase from 10,522 in 2016 to 12,629 in 2036, or by 0.9% per annum. The rate of
population growth within the LSC LGA over this period is anticipated to be higher than in
Broadsound-Nebo Statistical Area, Central Queensland Statistical Area and in Queensland.
The working age population (i.e. those persons aged between 15 years and 64 years) within the
LSC LGA is projected to increase from 24,116 persons in 2016 to 32,238 persons in 2036, or by
1.5% per annum. The lower rates of growth for the working age population within all regions
relative to the rate of growth for the total population indicates that the proportion of persons
within the working age cohort is anticipated to decline between 2016 and 2036.
The population projections for LSC, Broadsound-Nebo Statistical Area, Central Queensland
Statistical Area and Queensland between 2016 and 2036 is presented in Table 19A-4.
Table 19A-4: Population projections 2016-2036

                                    2016             2021              2026              2031               2036        Avg
                                                                                                                        Annual
                                                                                                                        Growth,
                                                                                                                        2016-2036
 Total Population
 LSC LGA                            37,954           41,427            45,994            51,142             57,042      2.1%
 Broadsound – Nebo                  10,522           10,950            11,475            12,046             12,629      0.9%
 SA2
 Central Queensland                 241,858          260,561           281,178           302,583            324,246     1.5%
 SA4
 Queensland                         4,853,048        5,250,292         5,730,062         6,240,546          6,763,153   1.7%
 Working Age Population (15-64 yrs)
 LSC LGA                            24,116           25,277            27,231            29,475             32,238      1.5%
 Broadsound – Nebo                  7,404            7,600             7,911             8,294              8,687       0.8%
 SA2
 Central Queensland                 158,755          167,398           177,399           188,044            198,898     1.1%
 SA4
 Queensland                         3,180,503        3,371,867         3,619,087         3,887,600          4,159,168   1.4%
Note: Population projection data in this table was the latest available at the time of report preparation
Source: QGSO 2017a, 2016

19A.3.1.2           Gross Regional Product
Gross Regional Product (GRP) represents the market value of all final goods and services produced
within the regional economy during a given period, while Gross State Product is the market value
of that produced within the State economy. Between 2000-01 and 2010-11, the nominal GRP at
current prices within Central Queensland Statistical Area increased from $7,842 million in 2001 to
$20,974 million in 2011, or by 10.3% per annum. Central Queensland Statistical Area recorded
significantly higher rates of GRP growth than Queensland (which achieved 8.8% per annum growth
over the same period). The nominal GRP for Central Queensland Statistical Area is provided in
Table 19A-5.

CQC SEIS, Version 3, October 2020                                                                                              19A-11
Central Queensland Coal Project
Chapter 19A - Economic
Notable drivers of Central Queensland Statistical Area GRP growth were construction, mining,
manufacturing and transport, postal and warehousing.
Table 19A-5: Nominal gross regional product by industry for Central Queensland and Queensland
Industry Central Queensland SA4 Queensland
2001* 2011* Ave 2001* 2011* Ave
Annual Annual
Growth, Growth,
2001- 2001-
2011 2011
Agriculture, forestry and fishing $570 $534 -0.7% $5,079 $6,795 3.0%
Mining $1,943 $6,840 13.4% $7,813 $26,990 13.2%
Manufacturing $789 $1,556 7.0% $11,665 $20,577 5.8%
Electricity, gas, water and waste $341 $778 8.6% $2,178 $6,636 11.8%
services
Construction $441 $3,408 22.7% $7,293 $23,436 12.4%
Wholesale trade $363 $622 5.5% $6,239 $13,524 8.0%
Retail trade $297 $585 7.0% $6,697 $13,732 7.4%
Accommodation and food services $167 $285 5.5% $3,749 $6,555 5.7%
Transport, postal and warehousing $514 $1,123 8.1% $7,267 $15,821 8.1%
Information media and $134 $153 1.3% $3,756 $5,284 3.5%
telecommunications
Financial and insurance services $178 $384 8.0% $6,280 $16,831 10.4%
Rental, hiring and real estate $81 $279 13.2% $2,482 $6,273 9.7%
services
Professional, scientific and $154 $558 13.7% $4,918 $15,421 12.1%
technical services
Administrative and support $87 $218 9.6% $2,109 $5,365 9.8%
services
Public administration and safety $223 $532 9.1% $5,931 $14,079 9.0%
Education and training $289 $500 5.6% $5,131 $10,406 7.3%
Health care and social assistance $288 $630 8.1% $6,441 $16,092 9.6%
Arts and recreation services $29 $28 -0.4% $1,039 $1,495 3.7%
Other services $127 $268 7.8% $2,552 $4,633 6.1%
Ownership of dwellings $337 $811 9.2% $8,774 $23,255 10.2%
Gross Value Added $7,354 $20,094 10.6% $107,393 $253,201 9.0%
Gross Regional Product $7,842 $20,974 10.3% $116,561 $269,866 8.8%
* (current prices - $m)
Source: Queensland Treasury and Trade (2013)
19A.3.2 Industry Analysis
The industry analysis provides an overview of the labour market characteristics within the LSC
LGA, Broadsound-Nebo Statistical Area, Central Queensland Statistical Area and Queensland,
based on several data sources, including the Australian Government’s Department of Employment
(Small Area Labour Market statistics) and the 2016 census (employment by industry and
occupation and post-school qualifications).
CQC SEIS, Version 3, October 2020 19A-12Central Queensland Coal Project
Chapter 19A - Economic
19A.3.2.1 Workforce Size
The size of the labour force in the LSC LGA increased from 14,135 persons in 2006-07 to 18,262
persons in 2015-16, representing an average annual growth rate of 2.6%. The size of the labour
force in Broadsound-Nebo Statistical Area increased from 5,442 persons in 2006-07 to 5,709
persons in 2016-17, or by an average growth rate 0.5% per annum. By comparison, the size of the
labour force in Central Queensland Statistical Area has grown at an average annual rate of 1.6%,
whereas the size of the labour force in Queensland has grown at an average annual rate of 1.4%.
However, between 2014-15 and 2015-16, the size of the labour force in the Broadsound-Nebo
Statistical Area decreased marginally.
A summary of the labour force size in the LSC LGA, Broadsound-Nebo Statistical Area, Central
Queensland Statistical Area and Queensland between 2006-07 and 2015-16 is presented in Table
19A-6.
Table 19A-6: Labour force size
Period LSC LGA Broadsound – Central Queensland
Nebo SA2 Queensland
SA4
2006-07 14,135 5,442 105,831 2,189,074
2007-08 14,691 5,657 109,997 2,240,974
2008-09 15,602 5,835 113,907 2,321,500
2009-10 15,929 5,894 113,587 2,389,025
2010-11 17,002 6,071 119,799 2,403,615
2011-12 17,067 6,210 118,268 2,417,381
2012-13 16,810 6,593 116,409 2,430,818
2013-14 17,712 6,572 122,253 2,466,888
2014-15 18,048 6,166 123,691 2,486,032
2015-16 18,262 5,709 124,329 2,517,488
Ave. Ann. Change, 2006-07 2.6% 0.5% 1.6% 1.4%
to 2015-16
Ave. Ann. Change, 2011-12 1.4% -1.7% 1.0% 0.8%
to 2015-16
Ave. Ann. Change, 2014-15 0.6% -3.8% 0.3% 0.6%
to 2015-16
Source: Department of Employment (various years)
19A.3.2.2 Unemployment Rate
The unemployment rate in the LSC LGA has increased from 4.3% in 2006-07 to 5.8% in 2015-16.
This has similar to that of Central Queensland SA4, until 2014-15 when the unemployment rate in
the LSC LGA began diverging below that of Central Queensland Statistical Area. Notably, the
unemployment rate in Broadsound-Nebo Statistical Area has been low over this period, trending
at around 1% until 2014-15, when the unemployment rate increased to 2.9%.
Figure 19A-2 and Table 19A-7 summarise the unemployment rate trends in the LSC LGA,
Broadsound-Nebo Statistical Area, Central Queensland Statistical Area and Queensland between
2006-07 and 2015-16.
CQC SEIS, Version 3, October 2020 19A-13Central Queensland Coal Project
Chapter 19A - Economic
7%
6%
5%
Unemployment Rate (%)
4% Livingstone LGA
Central Queensland SA4
3%
Queensland
2%
Broadsound - Nebo SA2
1%
0%
Source: Department of Employment (various years)
Figure 19A-3: Unemployment rate in Livingstone Shire, Central Queensland SA4 and Queensland
Table 19A-7: Unemployment rate
Period LSC LGA Broadsound – Central Queensland
Nebo SA2 Queensland
SA4
2006-07 4.3% 0.8% 3.6% 4.0%
2007-08 4.6% 0.9% 4.1% 3.7%
2008-09 5.2% 1.1% 4.9% 4.4%
2009-10 6.0% 1.4% 5.7% 5.7%
2010-11 5.4% 1.1% 5.8% 5.4%
2011-12 4.4% 0.9% 4.8% 5.5%
2012-13 6.5% 1.2% 6.4% 5.9%
2013-14 5.5% 1.5% 5.4% 6.0%
2014-15 6.0% 2.9% 6.3% 6.5%
2015-16 5.8% 2.5% 6.6% 6.2%
Ave. Ann. Change, 2006-07 0.2% 0.2% 0.3% 0.2%
to 2015-16
Ave. Ann. Change, 2011-12 0.3% 0.3% 0.4% 0.1%
to 2015-16
Ave. Ann. Change, 2014-15 -0.2% -0.4% 0.3% -0.3%
to 2015-16
Note: The average annual change figures in this table represent the average annual percentage point change in the unemployment rate.
Source: Department of Employment (various years)
19A.3.2.3 Labour Force Participation Rate
Between 2006-07 and 2015-16, the labour force participation rate in the LSC LGA has consistently
been below that of Broadsound-Nebo Statistical Area, Central Queensland Statistical Area and
Queensland by several percentage points. The labour force participation rate in Broadsound-Nebo
Statistical Area has been consistently higher than that of other benchmarks and has been trending
upwards between 2006-07 and 2015-16. The labour force participation rate in Central Queensland
CQC SEIS, Version 3, October 2020 19A-14Central Queensland Coal Project
Chapter 19A - Economic
Statistical Area has been loosely on par with Queensland, though was significantly higher in 2010-
11 and between 2013-14 and 2014-15.
Figure 19A-3 summarises the labour force participation rate trends in the LSC LGA, Broadsound –
Nebo Statistical Area, Central Queensland Statistical Area and Queensland between 2006-07 and
2015-16.
90%
85%
Labour Force Participation
80%
75%
70% Livingstone LGA
Rate (%)
65% Central Queensland SA4
60%
Queensland
55%
50% Broadsound - Nebo SA2
45%
Source: Department of Employment (various years), ABS 2015, QGSO (2016)
Figure 19A-4: Labour force participation rate
The average labour force participation rate in the LSC LGA was 59.4% in the 2006-07 to 2015-16
period, significantly lower than in Broadsound-Nebo Statistical Area (77.1%), Central Queensland
Statistical Area (66.5%) and Queensland (65.6%).
Table 19A-8 summarises the labour force participation rates in the LSC LGA, Broadsound – Nebo
Statistical Area, Central Queensland Statistical Area and Queensland between 2006-07 and 2015-
16.
Table 19A-8: Labour force participation rate
Period LSC LGA Broadsound – Central Queensland
Nebo SA2 Queensland SA4
2006-07 56.2% 71.6% 64.6% 65.6%
2007-08 56.7% 72.6% 66.0% 65.3%
2008-09 58.0% 73.5% 66.5% 65.6%
2009-10 57.9% 74.0% 65.4% 66.1%
2010-11 63.4% 78.1% 70.5% 67.0%
2011-12 61.4% 78.0% 67.8% 66.1%
2012-13 59.0% 80.5% 64.9% 65.1%
2013-14 60.6% 80.6% 66.9% 65.1%
2014-15 60.7% 77.4% 67.1% 64.8%
2015-16 59.6% 84.8% 65.5% 64.7%
Average, 2006-07 to 2015-16 59.4% 77.1% 66.5% 65.6%
Average, 2011-12 to 2015-16 60.3% 80.2% 66.4% 65.2%
Average, 2014-15 to 2015-16 60.1% 81.1% 66.3% 64.7%
Source: Department of Employment (various years), ABS 2015, QGSO (2016)
CQC SEIS, Version 3, October 2020 19A-15Central Queensland Coal Project
Chapter 19A - Economic
19A.3.2.4 Employment by Industry
In the LSC LGA, 11.4% and 10.9% of persons were employed in the health care and social
assistance and education and training sectors respectively, as of the 2016 census. In Broadsound –
Nebo Statistical Area, 40.3% and 13.8% of persons were employed in the mining and agriculture,
forestry and fishing sectors respectively. The LSC LGA and Broadsound-Nebo Statistical Area both
recorded a lower incidence of employment in manufacturing and transport, postal and
warehousing relative to the Central Queensland Statistical Area and Queensland.
The proportion of employment by industry sector in the LSC LGA, Broadsound – Nebo Statistical
Area, Central Queensland Statistical Area and Queensland in 2016 is summarised in Table 19A-9.
Table 19A-9: Employment by industry
Industry LSC LGA Broadsound Central Queensland
– Nebo SA2 Queensland
SA4
Construction 9.718% 3.1% 8.2% 9.0%
Wholesale trade 2.3% 0.9% 2.4% 2.6%
Retail trade 9.724% 5.0% 9.6% 9.9%
Accommodation and food services 7.3% 6.0% 6.7% 7.3%
Transport, postal and warehousing 4.0% 4.4% 5.9% 5.1%
Information media and telecommunications 0.6% 0.2% 0.5% 1.2%
Financial and insurance services 1.3% 0.2% 1.1% 2.5%
Rental, hiring and real estate services 1.6% 0.4% 1.5% 2.0%
Professional, scientific and technical 3.6% 1.2% 3.9% 6.3%
services
Administrative and support services 3.1% 4.0% 2.9% 3.5%
Public administration and safety 6.4% 3.5% 5.5% 6.6%
Education and training 10.9% 6.1% 9.0% 9.0%
Health care and social assistance 11.4% 3.0% 10.5% 13.0%
Arts and recreation services 1.1% 0.4% 0.8% 1.6%
Other services 4.2% 3.0% 4.1% 3.9%
Total 15,425 3,898 97,655 2,136,455
Source: QGSO 2017a, b, QGSO 2016
19A.3.2.5 Occupation Type
The LSC LGA recorded a marginally higher proportion of upper white collar workers than Central
Queensland Statistical Area though lower than the state average. The LSC LGA, Broadsound-Nebo
Statistical Area and Central Queensland Statistical Area recorded significantly higher proportions
of blue collar workers relative to Queensland as of the 2016 census.
The proportion of employment by occupation in the LSC LGA, Broadsound – Nebo Statistical Area,
Central Queensland Statistical Area and Queensland as of the 2016 census is summarised in Figure
19A-4.
CQC SEIS, Version 3, October 2020 19A-16Central Queensland Coal Project
Chapter 19A - Economic
Queensland
Central Lower Blue
Queensland Collar
SA4 Upper Blue
Collar
Broadsound - Nebo SA2 Lower White
Collar
Livingstone LGA
0% 5% 10% 15% 20% 25% 30% 35% 40% 45%
Source: QGSO 2017a, b, QGSO 2016
Figure 19A-5: Employment by occupation type
19A.3.2.6 Qualifications
This section has been updated to include the Broadsound-Nebo Statistical Area and the updated
Central Queensland Statistical Area. The LSC LGA data has been kept to facilitate reading. The
incidence of persons with a post school qualification in the LSC LGA was higher than in
Broadsound-Nebo Statistical Area and Central Queensland SA4, though lower than the state
average. The incidence of persons with a certificate is higher in the LSC LGA, Broadsound-Nebo
Statistical Area and Central Queensland Statistical Area than Queensland.
The proportion of the population aged 15 years and over with postgraduate, bachelor, diploma
and certificate qualifications in the LSC LGA, Broadsound – Nebo Statistical Area, Central
Queensland Statistical Area and Queensland as of the 2016 census is summarised in Figure 19A-5.
30%
% of persons with post-school
25%
% of persons with
20% Bachelor or higher
qualifications
% of persons with
15% Diploma
% of persons with
10% Certificate
5%
0%
Livingstone LGA Broadsound - Central Queensland
Nebo SA2 Queensland SA4
Source: QGSO 2017a, b, QGSO 2016
Figure 19A-6: Proportion of persons with a post school qualification
19A.3.2.7 Enterprise Activity
The latest edition of the ABS Counts of Australian Businesses publication presents business count
estimates by industry at the Statistical Area Level 2 level. This section reports the number of
businesses by industry registered within the LSC LGA, Broadsound-Nebo Statistical Area and
Central Queensland SA4. Significant business activity in the region(s) is undertaken by enterprises
CQC SEIS, Version 3, October 2020 19A-17Central Queensland Coal Project
Chapter 19A - Economic
registered outside the region(s). This business register data provides an indication of the number
and capability of locally based businesses.
19A.3.2.7.1 Livingstone Shire
As of February 2017, there was an estimated 3,235 registered businesses in the LSC, with an
estimated 63.6% classified as sole operators. Just under a quarter of all registered businesses were
classified within the agriculture, forestry and fishing Sector (761 businesses) and just over a fifth
were classified within the construction sector (731 businesses). There were 44 businesses within
the LSC LGA that recorded employment of 20-199 workers, comprising six in accommodation and
food services, five in administrative and support services and six in health care and social
assistance. There were no businesses identified within LSC LGA that employed 200 or more
workers.
The count of registered businesses within the LSC LGA by employment size as of February 2017 is
presented in Table 19A-10.
Table 19A-10: Counts of Australian businesses LSC and LGA February 2017
Industry Employing Businesses Total Non- Total
1-19 20-199 200+ Total Employing Businesses
Employing
Agriculture, Forestry and Fishing 21.5% 0.3% 0.0% 21.7% 78.3% 1,100
Mining 52.3% 6.8% 0.0% 59.1% 40.9% 44
Manufacturing 28.0% 3.0% 0.0% 31.0% 69.0% 100
Electricity, Gas, Water and Waste 50.0% 0.0% 0.0% 50.0% 50.0% 10
Services
Construction 48.0% 0.4% 0.0% 48.4% 51.6% 788
Wholesale Trade 25.9% 0.0% 0.0% 25.9% 74.1% 58
Retail Trade 55.6% 4.2% 0.0% 59.7% 40.3% 144
Accommodation and Food Services 66.4% 6.9% 0.0% 73.3% 26.7% 131
Transport, Postal and Warehousing 33.9% 1.6% 0.0% 35.4% 64.6% 192
Information Media and 30.0% 0.0% 0.0% 30.0% 70.0% 10
Telecommunications
Financial and Insurance Services 19.8% 1.6% 0.0% 21.4% 78.6% 192
Rental, Hiring and Real Estate 14.4% 1.0% 0.0% 15.4% 84.6% 312
Services
Professional, Scientific and 36.8% 0.0% 0.0% 36.8% 63.2% 212
Technical Services
Administrative and Support 42.6% 3.9% 0.0% 46.5% 53.5% 129
Services
Public Administration and Safety 100.0% 0.0% 0.0% 100.0% 0.0% 6
Education and Training 40.0% 6.0% 0.0% 46.0% 54.0% 50
Health Care and Social Assistance 48.4% 6.3% 0.0% 54.7% 45.3% 95
Arts and Recreation Services 40.0% 0.0% 0.0% 40.0% 60.0% 45
Other Services 54.4% 0.0% 0.0% 54.4% 45.6% 215
Not Classified 0.0% 0.0% 0.0% 0.0% 100.0% 32
Total 34.7% 1.3% 0.0% 36.0% 64.0% 3,865
Source: Australian Bureau of Statistics (2017d)
CQC SEIS, Version 3, October 2020 19A-18Central Queensland Coal Project
Chapter 19A - Economic
19A.3.2.7.2 Broadsound-Nebo Statistical Area
As of February 2017, there was an estimated 642 registered businesses in Broadsound-Nebo
Statistical Area with an estimated 62% classified as sole operators. Approximately 53% of all
registered businesses were classified within the agriculture, forestry and fishing Sector (339
businesses) and approximately 9% were classified within the construction sector (57 businesses).
There were 6 businesses within the Broadsound-Nebo Statistical Area that recorded employment
of 20-199 workers, comprising three in retail trade and three in accommodation and food services.
There were no businesses identified within Broadsound-Nebo Statistical Area that employed 200
or more workers.
The count of registered businesses within Broadsound-Nebo Statistical Area by employment size
as of February 2017 is presented in Table 19A-11.
Table 19A-11: Counts of Australian businesses, Broadsound – Nebo SA2, February 2017
Industry Employing Businesses Total Non- Total
1-19 20-199 200+ Total Employing Businesses
Employing
Agriculture, Forestry and Fishing 31.9% 0.0% 0.0% 31.9% 68.1% 339
Mining 0.0% 0.0% 0.0% 0.0% 100.0% 9
Manufacturing 30.0% 0.0% 0.0% 30.0% 70.0% 10
Electricity, Gas, Water and Waste - - - - - -
Services
Construction 28.1% 0.0% 0.0% 28.1% 71.9% 57
Wholesale Trade 27.3% 0.0% 0.0% 27.3% 72.7% 11
Retail Trade 68.2% 13.6% 0.0% 81.8% 18.2% 22
Accommodation and Food Services 68.4% 15.8% 0.0% 84.2% 15.8% 19
Transport, Postal and Warehousing 32.3% 0.0% 0.0% 32.3% 67.7% 31
Information Media and - - - - - -
Telecommunications
Financial and Insurance Services 15.8% 0.0% 0.0% 15.8% 84.2% 19
Rental, Hiring and Real Estate 18.8% 0.0% 0.0% 18.8% 81.3% 32
Services
Professional, Scientific and 23.5% 0.0% 0.0% 23.5% 76.5% 17
Technical Services
Administrative and Support 50.0% 0.0% 0.0% 50.0% 50.0% 20
Services
Public Administration and Safety - - - - - -
Education and Training 33.3% 0.0% 0.0% 33.3% 66.7% 9
Health Care and Social Assistance 0.0% 0.0% 0.0% 0.0% 100.0% 6
Arts and Recreation Services 0.0% 0.0% 0.0% 0.0% 100.0% 5
Other Services 56.7% 0.0% 0.0% 56.7% 43.3% 30
Not Classified 0.0% 0.0% 0.0% 0.0% 100.0% 6
Total 32.9% 0.9% 0.0% 33.8% 66.2% 642
Source: Australian Bureau of Statistics (2017d)
CQC SEIS, Version 3, October 2020 19A-19Central Queensland Coal Project
Chapter 19A - Economic
19A.3.2.7.3 Central Queensland SA4
Within Central Queensland SA4, there were an estimated 17,795 registered businesses as of
February 2017, with an estimated 63% of all businesses classified as sole operators. The most
common business types (in terms of number of businesses) in Central Queensland Statistical Area
were agriculture, forestry and fishing (4,763 businesses), construction (2,924 businesses) and
rental, hiring and real estate services (1,610 businesses). As of February 2017, there were no
registered businesses in Central Queensland Statistical Area that employed 200 or more persons.
The count of registered businesses within Central Queensland Statistical Area by employment size
as of February 2017 is presented in Table 19A-12.
Table 19A-12: Counts of Australian businesses, Central Queensland SA4, February 2017
Industry Employing Businesses Total Non- Total
1-19 20-199 200+ Total Employing Businesses
Employing
Agriculture, Forestry and Fishing 18.0% 0.3% 0.0% 18.2% 81.8% 4,763
Mining 51.3% 1.9% 0.0% 53.2% 46.8% 154
Manufacturing 45.9% 5.6% 0.0% 51.4% 48.6% 519
Electricity, Gas, Water and Waste 61.5% 0.0% 0.0% 61.5% 38.5% 52
Services
Construction 45.5% 1.3% 0.0% 46.8% 53.2% 2,924
Wholesale Trade 46.4% 2.1% 0.0% 48.4% 51.6% 289
Retail Trade 60.1% 5.3% 0.0% 65.5% 34.5% 883
Accommodation and Food Services 61.1% 12.4% 0.0% 73.5% 26.5% 671
Transport, Postal and Warehousing 33.0% 1.6% 0.0% 34.5% 65.5% 1,071
Information Media and 21.4% 7.1% 0.0% 28.6% 71.4% 42
Telecommunications
Financial and Insurance Services 17.0% 0.9% 0.0% 17.9% 82.1% 955
Rental, Hiring and Real Estate 16.7% 1.2% 0.0% 17.9% 82.1% 1,610
Services
Professional, Scientific and 46.6% 2.1% 0.0% 48.6% 51.4% 1,061
Technical Services
Administrative and Support 45.3% 4.6% 0.0% 49.9% 50.1% 523
Services
Public Administration and Safety 54.5% 0.0% 0.0% 54.5% 45.5% 44
Education and Training 60.8% 3.1% 0.0% 63.9% 36.1% 194
Health Care and Social Assistance 49.0% 3.6% 0.0% 52.6% 47.4% 661
Arts and Recreation Services 40.2% 3.7% 0.0% 43.9% 56.1% 164
Other Services 55.1% 1.5% 0.0% 56.6% 43.4% 1,044
Not Classified 15.8% 0.0% 0.0% 15.8% 84.2% 171
Total 35.2% 2.0% 0.0% 37.3% 62.7% 17,795
Source: Australian Bureau of Statistics (2017d)
19A.3.2.7.4 Regional Comparison
In the LSC LGA, 22.6% of registered businesses were within the construction sector, as compared
to 8.9% in Broadsound – Nebo Statistical Area, 16.4% of registered businesses in Central
CQC SEIS, Version 3, October 2020 19A-20You can also read