Can the bull market continue? - Presentation to Momentum Think Tank 2020 Steven Bell, Chief Economist - Momentum Global Investment ...
←
→
Page content transcription
If your browser does not render page correctly, please read the page content below

Private and confidential

Can the bull market continue?
Presentation to Momentum Think Tank 2020

Steven Bell, Chief Economist

                                           21st September 2020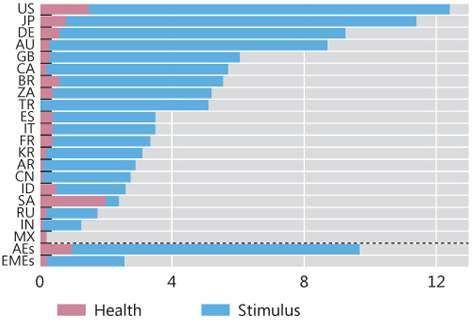
Key Issues   The virus: is it winning?

             US politics: likely outcomes, likely impact

             Can the bull market continue?

                                                 2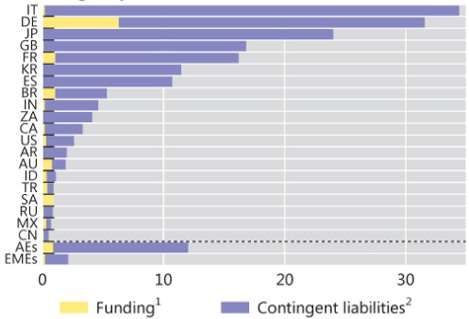
Tracking Covid-19
US second wave turns, possibly in Europe too                                                                                 …new cases tumble in key US states
                                                                80,000                                                                                                   7%
                                                                                Daily Coronavirus New Cases                                                                        Daily % Increase in Total Coronavirus Cases

                                                                                                                              Increase in Confirmed Cases (7 day m.a.)
                                                                70,000

                                Daily Cases (7 day mov. ave.)
                                                                                                                                                                         6%
                                                                                                                                                                                               Arizona        Florida
                                                                60,000
                                                                                                                                                                         5%
                                                                50,000
                                                                                                    US                                                                   4%                                       Texas
                                                                40,000
                                                                                                                                                                                            South Carolina
                                                                                                                                                                         3%
                                                                30,000
                                                                                                                                                                         2%                                                      California
                                                                20,000
                                                                                                                                                                                                Nevada
                                                                                                              Europe
                                                                10,000                                                                                                   1%

                                                                    0                                                                                                    0%
                                                                         Mar   Apr    May     Jun     Jul      Aug     Sep                                                01 May   22 May      12 Jun    03 Jul    24 Jul   14 Aug       04 Sep

Source: BMO Global Asset Management and Bloomberg, as at 7 September 2020                                                    Source: BMO Global Asset Management and Bloomberg, as at 7 September 2020
                                                                                                                             .

•      Europe had been outperforming the US but the gap has narrowed markedly
•      Global daily cases of COVID-19 continue to rise. Daily deaths have fallen from their peak.
•      Medical progress in therapeutics and testing has been remarkable. Oxford vaccine trials are critical as it is months ahead of rivals and could be available in
       large quantities by the autumn. Uncertainty remains until results are published and analysed. The recent halt to the trial is worrying but probably not critical.

                              Past performance is not indicative of future performance.

                                                                                                                                                                                                                                                  3
Second Waves in Europe
Daily % increase in Total Coronavirus cases
3.0%
Increase in Confirmed Cases (7
UK
2.5%
France
day m.a.) 2.0%
Spain
1.5%
1.0%
Netherlands
0.5%
Germany Italy
0.0%
01 May 01 Jun 01 Jul 01 Aug 01 Sep
Source: BMO Global Asset Management and Bloomberg as at 7 September 2020
4Tracking Covid-19
Some EM countries are suffering badly … …but infections among the UK general public are flat
90,000
Daily Coronavirus New Cases % testing positive for COVID-19
80,000 0.5
Daily Cases (7 day mov. ave.)
India
70,000
0.4
60,000
50,000 0.3
Brazil
40,000
0.2
30,000
20,000 0.1
Russia
10,000 Mexico
Saudi Arabia 0.0
0 6 May to 20 May 3 Jun to 17 Jun to 1 Jul to 15 Jul to 29 Jul to 12 Aug to
Mar Apr May Jun Jul Aug Sep 19 May to 2 Jun 16 Jun 30 Jun 14 Jul 28 Jul 11 Aug 25 Aug
Source: BMO Global Asset Management and Bloomberg, as at 7 September 2020 Source: ONS, as at 3 September 2020
.
• The virus seems to be out of control in certain EM where social distancing is impractical and health care systems are inadequate
• A high quality UK study of infection within the community (excluding those in hospital etc.) shows a rate of incidence that has been flat since lockdowns
were eased. Separate data show a sharp rise in new cases and a limited national lockdown has been reimposed.
Past performance is not indicative of future performance.
5A global recession
2020 growth forecasts are edging up except in UK .. …and data surprises remain positive
6 50 125
Forecasts GDP Growth
4 40 100
Global Economic
Forecast GDP (% year / year) 2 30 Surprise Index 75
(Goldman Sachs)
20 50
0
Canada 10 25
EM
Index
-2
Index
0 0
-4
US -10 -25
-6 -20 -50
Euro Area
-8 -30 Global Economic -75
Surpise Index (Citi)
-10 -40 -100
UK
-12 -50 -125
Jan Feb Mar Apr May Jun Jul Aug Sep 2015 2016 2017 2018 2019 2020
Source: Bloomberg, as at 3 September 2020 Source: Bloomberg, as at 3 September 2020
• Recent data for European economic activity have come in in weaker than expected. With strong second waves in
France and Spain and a more modest second wave in Germany, hopes of rapid recovery have receded.
• UK data have recently come in much stronger than expected but reimposed lockdown raises risks.
• Despite the well-documented problems with the virus in the US, recent data, notably on housing and the labour
market have been strong. This is a significant surprise. .
Past performance is not indicative of future performance.
6Massive monetary and fiscal support
Central banks cut rates aggressively… …along with very large fiscal support
80 US Budget Balance (% of GDP)
Recession 5
Cumulative Interest Rate cuts in
70
60 0
OECD countries
50
% of GDP
-5
40
30 -10
6m rolling sum
20
-15
10 Consensus
Forecast
0 -20
2000 2003 2006 2009 2012 2015 2018 1970 1980 1990 2000 2010 2020
Source: BMO Global Asset Management and Bloomberg as at September 2020. Note: Central Banks/ countries considered are Source: BMO Global Asset Management and Bloomberg as at September 2020.
ECB, Fed, BoE, Australia, Canada, Chile, Denmark, Hungary, Iceland, Israel, Japan, South Korea, Mexico, New Zealand, Norway,
Poland, Sweden, Switzerland and Turkey.
• Cutting interest rates helps a little but non-traditional measures by central banks help more. Fed buying credit, QE
to infinity and measures by ECB notable.
• Huge fiscal response underway. Many of the massive US measures expire soon and a new package is needed.
Progress has been limited.
Past performance is not indicative of future performance.
7Pledged Fiscal Packages
Budgetary measures Non-budgetary measures
Source: IMF, Fiscal Monitor, April 2020 and update June 2020; IMF, World Economic Outlook; BIS calculations.
Estimates focus on government discretionary measures that supplement existing automatic stabilisers, which differ across countries in their breadth and scope. AEs = AU, CA, DE, ES, FR, GB, IT, JP
and US; EMEs = AR, BR, CN, ID, IN, KR, MX, RU, SA, TR and ZA. For regions, weighted averages based on GDP and PPP exchange rates.
1 Equity injections, asset purchases, loans and debt assumptions, including through extra-budgetary funds. 2 Guarantees on loans and other contingent liabilities such as loans channelled through
public financial agencies.
• Huge support globally is unevenly distributed and hard to gauge.
• The US has led the way of fiscal support but many lower income countries have been unwilling or unable to do
much on this front. Loan guarantees have been a big feature in many countries, notably Japan and Germany (who
can easily afford it) and Italy (who cannot).
Past performance is not indicative of future performance.
8Long-term US real rates fall ever lower
Risk-free rate is very low… …but US jobs needs continued fiscal support
Yield on 10 year US inflation protected security 5000 17.0
1.5
Peak = 1.16 15.0
1 4000
US 13.0
Claims (thousands)
0.5 Unemployment
3000
Rate 11.0
%
%
0
Average US Initial Jobless 9.0
2000
2017 = 0.44 Claims (4 week
-0.5 moving average) 7.0
Latest 1000
-1 = 5.0
-0.99
-1.5 0 3.0
2017 2018 2019 2020 1990 1994 1998 2002 2006 2010 2014 2018
Source: BMO Global Asset Management and Bloomberg, as at 7 September 2020 Source: BMO Global Asset Management and Bloomberg, as at 7 September 2020
• The yield on 10-year US Treasury Inflation-Protected Securities - a key component of the discount rate for assets like equites whose income is likely to rise
with inflation – fell heavily since late 2018 and has recently hit a record low.
• Massive fiscal support, notably in the US has cushioned the blow of sudden, sharp, deep recession. Many forecasters are worried about further economic
weakness as fiscal support is withdrawn. Many measures expired at the end of July and a new package is needed. But low interest rates limit the pressure to
reduce deficits.
Past performance is not indicative of future performance.
9US economy now stronger than Europe again
60
US
Composite PMI Index
50
40
30
Eurozone
20
10
Sep 17 Mar 18 Sep 18 Mar 19 Sep 19 Mar 20
15
Composite PMI Index
US - Eurozone
10
5
0
-5
Sep 17 Mar 18 Sep 18 Mar 19 Sep 19 Mar 20
Source: BMO Global Asset Management and Bloomberg as at 7 September 2020
10US Economy: High Frequency Measures
Big Data Mobility Measures US Daily Travel, dining measures YoY Change
160 20
140 0
Driving
Mar 20 Apr 20 May 20 Jun 20 Jul 20
120
-20
100
Walking Homebase Total
-40
80 Hours Worked
60 Transit -60
US TSA Traveler
40 -80 Throughput
20
-100
OpenTable Seated
0
Diners
Jan 20 Feb 20 Mar 20 Apr 20 May 20 Jun 20 Jul 20 -120
• The recovery in mobility data has largely flattened since mid-June.
Sources: U.S. Transportation Security Agency, Opentable, Homebase, Bloomberg, Apple Mobility Trends Reports. Data through August 2, 2020.
11Politics and Policy
Image source: istock photo
12Who will win the US election?
Trump approval rating has fallen Betting markets pricing Democrat clean sweep
48 100
Trump Approval Rating 90
46 80 Democratic Controlled House
70
44
60 Democratic President
50
%
%
42
40
40 30
20 Democratic Controlled Senate
38
10
36 0
2017 2018 2019 2020 Sep 19 Nov 19 Jan 20 Mar 20 May 20 Jul 20 Sep 20
Source: BMO Global Asset Management and Bloomberg, as at 7 September 2020 Source: BMO Global Asset Management and Bloomberg, as at 7 September 2020
• US election is a major risk for this year and Trump’s approval rating has fallen significantly since the virus struck
• Betting markets and polls suggest the election will be very close but the odds on Democrats regaining the Senate and the White House have risen
• The race remains close
Past performance is not indicative of future performance.
13Europe
Purchasing managers’ indices bounce … …but markets see continue low inflation
Euro Area PMIs German 10y Breakeven
70 1.6
1.4
60
1.2
50
1
PMI Index
Manufacturing
%
40 0.8
0.6
30
0.4
Services
20
0.2
10 0
2017 2018 2019 2020 2016 2017 2018 2019 2020
Source: BMO Global Asset Management and Bloomberg, as at 7 September 2020 Source: BMO Global Asset Management and Bloomberg, as at 7 September 2020
Europe is well on the way to easing the lockdown and the economy has responded.
But second waves are evident in many countries and lockdown easings have been delayed or reversed
Past performance is not indicative of future performance.
14UK overtakes Europe
60
Composite PMI Index
50
UK
40
30
Eurozone
20
10
Sep 17 Mar 18 Sep 18 Mar 19 Sep 19 Mar 20
8
UK - Eurozone
Composite PMI Index
4
0
-4
-8
Sep 17 Mar 18 Sep 18 Mar 19 Sep 19 Mar 20
Source: BMO Global Asset Management and Bloomberg as at 7 September 2020
15UK High Frequency Data shows strong pick up
Electricity Usage normalised for temperature Spending Trends
and long term trend
115 30
Online
Spending Trends (28 day and 7
20
Electrical Power Actual Load
110
10
day averages, % y/y)
Total
Usge (5 day m.a.) 105
0
100 -10
-20
95
-30
90 Offline
-40
85 -50
80 -60
Jan 20 Mar 20 May 20 Jul 20 Jan Feb Mar Apr May Jun Jul Aug Sep
Source: Barclays, as at 7 September 2020 Source: Barclays, as at 7 September 2020
Past performance is not indicative of future performance.
16China versus the world
China’s PMIs back close to pre-covid levels… …and the rest of the world is catching up
60
70 Global Services Jan10-Dec19 Avg: 53.2
Construction Jan10-Dec19 Avg: 59.9 Current:
65 55
Current: 60.2 51.9
60 50
Current: Global Manufacturing Jan10-Dec19 Avg: 51.7
55 55.2 45
PMI Index
50 Current:
Non-Manufacturing Jan10-Dec19 Avg: 55.1 Current 40
45 : 51.0 51.8
Manufacturing Jan10-Dec19 Avg: 51.0 35
40
35 30
30 25
25
20
Source: BMO Global Asset Management and Bloomberg as at 7 September 2020 Source: BMO Global Asset Management and J. P. Morgan as at 8 September 2020.
• China’s more severe lockdown has limited second waves and allowed almost complete recovery.
• The RoW was catching up fast but second waves and higher infection rates means that lockdowns in the US and
parts of Europe have been reimposed or easings delayed. EM countries like India and Brazil are still suffering badly
from the virus.
Past performance is not indicative of future performance.
17Emerging Markets
EM easing on all fronts… …EM PMIs above DM
50 Composite PMIs
Recession 60
Cumulative Interest Rate cuts in
45
55 Emerging Markets
EM (largest 15 by GDP)
40
35 50
30 45
PMI Index
25 40
6m rolling sum
20
35
15 Developed Markets
30
10
5 25
0 20
2000 2003 2006 2009 2012 2015 2018 2018 2019 2020
Source: BMO Global Asset Management and Datastream, as at September 2020 Source: BMO Global Asset Management and Bloomberg, as at September 2020
• Emerging market central banks have turned incrementally dovish year-to-date motivated by slowing growth expectations, continued disinflation and
monetary policy easing in developed economies. There is plenty of headroom for sustained policy accommodation.
• The shift in monetary policy stance seems sustainable given the dovish shift in DM central banks; a broad-based slowdown in both export and domestic EM
growth; continued disinflation from lower energy prices
Past performance is not indicative of future performance.
18Earnings outlook improves…
2020 EPS heavily revised down… …but Q2 results have beaten low expectations
40 20
MSCI All Country EPS Growth S&P 500 2020 Quarterly EPS
30 10
EPS Growth (% y/y)
% growth (year / year) 2021
20 2017 0
2018
2013 2014
10 -10 Q4
2016
2012 2019 Q1
0 -20
2015 Q3
-10 -30
2020 Q2
-20
-40
-30
-50
2012 2013 2014 2015 2016 2017 2018 2019 2020
Jan Feb Mar Apr May Jun Jul Aug Sep
Date forecast made Date Forecast Made
Source: BMO Global Asset Management and Datastream, as at September 2020 Source: BMO Global Asset Management and Bloomberg, as at September 2020
• EPS forecasts for 2020 have been slashed but projections for 2021 are above 2019. Q2 reporting season has seen
a high % of companies beating analysts’. Significant beats on a cap-weighted basis are less impressive. With
economic data surging, estimates for earnings in 2020H2 may start to improve but a setback to economic recovery
in the US and Europe could lead to a double dip unless a vaccine come to the rescue.
Past performance is not indicative of future performance.
19…and could improve further
Bounce in EPS forecasts … …and guidance is strong
US Earnings 30% 75
50
Earnings Revisions (%, 4w mov av)
40 20% S&P 500 Earnings Revisions
S&P 500 12m forward ((Upgrades - Downgrades) / Total)
EPS Growth (%yoy) 30 EPS change (% yoy) 10%
20 0% 50
10
Index
-10%
0
-20%
-10
-30% US Company Profit 25
-20 Outlook Index
Model -40%
-30 estimate
-40 -50%
-50 -60% 0
1998 2001 2004 2007 2010 2013 2016 2019 Jan 19 Apr 19 Jul 19 Oct 19 Jan 20 Apr 20 Jul 20
Source: BMO Global Asset Management, Bloomberg and Datastream, as at September Source: BMO Global Asset Management, Bloomberg and Datastream, as at September
2020 2020
• The recent Q2 earnings season at -35% y/y is the worst since the GFC but came in better than expected. EPS surprise (+22%) for those that have reported
has been the strongest since 2009 but sales surprise has not been as strong (+2%). U.S. companies profit-outlook index, compiled by Bloomberg and
based on corporate revisions to forecasts was recently at a record high and remains elevated.
Past performance is not indicative of future performance.
20What news on a vaccine? Classification: only to be shown if not public
• Phase 1/II trials in UK show Oxford vaccine is safe and produces T-cells and
antibodies
• Phase III trials started in June. Recent halt to trials may merely be temporary
setback
• 100 million doses ordered by UK, 300 million by US, 300million by EU
• 30mn due in the UK by September, US may have the vaccine by 3 November
• Moderna started Phase III trials in late July. 9 vaccines in Phase III trails
• High probability that one or more of the vaccines will be successful
Source: BMO Global Asset Management
21Classification: only to be shown if not public
Conclusions:
The virus is fighting back but wil probably be
defeated by a vaccine. This would be a game
changer
US suffering serious second wave, Europe’s second
wave is gathering force
Political uncertainty headed higher in the US. Major
market implications
Life will never be the same again but pre-covid levels of
economic activity and earnings regained by end 2021.
Risk assets would receive boost from good news on a
vaccine
22 22Acronyms, definitions and explanations
EPS = earnings per share. P/E = ratio of share price to earnings
US CPI and PCE deflator There are two common measures of inflation in the US today: the Consumer Price Index (CPI) and the Personal Consumption Expen ditures price
index (PCE) The CPI gets more press, it is used to adjust social security payments and is the reference rate for Treasury Inf lation Protected Securities (TIPS) and inflation swaps.
The Federal Reserve, however, states its goal for inflation in terms of the PCE.
Core consumer prices exclude volatile for and energy. In Japan the core measure excludes fresh food (notably fish); the core core measure also excludes food and energy.
Trimmed mean inflation excludes the extremes of price movements. The closely-followed US PCE version compiled by the Cleveland Federal Reserve excludes the bottom and
top 8% of monthly movements. We think it is a better measure of underlying inflation than the core.
Purchasing managers’ indices, PMIs The Purchasing Managers' Index (PMI) is an index of the prevailing direction of economic trends in the manufacturing and service
sectors. An index of construction is also provided for a few countries. In China, we tend to use the indices complied by the National Bureau of Statistics. The Canadian PMI
relates purely to manufacturing which is more volatile; we use a six month moving average.
Breakeven inflation This is derived either directly from the swap market or as the difference between the yield on conventional government bonds and their inflation-protected
equivalent. 5x5 measures the 5 year breakeven inflation rate 5 years ahead.
BOC. Bank of Canada, BoE Bank of England, Fed, FOMC the FOMC is the rate setting body in the US, part of the Federal Reserve
FTA a free trade agreement that imposes zero tariffs between the countries concerned
Sources: BMO GAM, Cleveland Federal Reserve, Investopedia
23You can also read